
Articles
- Page Path
- HOME > Ann Occup Environ Med > Volume 36; 2024 > Article
- Original Article Association between serum perfluoroalkyl substances concentrations and non-alcoholic fatty liver disease among Korean adults: a cross-sectional study using the National Environmental Health Survey cycle 4
-
Yong Tae Park
 , Eui Yup Chung, Chang Ho Chae, Young Hoon Lee
 -
Annals of Occupational and Environmental Medicine 2024;36:e10.
DOI: https://doi.org/10.35371/aoem.2024.36.e10
Published online: April 8, 2024
Department of Occupational and Environmental Medicine, Samsung Changwon Hospital, Sungkyunkwan University School of Medicine, Changwon, Korea.
- Correspondence: Eui Yup Chung. Department of Occupational and Environmental Medicine, Samsung Changwon Hospital, Sungkyunkwan University School of Medicine, 158 Paryong-ro, Masanhoewon-gu, Changwon 51353, Korea. oemeuiyup@daum.net
• Received: November 22, 2023 • Revised: February 20, 2024 • Accepted: March 28, 2024
Copyright © 2024 Korean Society of Occupational & Environmental Medicine
This is an Open Access article distributed under the terms of the Creative Commons Attribution Non-Commercial License (https://creativecommons.org/licenses/by-nc/4.0/) which permits unrestricted non-commercial use, distribution, and reproduction in any medium, provided the original work is properly cited.
Abstract
-
Background Perfluoroalkyl substances (PFAS) are widely used in industry and daily life due to their useful properties. They have a long half-life, accumulate in the body, and there is evidence that they are associated with biomarkers of lipid metabolism and liver damage. This may suggest non-alcoholic fatty liver disease (NAFLD) caused by PFAS. However, since there has been no study analyzing the relationship between PFAS and NAFLD in the entire population in Korea. We sought to confirm the relationship between serum PFAS concentration and NAFLD prevalence in Korean adults using the Korean National Environmental Health Survey (KoNEHS) cycle 4.
-
Methods The study was conducted on 2,529 subjects in 2018–2019 among KoNEHS participants. For the diagnosis of NAFLD, the hepatic steatosis index (HSI) was used, and the geometric mean and concentration distribution of serum PFAS were presented. Logistic regression was performed to confirm the increase in the risk of NAFLD due to changes in PFAS concentration, and the odds ratio and 95% confidence interval (CI) were calculated.
-
Results In both adjusted and unadjusted models, an increased odds ratio was observed with increasing serum concentrations of total PFAS and perfluorooctane sulfonate (PFOS) in the non-obese group. In the adjusted model, the odds ratios for serum total PFAS and PFOS were 6.401 (95% CI: 1.883–21.758) and 7.018 (95% CI: 2.688–18.319).
-
Conclusions In this study, a higher risk of NAFLD based on HSI was associated with serum total PFAS, PFOS in non-obese group. Further research based on radiological or histological evidence for NAFLD diagnosis and long-term prospective studies are necessary. Accordingly, it is necessary to find ways to reduce exposure to PFAS in industry and daily life.
BACKGROUND
Non-alcoholic fatty liver disease (NAFLD) is a condition characterized by the accumulation of ≥ 5% intrahepatic fat without apparent causes such as excessive alcohol consumption or viral hepatitis.1 NAFLD encompasses a spectrum of liver pathologies ranging from simple steatosis (non-inflammatory, non-fibrous fatty liver) to non-alcoholic steatohepatitis and non-alcoholic fatty liver-related cirrhosis. Various mechanisms, including increased energy intake, enhanced hepatic lipogenesis, and decreased hepatic secretion of triglycerides (TG), contribute to the development of fatty liver diseases.2 These conditions are associated with not only increased liver-related but also cardiovascular and overall mortality.3 The worldwide prevalence of NAFLD ranges from 13% in Africa to 42% in Southeast Asia.4 In South Korea, the prevalence of NAFLD has seen a significant increase from 19.7% in 1998 to 30.7% in 2017.5 While dietary and sedentary lifestyle changes are the primary contributors to the rise of NAFLD in South Korea,6 common environmental chemicals may also disrupt hepatic lipid homeostasis and contribute to liver fat deposition.7
Endocrine-disrupting chemicals (EDCs) are group of heterogeneous chemicals widely distributed in the living environment that readily accumulate in the body. EDCs interfere with the production, release, transport, metabolism, binding, action, and elimination of hormones in the body, leading to hormonal imbalances and causing various metabolic disorders.8 Perfluoroalkyl substances (PFAS), a type of EDC, have been persistent environmental contaminants for over 60 years.9 Their production and consumption have seen a significant increase in South Korea due to industrialization and economic growth.10 To date, approximately 15,000 PFAS compounds are known to exist.11 Due to their hydrophobicity, resistance to degradation, and stable structure, PFAS are widely used materials in consumer products such as non-stick cookware, waterproof fabrics, food packaging, and outdoor equipment.12 With a significant number of carbon-fluorine bonds, known as the strongest bonds in organic chemistry, PFAS are resistant to decomposition, leading to their bioaccumulation in the environment, as well as in animals and humans. The half-life of PFAS in the human blood is 3.5 years for perfluorooctanoic acid (PFOA), 4.8 years for perfluorooctane sulfonate (PFOS), and 7.3 years for perfluorohexane sulfonic acid (PFHxS).13 As evidence of potential adverse effects on the environment and human health continued to accumulate, regulations governing the production and use of PFAS began to be implemented in the 2000s, leading to an increased adoption of alternative substances.14 However, people can still be exposed to PFAS through contaminated drinking water, food and various consumer products, and PFAS have been consistently detected in purified tap water in South Korea.10
Many previous studies have demonstrated the association between exposure to PFAS with various health issues affecting the immune system, renal function, thyroid function, cancer development, the reproductive system, and metabolic disorders.15 However, the liver could be one of the major target organs for PFAS toxicity. The liver detoxifies harmful external chemicals, and PFAS is discovered in the liver at concentrations several times higher than in the serum due to its strong protein affinity.16 Exposure to certain PFAS has been linked to elevated serum transaminase levels and the development of fatty liver with hepatocellular hypertrophy in both humans and rats.15 Furthermore, PFAS exposure can increase total cholesterol and low-density lipoprotein cholesterol (LDL-C) levels in the blood of adults and children.17,18 Given that the liver plays a crucial role in regulating cholesterol homeostasis,19 persistently elevated serum cholesterol levels, along with elevated biomarker such as alanine aminotransferase (ALT), which reflect liver cell damage, could be indicative of NAFLD due to PFAS-induced hepatic toxicity.
The Ministry of Environment and the National Institute of Environmental Research jointly conducted the Korean National Environmental Health Survey (KoNEHS) cycle 4 from 2018 to 2020. This population-based epidemiological survey conducted in South Korea included data on the serum concentrations of the majority exposure PFAS, such as PFOA, PFOS, PFHxS, perfluorononanoic acid (PFNA), and perfluorodecanoic acid (PFDeA). Using nationwide raw data for the first time, this study investigated the association between PFAS serum concentrations and the prevalence of NAFLD in Korean adults based on KoNEHS cycle 4 data.
METHODS
In this study, a secondary analysis was conducted based on the raw data collected during cycle 4 of the KoNEHS from 2018 to 2020. KoNEHS has been conducted every 3 years since 2009 at the national and regional levels, with the objectives of assessing levels of exposure to environmental chemicals and analyzing their temporal and spatial distributions as well as their determinants. To ensure the representativeness of the Korean adult population, KoNEHS employs a stratified cluster sampling method. Initially, 245 sample survey areas are selected, stratified by administrative district and coastal area. Subsequently, a systematic sampling method is used to select 15 households in each sampled area, resulting in the examination of approximately 15 individuals per sample survey area. The survey encompasses questionnaire surveys, anthropometric measurements, blood pressure measurements, and the collection of biological specimens.
The cycle 4 survey targeted a total of 4,239 adults (≥ 18 years), comprising 1,889 males and 2,350 females. However, due to the coronavirus disease 2019 pandemic in 2020, the survey method was adapted to minimize direct personal contact, and anthropometric measurements, blood pressure measurements, and blood collection were omitted. As a result, 1,244 individuals were excluded from the study. After excluding 315 individuals with high alcohol consumption (defined as males and females who consume 7 or 5 glasses of alcohol or more, respectively, in one sitting on three or more days per week), 23 individuals with pre-existing liver diseases, 50 individuals with an aspartate aminotransferase (AST)/ALT ratio ≥ 2,20 and 12 individuals with missing data, a total of 2,595 individuals were retained for analysis (Fig. 1).
Fig. 1

Selection of analytic samples in this study.
KoNEHS: the Korean National Environmental Health Survey; AST: aspartate aminotransferase; ALT: alanine aminotransferase; NAFLD: non-alcoholic fatty liver disease.
We analyzed the most common ones, namely PFOA, PFOS, PFHxS, PFNA, and PFDeA. The compounds were separated and quantitatively analyzed using the Q-Sight Triple Quad high-performance liquid chromatography mass spectrometer (Perkin-Elmer, Waltham, MA, USA). The detection limit for each of these compounds was determined to be 0.050 µg/L for PFOA, 0.056 µg/L for PFOS, 0.071 µg/L for PFHxS, 0.019 µg/L for PFNA, and 0.017 µg/L for PFDeA. All measurements were above limit of detection. Total PFAS was defined as the sum of serum PFOA, PFOS, PFHxS, PFNA concentration.
The hepatic steatosis index (HSI) is a method for diagnosing fatty liver disease that was developed based on samples from 10,724 Koreans diagnosed with NAFLD through ultrasound during health checkups. The HSI comprises variables such as ALT, AST, body mass index (BMI), sex, and diabetes mellitus (DM) status.
In a validation study involving another group of Koreans, the HSI demonstrated relatively high efficiency with an area under the receiver operating characteristic of 0.85, confirming its validity as an efficient and less invasive biomarker22 for diagnosing NAFLD. Participants were classified into NAFLD and non-NAFLD groups using the established cutoff value of 36.21
Demographic and lifestyle characteristics, including age, sex, alcohol and smoking habits, physical activity, monthly household income, and education, were assessed through face-to-face interviews. The response categories were defined as follows: alcohol consumption was classified into non-drinkers, those with a history of alcohol consumption but no consumption in the past year, and current alcohol consumers; smoking status was categorized as non-smoker, former smoker, and current smoker; physical activity levels were divided into none, regular exercise without significant sweating, and intensive exercise with sweating; monthly household income was segmented into less than 2 million, 2–3 million, 3–5 million, and over 5 million Korean won; and education levels were classified as lower than high school, high school, and college or higher. Hypertension was defined as individuals who reported taking antihypertensive medications or had a self-reported history of hypertension. DM was defined as individuals who reported a history of DM, were taking antidiabetic medications, or had a glycated hemoglobin level of 6.5 or higher. Dyslipidemia was defined as having a self-reported history of dyslipidemia, taking dyslipidemia medications, or meeting the criteria from the Fifth Edition of the Guidelines for the Management of Dyslipidemia, which includes a high-density lipoprotein cholesterol level of less than 40 mg/dL or a total cholesterol level of 240 mg/dL or higher. LDL-C was not included in the blood test panel, and the triglyceride levels were unreliable due to the inability to confirm the fasting status of the subjects. Therefore, LDL-C and triglyceride levels were not included in the diagnostic criteria for dyslipidemia. BMI was calculated as weight (kg) divided by height (m) squared, with a threshold of 25 used to classify as normal if below or obese if equal to or above.
Frequencies and percentages were used to capture participants’ general characteristics in the non-NAFLD and NAFLD groups classified according to the HSI. To ensure a nationwide representativeness of the data, all analyses were conducted with the sample weights included. Only the unweighted numbers of participants (n) were provided. Generally, environmental exposure occurred at low concentrations, and given that the serum PFAS concentration distribution deviated from a normal distribution, log transformation was performed for analysis.23 Therefore, the concentration of serum PFAS was presented as geometric mean and geometric standard deviation. Based on the weighted sample distribution, the median and interquartile range of PFAS concentration according to the NAFLD status, sex, age group, and BMI were presented to investigate the distribution of PFAS concentration according to variables. General characteristics were compared using t-tests (for continuous variables) and χ2 tests (for categorical variables). To evaluate the relationship between serum PFAS levels and NAFLD, logistic regression analysis was performed. As it is used in the HSI formula, BMI was not included as an independent variable to avoid multicollinearity. Sex and DM were used as independent variables in the analysis. In the crude model, only PFAS concentration and NAFLD were compared. In model 1, age group and sex were added as covariates, and in the final model 2, smoking status, physical activity, monthly household income, education level, hypertension, diabetes, and dyslipidemia status were additionally included as covariates in the regression model. To demonstrate that the risk of NAFLD was not due to obesity but rather due to PFAS exposure, stratified analysis was conducted based on a BMI threshold of 25. Statistical analysis was performed using the SPSS version 26.0 (IBM Corp., Armonk, NY, USA), and a p-value < 0.05 was considered statistically significant.
The present study protocol was reviewed and approved by the Institutional Review Board (IRB) of Samsung Changwon Hospital (IRB No. 2023-011-009).
RESULTS
Based on the HSI, of a total of 2,595 participants, 1,768 individuals (68.68%) were classified into the non-NAFLD group and 827 individuals (31.31%) into the NAFLD group. There were no significant intergroup differences in terms of age group, alcohol consumption, physical activity, monthly household income, and education level. However, significantly higher proportions of males and current smokers were observed in the NAFLD group compared to the non-NAFLD group (p < 0.001). Additionally, the NAFLD group exhibited significantly higher BMI and AST, ALT, and gamma-glutamyl transferase (GGT) levels compared to the non-NAFLD group (each p < 0.001). The geometric mean serum concentration of the total PFAS was 30.15 µg/dL, with 28.76 µg/dL in the non-NAFLD group and 31.80 µg/dL in the NAFLD group, showing a statistically significant difference (p = 0.005). In addition to total PFAS, PFOS, and PFNA had significantly higher mean values in the NAFLD group (p = 0.003 and p = 0.028, respectively). While PFOA, PFHxS, and PFDeA did not show statistically significant intergroup differences, their mean values were higher in the NAFLD group (Table 1).
Table 1
General characteristics of the study population according to NAFLD
Values are presented as mean ± standard deviation or sample size (weighted %).
NAFLD: non-alcoholic fatty liver disease; n: unweighted sample size; BMI: body mass index; AST: aspartate aminotransferase; ALT: alanine aminotransferase; GGT: gamma-glutamyl transferase; PFAS: perfluoroalkyl substances; PFOA: perfluorooctanoic acid; PFOS: perfluorooctansulfonate; PFHxS: perfluorohexanesulfonic acid; PFNA: perfluorononanoic acid; PFDeA: perfluorodecanoic acid.
aThe p-value calculated by t-test(continuous) or chi-square test (categorial); bObese, BMI ≥ 25; cPeople who have not consumed alcohol within 1 year; dExercising, but not enough to sweat; eMillion Korean won.
The median and interquartile range of serum total PFAS, PFOA, PFOS, PFHxS, PFNA, and PFDeA in all study populations were 29.29 (9.62–15.32), 6.31 (2.09–3.06), 14.74 (5.25–7.89), 3.96 (1.52–2.61), 2.04 (0.77–1.15), 0.86 (0.27–0.44) respectively. The NAFLD group showed higher serum PFAS concentrations than the non-NAFLD group in all quartiles except the first quartile of PFDeA. Men and elder age groups were found to have higher serum PFAS concentrations compared to the same quartile (Table 2).
Table 2
Distribution of serum PFAS concentrations (μg/L) according to NAFLD status, sex, age group and BMI
Values are presented as median (interquartile range).
Quartile of serum PFAS levels were calculated using weighted samples.
PFAS: perfluoroalkyl substances; NAFLD: non-alcoholic fatty liver disease; BMI: body mass index; PFOA: perfluorooctanoic acid; PFOS: perfluorooctansulfonate; PFHxS: perfluorohexanesulfonic acid; PFNA: perfluorononanoic acid; PFDeA: perfluorodecanoic acid; n: unweighted sample size.
aNormal, BMI < 25; obese, BMI ≥ 25.
The risk of developing NAFLD with an increase by 1 unit in common log transformed serum PFAS concentration was presented along with the 95% confidence interval (CI).
In the crude model, total serum PFAS, PFOS, and PFNA showed an increased risk of developing NAFLD as PFAS concentration increased, with odds ratios (ORs) of 1.956 (95% CI: 1.234–3.100), 1.917 (95% CI: 1.283–2.863), and 1.658 (95% CI: 1.068–2.574), respectively.
In model 1, total PFAS and PFOS were associated with an increased risk of developing NAFLD, with an OR of 2.027 (95% CI: 1.106–3.717) and 2.094 (95% CI: 1.285–3.414), respectively.
In Model 2, only PFOS showed ORs of 1.981 (95% CI: 1.170–3.356), indicating an increase in NAFLD occurrence with increasing concentration. Total PFAS, PFOA, PFHxS, and PFDeA did not show a significant increase in NAFLD risk with increasing serum concentration (Table 3).
Table 3
The risk of NAFLD by PFAS concentration
Values are presented as odds ratio (95% confidence interval).
NAFLD: non-alcoholic fatty liver disease; PFAS: perfluoroalkyl substances; PFOA: perfluorooctanoic acid; PFOS: perfluorooctansulfonate; PFHxS: perfluorohexanesulfonic acid; PFNA: perfluorononanoic acid; PFDeA: perfluorodecanoic acid.
aSerum PFAS, NAFLD based on hepatic steatosis index score; bCrude + adiusted for age(group), sex; cModel 1 + adiusted for smoking history, physical activity, monthly household income, education, hypertension, diabetes, dyslipidemia.
In Crude model within normal BMI group, total serum PFAS, PFOS, and PFDeA showed an increased risk of developing NAFLD as PFAS concentration increased, with ORs of 6.401 (95% CI: 1.863–21.758), 7.018 (95% CI: 2.688–18.319), and 4.008 (95% CI: 1.022–15.720), respectively. Conversely, in the obese group, an increase in the concentration of PFDeA was associated with a decreased risk of NAFLD occurrence, with an OR of 0.515 (95% CI: 0.315–0.843).
In model 1 within normal BMI group, total serum PFAS and PFOS were associated with an increased risk of developing NAFLD, with an OR of 7.642 (95% CI: 1.850–31.560) and 9.21 (95% CI: 3.346–25.353), respectively.
In model 2 within normal BMI group, total PFAS, PFOS showed ORs of 5.207 (95% CI: 1.480–18.323) and 7.030 (95% CI: 2.687–18.392), respectively, indicating an increase in NAFLD occurrence with increasing concentration. PFOA, PFHxS, and PFDeA did not show a significant increase in NAFLD risk with increasing serum concentration. Furthermore, in the obese group, no significant correlation was observed in model 2 between the risk of NAFLD and the concentration of any PFAS compound (Table 4).
Table 4
The risk of NAFLD by PFAS concentration to stratified on BMI
Values are presented as odds ratio (95% confidence interval).
NAFLD: non-alcoholic fatty liver disease; PFAS: perfluoroalkyl substances; BMI: body mass index; PFOA: perfluorooctanoic acid; PFOS: perfluorooctansulfonate; PFHxS: perfluorohexanesulfonic acid; PFNA: perfluorononanoic acid; PFDeA: perfluorodecanoic acid.
aSerum PFAS, NAFLD based on hepatic steatosis index score; bCrude + adiusted for age (group), sex; cModel 1 + adiusted for smoking history, physical activity, monthly household income, education, hypertension, diabetes, dyslipidemia; dNormal, BMI < 25; eObese, BMI ≥ 25.
DISCUSSION
This study is the first to analyze the association between serum PFAS concentration and the risk of developing NAFLD based on the HSI score using data from the KoNEHS cycle 4. A higher risk of NAFLD was found to be associated with an increase in the serum concentration of some PFAS compounds. Both the crude model and the model2 showed that increasing serum concentrations of total PFAS and PFOS were associated with an increased risk of NAFLD occurrence. Furthermore, when stratified by BMI, total PFAS and PFOS were found to increase the risk of NAFLD in the normal weight group in all models. However, in the obese group of the final model 2, no significant correlation was observed between any PFAS compound and the risk of NAFLD. The results showed differences from the US National Health and Nutrition Examination Survey studies reporting some associations between certain PFAS and NAFLD risks among obese individuals.24,25 However, in the Canadian Health Measures Survey study, a significant association between PFHxS and alkaline phosphatase, was observed only non-obese participants.26 Moreover, in an exploratory study aiming to expand the scope of the KoNEHS cycle 4, conducted by randomly selecting some participants from KoNEHS cycle 3, the association between serum PFAS levels and liver enzymes was observed, with a higher association between PFAS and ALT and GGT elevation among non-obese participants.27 Additionally, there is a lack of studies confirming the association between PFAS and NAFLD among other Asian populations, and such studies have not stratified analyses based on BMI, making direct comparisons with our study is difficult.28
PFAS levels may vary due to lifestyle, environmental factors, etc., and may show differences in metabolic and hepatotoxic effects depending on population characteristics. Although limited by the constraints of cross-sectional studies, we can speculate that factors such as diabetes (OR: 6.069; 95% CI: 2.011–18.318) or hyperlipidemia (OR: 1.555; 95% CI: 1.059–2.282) might have had a greater impact among the obese group in our study. Further research is warranted to elucidate these relationships.
Free fatty acids (FFA) introduced into the liver or generated within the liver are converted into TG, which are then either released from liver cells in the form of very-low-density lipoproteins (VLDL) or utilized as an energy source through the mitochondria beta-oxidation process.29 In cases of obesity or insulin resistance, there is an increased influx of FFA into the liver. Excessive intake of FFA beyond the normal physiological capacity results in heightened oxidative stress, inflammation, and damage to liver cells. As a protective response, TG accumulate in the liver, ultimately leading to the development of NAFLD.30
The mechanism by which PFAS induces NAFLD remains to be clarified. The de novo synthesis of fatty acids in the liver is regulated by various nuclear receptors and cytoplasmic transcription factors, including peroxisome proliferator-activated receptors (PPARs).31 PPAR-α is abundantly distributed in the liver and is broadly involved in the regulation of lipid metabolic processes and inflammatory responses through the regulation of numerous genes involved in fatty acid uptake and activation, ketone production, TG conversion, and activation of peroxisomal and mitochondrial fatty acid oxidation pathways.32 And PPAR-γ is involved in the differentiation of preadipocytes in adipose tissue, regulation of the number of adipocytes, and lipid synthesis and storage.33
PFAS absorbed into the body can increase the number of adipocytes through activation of PPAR-γ in adipose tissue34, induce fat storage, and disrupt lipid homeostasis and energy balance, causing weight gain.35
Due to their protein affinity, PFAS readily bind to liver-fatty acid binding protein. This binding allows PFAS to be transported to the liver and become part of the bile or to the nuclei of liver cells.36 PFAS circulate between the liver and the bile, ultimately accumulating in the liver.37 As a result, they interfere with the transcription of DNA in the hepatocellular nuclei and disrupt the expression of genes involved in lipid metabolism.38 PFAS activate the PPAR-α-mediated peroxisomal β-oxidation pathway, which involves ACOX-1 activation. This activation promotes lipid metabolism in peroxisomes and generates hydrogen peroxide, inducing oxidative stress.39 This causes mitochondrial damage, reduces mitochondrial β-oxidation capacity in the liver, inhibits the secretion of cholesterol and lipids in liver. Through this mechanism, PFAS contribute to lipid accumulation in hepatocytes.39 In addition, PFAS-induced NAFLD is considered to be caused by the activation of constitutive androstane receptor,40 downregulation of nuclear factor erythroid 2-related factor 2,41 and upregulation of nuclear factor kappa B.42
Previous studies have reported an association between PFAS and NAFLD. In a study conducted on a population exposed to PFAS contamination in Suwon using ALT as a surrogate marker for NAFLD, a strong association was found between PFOS and PFOA serum concentrations and elevated ALT levels.43 In another study assessing hepatic histological biopsies of children and youth aged 7–19, higher exposure to PFAS was associated with an increased risk of steatohepatitis, fibrosis, lobular inflammation, and an elevated NAFLD score.44 A systematic review and meta-analysis investigating the link between PFAS and NAFLD45 provided strong evidence of an association between exposure to PFOA, PFOS, and PFNA in both humans and rodents, resulting in elevated serum ALT levels and increased liver weight. For PFHxS, no evidence of liver damage was detected in humans, but steatosis was observed in rodents. There was limited evidence supporting a connection to liver damage for several other PFAS compounds, including PFDeA.
While our results supported the previously observed associations of PFOS with NAFLD, we did not observe a significant risk increase with PFOA and PFNA exposure. Furthermore, we did not find a significant correlation between exposure to PFHxS and PFDeA and the occurrence of NAFLD. Further research is warranted to fully understand the influence of these substances on liver enzymes and NAFLD development.
Such inconsistencies in the findings may arise from disparities in PFAS exposure levels and population characteristics. Since human exposure to PFAS typically involves a mixture of various, highly correlated chemicals, it is crucial to consider their potential synergistic or inhibitory effects when studying their impact. Furthermore, genome-wide studies of NAFLD have identified common genetic variations frequently associated with the condition, such as genetic polymorphisms of microsomal triglyceride transfer protein, a key factor in VLDL synthesis,46 tumor necrosis factor-alpha polymorphisms,47 and single nucleotide polymorphisms of adiponectin.48 Thus, genetic factors may be partially responsible for individual differences in the risk of PFAS exposure on NAFLD development.49
This study has several limitations. First, it is a cross-sectional study based on KoNEHS raw data, and caution is needed when interpreting causal relationships between antecedents and consequences. Further longitudinal studies are necessary for a more precise interpretation of these relationships. Second, only one serum sample was collected from participants, and it may not fully represent their actual PFAS exposure levels. Nevertheless, given that PFAS have a long half-life, the potential for exposure misclassification is believed to be minimal. Third, the diagnosis of NAFLD in this study did not rely on radiological methods or the gold standard of liver biopsy, which could lead to inaccuracies in NAFLD diagnosis. Fourth, due to data limitations, we were unable to adjust for additional drugs and other environmental chemicals that could affect liver function, and the lack of diversity in clinical blood tests did not allow us to consider other factors that might impact metabolic diseases. For example, PFAS are primarily consumed through food intake, but this was not reflected in the study.
Based on the KoNEHS raw data, this study established a relationship between PFAS concentrations and NAFLD risk using a nationwide representative sample of Korean adults. Specifically, our results indicate a positive correlation between levels of total serum PFAS, PFOS and the risk of NAFLD in individuals who are not obese. Since exposure to certain PFAS compounds is associated with an elevated prevalence of NAFLD among Korean adults, it is advisable to minimize PFAS use and exposure. In addition, research is needed on the effects on the human body of short-chain PFAS, which have recently begun to be used to replace legacy PFAS. The study results can serve as a foundational research date for assessing the health implications of PFAS and the findings can be used as evidential support for the development of environmental health policies.
CONCLUSIONS
The health impact of PFAS is not only a significant global environmental issue but also a major concern in South Korea. This cross-sectional study in Korean adults provided evidence of an association between total serum PFAS/PFOS and NAFLD, which was determined by the HSI. To further validate these findings, further research based on radiological or histological evidence for NAFLD diagnosis and long-term prospective studies are necessary. Methods should be explored for reducing PFAS exposure in overall industry and daily life.
Acknowledgements
We appreciate National Institute of Environmental Research making available the raw data of Korean National Environmental Health Survey. To many people, including Chung and reviewers, thanks them for their generous advice. Lastly, I would like to thank my wife, Nakyung, for always encouraging me.
Abbreviations
ALT
alanine aminotransferase
AST
aspartate aminotransferase
BMI
body mass index
CI
confidence interval
DM
diabetes mellitus
EDC
endocrine-disrupting chemical
FFA
free fatty acids
GGT
gamma-glutamyl transferase
HSI
hepatic steatosis index
IRB
Institutional Review Board
KoNEHS
Korean National Environmental Health Survey
LDL-C
low-density lipoprotein cholesterol
NAFLD
non-alcoholic fatty liver disease
OR
odds ratio
PFAS
perfluoroalkyl substances
PFDeA
perfluorodecanoic acid
PFHxS
perfluorohexane sulfonic acid
PFNA
perfluorononanoic acid
PFOA
perfluorooctanoic acid
PFOS
perfluorooctane sulfonate
PPAR
peroxisome proliferator-activated receptor
TG
triglycerides
-
Competing interests: The authors declare that they have no competing interests.
-
Author contributions:
Conceptualization: Park YT.
Data curation: Chung EY, Lee YH.
Formal analysis: Park YT.
Funding acquisition: Chung EY.
Investigation: Park YT, Lee YH.
Methodology: Chung EY, Chae CH.
Software: Park YT.
Validation: Chung EY, Chae CH.
Visualization: Park YT.
Writing - original draft: Park YT.
Writing - review & editing: Park YT, Chung EY, Chae CH.
NOTES
- 1. European Association for the Study of the Liver (EASL). European Association for the Study of Diabetes (EASD). European Association for the Study of Obesity (EASO). EASL-EASD-EASO clinical practice guidelines for the management of non-alcoholic fatty liver disease. J Hepatol 2016;64(6):1388–1402. 27062661.PubMed
- 2. Fang YL, Chen H, Wang CL, Liang L. Pathogenesis of non-alcoholic fatty liver disease in children and adolescence: from “two hit theory” to “multiple hit model”. World J Gastroenterol 2018;24(27):2974–2983. 30038464.ArticlePubMedPMC
- 3. Diehl AM, Day C. Cause, pathogenesis, and treatment of nonalcoholic steatohepatitis. N Engl J Med 2017;377(21):2063–2072. 29166236.ArticlePubMed
- 4. Huang DQ, El-Serag HB, Loomba R. Global epidemiology of NAFLD-related HCC: trends, predictions, risk factors and prevention. Nat Rev Gastroenterol Hepatol 2021;18(4):223–238. 33349658.ArticlePubMedPDF
- 5. Kang SY, Kim YJ, Park HS. Trends in the prevalence of non-alcoholic fatty liver disease and its future predictions in Korean men, 1998–2035. J Clin Med 2020;9(8):2626. 32823604.ArticlePubMedPMC
- 6. Fan JG, Kim SU, Wong VW. New trends on obesity and NAFLD in Asia. J Hepatol 2017;67(4):862–873. 28642059.ArticlePubMed
- 7. Foulds CE, Treviño LS, York B, Walker CL. Endocrine-disrupting chemicals and fatty liver disease. Nat Rev Endocrinol 2017;13(8):445–457. 28524171.ArticlePubMedPMCPDF
- 8. Cano R, Pérez JL, Dávila LA, Ortega Á, Gómez Y, Valero-Cedeño NJ, et al. Role of endocrine-disrupting chemicals in the pathogenesis of non-alcoholic fatty liver disease: a comprehensive review. Int J Mol Sci 2021;22(9):4807. 34062716.ArticlePubMedPMC
- 9. Kim SK, Im JK, Kang YM, Jung SY, Kho YL, Zoh KD. Wastewater treatment plants (WWTPs)-derived national discharge loads of perfluorinated compounds (PFCs). J Hazard Mater 2012;201-202:82–91. 22169145.ArticlePubMed
- 10. Park H, Choo G, Kim H, Oh JE. Evaluation of the current contamination status of PFASs and OPFRs in South Korean tap water associated with its origin. Sci Total Environ 2018;634:1505–1512. 29710648.ArticlePubMed
- 11. CompTox Chemicals Dashboard. Updated 2022]. Accessed October 24, 2023]. https://comptox.epa.gov/dashboard/chemical-lists/PFASSTRUCTV5 .
- 12. Sunderland EM, Hu XC, Dassuncao C, Tokranov AK, Wagner CC, Allen JG. A review of the pathways of human exposure to poly- and perfluoroalkyl substances (PFASs) and present understanding of health effects. J Expo Sci Environ Epidemiol 2019;29(2):131–147. 30470793.ArticlePubMedPMCPDF
- 13. Olsen GW, Burris JM, Ehresman DJ, Froehlich JW, Seacat AM, Butenhoff JL, et al. Half-life of serum elimination of perfluorooctanesulfonate, perfluorohexanesulfonate, and perfluorooctanoate in retired fluorochemical production workers. Environ Health Perspect 2007;115(9):1298–1305. 17805419.ArticlePubMedPMC
- 14. Zhang B, He Y, Huang Y, Hong D, Yao Y, Wang L, et al. Novel and legacy poly- and perfluoroalkyl substances (PFASs) in indoor dust from urban, industrial, and e-waste dismantling areas: the emergence of PFAS alternatives in China. Environ Pollut 2020;263(Pt A):114461. 32251969.ArticlePubMed
- 15. Fenton SE, Ducatman A, Boobis A, DeWitt JC, Lau C, Ng C, et al. Per- and polyfluoroalkyl substance toxicity and human health review: current state of knowledge and strategies for informing future research. Environ Toxicol Chem 2021;40(3):606–630. 33017053.ArticlePubMedPDF
- 16. Lau C, Anitole K, Hodes C, Lai D, Pfahles-Hutchens A, Seed J. Perfluoroalkyl acids: a review of monitoring and toxicological findings. Toxicol Sci 2007;99(2):366–394. 17519394.ArticlePubMed
- 17. Zeng XW, Qian Z, Emo B, Vaughn M, Bao J, Qin XD, et al. Association of polyfluoroalkyl chemical exposure with serum lipids in children. Sci Total Environ 2015;512-513:364–370. 25638651.ArticlePubMed
- 18. Dong Z, Wang H, Yu YY, Li YB, Naidu R, Liu Y. Using 2003–2014 U.S. NHANES data to determine the associations between per- and polyfluoroalkyl substances and cholesterol: trend and implications. Ecotoxicol Environ Saf 2019;173:461–468. 30798190.ArticlePubMed
- 19. Nemes K, Åberg F, Gylling H, Isoniemi H. Cholesterol metabolism in cholestatic liver disease and liver transplantation: from molecular mechanisms to clinical implications. World J Hepatol 2016;8(22):924–932. 27574546.ArticlePubMedPMC
- 20. Pratt DS. Evaluation of liver function. In: Jameson JL, Fauci AS, Kasper DL, Hauser SL, Longo DL, Loscalzo J, editors. Harrison's Principles of Internal Medicine. 20th ed. New York, NY, USA: McGraw-Hill Education; 2018.
- 21. Lee JH, Kim D, Kim HJ, Lee CH, Yang JI, Kim W, et al. Hepatic steatosis index: a simple screening tool reflecting nonalcoholic fatty liver disease. Dig Liver Dis 2010;42(7):503–508. 19766548.ArticlePubMed
- 22. Lee YH, Bang H, Park YM, Bae JC, Lee BW, Kang ES, et al. Non-laboratory-based self-assessment screening score for non-alcoholic fatty liver disease: development, validation and comparison with other scores. PLoS One 2014;9(9):e107584. 25216184.ArticlePubMedPMC
- 23. Feng C, Wang H, Lu N, Chen T, He H, Lu Y, et al. Log-transformation and its implications for data analysis. Shanghai Jingshen Yixue 2014;26(2):105–109.
- 24. Jain RB, Ducatman A. Selective associations of recent low concentrations of perfluoroalkyl substances with liver function biomarkers: NHANES 2011 to 2014 data on US adults aged ≥20 years. J Occup Environ Med 2019;61(4):293–302. 30589657.PubMed
- 25. E L. Zhang S, Jiang X. Association between perfluoroalkyl substances exposure and the prevalence of nonalcoholic fatty liver disease in the different sexes: a study from the National Health and Nutrition Examination Survey 2005–2018. Environ Sci Pollut Res Int 2023;30(15):44292–44303. 36692718.PubMed
- 26. Borghese MM, Liang CL, Owen J, Fisher M. Individual and mixture associations of perfluoroalkyl substances on liver function biomarkers in the Canadian Health Measures Survey. Environ Health 2022;21(1):85. 36104725.ArticlePubMedPMCPDF
- 27. Kim OJ, Kim S, Park EY, Oh JK, Jung SK, Park S, et al. Exposure to serum perfluoroalkyl substances and biomarkers of liver function: the Korean national environmental health survey 2015–2017. Chemosphere 2023;322:138208. 36822523.ArticlePubMed
- 28. Nian M, Li QQ, Bloom M, Qian ZM, Syberg KM, Vaughn MG, et al. Liver function biomarkers disorder is associated with exposure to perfluoroalkyl acids in adults: isomers of C8 health project in China. Environ Res 2019;172:81–88. 30776734.ArticlePubMed
- 29. Sohn JH, Kim TY. Recent update on pathogenesis of nonalcoholic fatty liver disease. Korean J Med 2010;79(5):461–474.
- 30. Yamaguchi K, Yang L, McCall S, Huang J, Yu XX, Pandey SK, et al. Inhibiting triglyceride synthesis improves hepatic steatosis but exacerbates liver damage and fibrosis in obese mice with nonalcoholic steatohepatitis. Hepatology 2007;45(6):1366–1374. 17476695.ArticlePubMed
- 31. Cave MC, Clair HB, Hardesty JE, Falkner KC, Feng W, Clark BJ, et al. Nuclear receptors and nonalcoholic fatty liver disease. Biochim Biophys Acta 2016;1859(9):1083–1099. 26962021.ArticlePubMedPMC
- 32. Kersten S. Integrated physiology and systems biology of PPARα. Mol Metab 2014;3(4):354–371. 24944896.ArticlePubMedPMC
- 33. Rosen ED, Sarraf P, Troy AE, Bradwin G, Moore K, Milstone DS, et al. PPAR γ is required for the differentiation of adipose tissue in vivo and in vitro. Mol Cell 1999;4(4):611–617. 10549292.ArticlePubMed
- 34. Vanden Heuvel JP, Thompson JT, Frame SR, Gillies PJ. Differential activation of nuclear receptors by perfluorinated fatty acid analogs and natural fatty acids: a comparison of human, mouse, and rat peroxisome proliferator-activated receptor-α, -β, and -γ, liver X receptor-β, and retinoid X receptor-α. Toxicol Sci 2006;92(2):476–489. 16731579.ArticlePubMed
- 35. Kirkley AG, Sargis RM. Environmental endocrine disruption of energy metabolism and cardiovascular risk. Curr Diab Rep 2014;14(6):494. 24756343.ArticlePubMedPMCPDF
- 36. Sheng N, Cui R, Wang J, Guo Y, Wang J, Dai J. Cytotoxicity of novel fluorinated alternatives to long-chain perfluoroalkyl substances to human liver cell line and their binding capacity to human liver fatty acid binding protein. Arch Toxicol 2018;92(1):359–369. 28864880.ArticlePubMedPDF
- 37. Genuis SJ, Birkholz D, Ralitsch M, Thibault N. Human detoxification of perfluorinated compounds. Public Health 2010;124(7):367–375. 20621793.ArticlePubMed
- 38. Fletcher T, Galloway TS, Melzer D, Holcroft P, Cipelli R, Pilling LC, et al. Associations between PFOA, PFOS and changes in the expression of genes involved in cholesterol metabolism in humans. Environ Int 2013;57-58:2–10. 23624243.ArticlePubMed
- 39. Yang W, Ling X, He S, Cui H, Yang Z, An H, et al. PPARα/ACOX1 as a novel target for hepatic lipid metabolism disorders induced by per- and polyfluoroalkyl substances: an integrated approach. Environ Int 2023;178:108138. 37572494.ArticlePubMed
- 40. Schlezinger JJ, Puckett H, Oliver J, Nielsen G, Heiger-Bernays W, Webster TF. Perfluorooctanoic acid activates multiple nuclear receptor pathways and skews expression of genes regulating cholesterol homeostasis in liver of humanized PPARα mice fed an American diet. Toxicol Appl Pharmacol 2020;405:115204. 32822737.ArticlePubMedPMC
- 41. Wan C, Han R, Liu L, Zhang F, Li F, Xiang M, et al. Role of miR-155 in fluorooctane sulfonate-induced oxidative hepatic damage via the Nrf2-dependent pathway. Toxicol Appl Pharmacol 2016;295:85–93. 26844784.ArticlePubMed
- 42. Fang X, Zou S, Zhao Y, Cui R, Zhang W, Hu J, et al. Kupffer cells suppress perfluorononanoic acid-induced hepatic peroxisome proliferator-activated receptor α expression by releasing cytokines. Arch Toxicol 2012;86(10):1515–1525. 22648072.ArticlePubMedPDF
- 43. Gallo V, Leonardi G, Genser B, Lopez-Espinosa MJ, Frisbee SJ, Karlsson L, et al. Serum perfluorooctanoate (PFOA) and perfluorooctane sulfonate (PFOS) concentrations and liver function biomarkers in a population with elevated PFOA exposure. Environ Health Perspect 2012;120(5):655–660. 22289616.ArticlePubMedPMC
- 44. Jin R, McConnell R, Catherine C, Xu S, Walker DI, Stratakis N, et al. Perfluoroalkyl substances and severity of nonalcoholic fatty liver in Children: an untargeted metabolomics approach. Environ Int 2020;134:105220. 31744629.ArticlePubMed
- 45. Costello E, Rock S, Stratakis N, Eckel SP, Walker DI, Valvi D, et al. Exposure to per- and polyfluoroalkyl substances and markers of liver injury: a systematic review and meta-analysis. Environ Health Perspect 2022;130(4):46001. 35475652.ArticlePubMedPMC
- 46. Grove JI, Lo PC, Shrine N, Barwell J, Wain LV, Tobin MD, et al. Identification and characterisation of a rare MTTP variant underlying hereditary non-alcoholic fatty liver disease. JHEP Rep 2023;5(8):100764. 37484212.PubMedPMC
- 47. Potoupni V, Georgiadou M, Chatzigriva E, Polychronidou G, Markou E, Zapantis Gakis C, et al. Circulating tumor necrosis factor-α levels in non-alcoholic fatty liver disease: a systematic review and a meta-analysis. J Gastroenterol Hepatol 2021;36(11):3002–3014. 34289181.ArticlePubMedPDF
- 48. Hsieh CJ, Wang PW, Hu TH. Association of adiponectin gene polymorphism with nonalcoholic fatty liver disease in Taiwanese patients with type 2 diabetes. PLoS One 2015;10(6):e0127521. 26042596.ArticlePubMedPMC
- 49. Roth K, Imran Z, Liu W, Petriello MC. Diet as an exposure source and mediator of per- and polyfluoroalkyl substance (PFAS) toxicity. Front Toxicol 2020;2:601149. 35296120.ArticlePubMedPMC
REFERENCES
REFERENCES
Figure & Data
REFERENCES
Citations
Citations to this article as recorded by 
- Ubiquitous Environmental Exposures and Risk of Hepatocellular Carcinoma: A Narrative Review
Hiwot Mulugeta Abate, Daniel Bujnowski, Ashley Jowell, Cynthia A. Moylan, Cathrine Hoyo, Kara Wegermann
Digestive Diseases and Sciences.2026; 71(1): 60. CrossRef - Liver steatosis induced by per- and polyfluoroalkyl substances exerts a limited influence on heterocyclic aromatic amine–mediated DNA damage at population-relevant exposure levels
Minna A. Choi, Frédéric Ezan, Matthieu Masaoudi, Etienne B. Blanc, Sophie Langouët
Environmental Pollution.2026; 397: 127975. CrossRef - Relationship between perfluoroalkyl substance exposure and immunoglobulin E among Korean adults from Korean National Environmental Health Survey cycle 4 (2018–2020): a cross-sectional study
Dongwoo Kim, Kyung-Jae Lee, June-Hee Lee, InHo Lee
Frontiers in Public Health.2026;[Epub] CrossRef - Quantitative Spatial Analysis of PFAS in Nine Biological Tissues from Mouse via MALDI-TIMS-MSI
Varvara Nikolopoulou, Arthur Stem, Mohammad Alayyoub, Vasilis Vasiliou, Reza Aalizadeh
Environmental Science & Technology.2026; 60(23): 16419. CrossRef - Effects of mixed exposure to PFAS on adolescent non-alcoholic fatty liver disease: Integrating evidence from human cohorts, toxicogenomics, and animal models to uncover mechanisms and potential target sites
Xiushuai Du, Dan-Lin Li, Xueming Xu, Yitian Wu, Zhiyuan Du, Gang Liang, Yue-Zu Li, Ya-Jie Zheng, Yu Qin, Kelei Qian, Jing Xu, Liping Gao, Gonghua Tao, Chen-Wei Pan, Weiwei Zheng
Journal of Hazardous Materials.2025; 485: 136854. CrossRef - Per- and polyfluoroalkyl substances exposures are associated with non-alcoholic fatty liver disease, particularly fibrosis
Se-Hyun Hwang, Yun-Hee Choi, Da-An Huh, Lita Kim, Kangyeon Park, Jiyoun Lee, Hyeon Jeong Choi, Woohyun Lim, Kyong Whan Moon
Environmental Pollution.2025; 372: 126085. CrossRef - PFAS compounds PFOA and Gen X are teratogenic to sea urchin embryos
Alexandra T. Lion, Sophie M. Bodine, Kelley R. McCutcheon, Mayank Ghogale, Santhan Chandragiri, Deema Abayawardena, Bikram D. Shrestha, Abigail Descoteaux, Kathryn Alvarez, J'nesse A. Balkman, Breelyn Cocke, Athula H. Wikramanayake, Jennifer Schlezinger,
Developmental Biology.2025; 525: 139. CrossRef - Sex Differences in the Association Between the Korean Healthy Eating Index and Liver Enzymes Among Korean Adults
Seong-Uk Baek, Jin-Ha Yoon
Nutrients.2025; 17(14): 2372. CrossRef - Association between exposure to VOCs mixture and impaired renal function in Korean adults
Seong-Uk Baek, Jin-Ha Yoon
American Journal of Epidemiology.2025; 194(12): 3520. CrossRef - Diabetes and male fertility disorders
Andrea Graziani, Raffaele Scafa, Giuseppe Grande, Alberto Ferlin
Molecular Aspects of Medicine.2024; 99: 101303. CrossRef
 Cite
Cite- Figure
-
- Related articles
-
- Association between outdoor clothing use and serum perfluoroalkyl substances (PFAS): Korean National Environmental Health Survey cycle 4
- Association between sudden work recall and psychological health issues: a cross-sectional analysis of the 6th Korean Working Conditions Survey
- Relationship between the use of hair products and urine benzophenone-3: the Korean National Environmental Health Survey (KoNEHS) cycle 4
- Relationship between crustacean consumption and serum perfluoroalkyl substances (PFAS): the Korean National Environmental Health Survey (KoNEHS) cycle 4
Association between serum perfluoroalkyl substances concentrations and non-alcoholic fatty liver disease among Korean adults: a cross-sectional study using the National Environmental Health Survey cycle 4
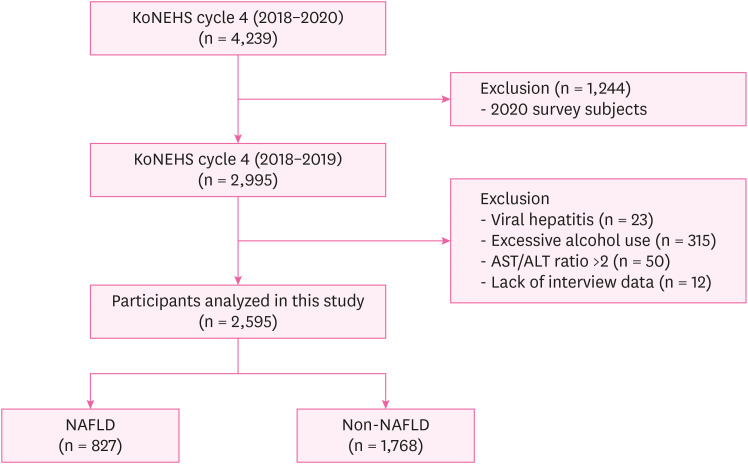
Fig. 1 Selection of analytic samples in this study.KoNEHS: the Korean National Environmental Health Survey; AST: aspartate aminotransferase; ALT: alanine aminotransferase; NAFLD: non-alcoholic fatty liver disease.
Fig. 1
Association between serum perfluoroalkyl substances concentrations and non-alcoholic fatty liver disease among Korean adults: a cross-sectional study using the National Environmental Health Survey cycle 4
| Variables | Total (n = 2,595) | Non-NAFLD (n = 1,768) | NAFLD (n = 827) | ||
|---|---|---|---|---|---|
| Age group (years) | 0.232 | ||||
| 19–39 | 547 (35.0) | 368 (34.7) | 179 (35.6) | ||
| 39–59 | 1,054 (37.3) | 723 (37.5) | 331 (37.0) | ||
| ≥ 60 | 994 (27.7) | 677 (27.8) | 317 (27.4) | ||
| Sex | < 0.001 | ||||
| Male | 1,017 (46.0) | 551 (36.6) | 466 (64.1) | ||
| Female | 1,578 (54.0) | 1,217 (63.4) | 361 (35.9) | ||
| BMI (kg/m2) | < 0.001 | ||||
| Normal | 1,383 (54.3) | 1,288 (75.3) | 95 (13.6) | ||
| Obeseb | 1,212 (45.7) | 480 (24.7) | 732 (86.4) | ||
| Drinking status | 0.210 | ||||
| No | 617 (22.0) | 431 (23.4) | 186 (19.4) | ||
| Formerc | 279 (10.1) | 185 (9.4) | 94 (11.5) | ||
| Current | 1,699 (65.5) | 1,152 (67.3) | 547 (69.1) | ||
| Smoking history | < 0.001 | ||||
| No | 1,791 (68.1) | 1,313 (74.5) | 478 (55.6) | ||
| Former | 482 (17.3) | 282 (15.4) | 200 (20.9) | ||
| Current | 322 (14.6) | 173 (10.1) | 149 (23.5) | ||
| Physical activity | 0.473 | ||||
| No | 1,362 (52.0) | 910 (52.3) | 452 (51.4) | ||
| Intermediated | 179 (6.5) | 114 (5.9) | 65 (7.6) | ||
| Vigorous | 1,054 (41.6) | 744 (41.9) | 310 (41.0) | ||
| Monthly household incomee | 0.517 | ||||
| < 2 | 762 (23.0) | 514 (23.0) | 248 (23.0) | ||
| 2–3 | 415 (15.5) | 268 (15.0) | 147 (16.4) | ||
| 3–5 | 695 (28.9) | 474 (28.1) | 221 (30.5) | ||
| ≥ 5 | 723 (32.6) | 512 (33.9) | 211 (30.1) | ||
| Education | 0.299 | ||||
| Less than high school | 731 (20.5) | 401 (21.0) | 230 (19.3) | ||
| High school graduate | 734 (25.5) | 493 (24.3) | 241 (27.9) | ||
| University or higher | 1,130 (54.0) | 774 (54.7) | 356 (52.7) | ||
| Liver enzyme | |||||
| AST (U/L) | 25.30 ± 0.29 | 23.53 ± 0.20 | 28.73 ± 0.67 | < 0.001 | |
| ALT (U/L) | 25.55 ± 0.55 | 19.10 ± 0.26 | 38.05 ± 1.24 | < 0.001 | |
| GGT (U/L) | 27.31 ± 0.83 | 20.38 ± 0.64 | 40.74 ± 1.88 | < 0.001 | |
| Comorbidities | |||||
| Hypertension | 663 (20.8) | 363 (16.8) | 300 (28.6) | < 0.001 | |
| Diabetes | 340 (11.7) | 128 (5.8) | 212 (23.2) | < 0.001 | |
| Dyslipidemia | 779 (28.1) | 430 (21.8) | 349 (40.3) | < 0.001 | |
| Serum PFAS concentration | |||||
| Total PFAS | 30.15 ± 1.03 | 28.76 ± 1.04 | 31.80 ± 1.05 | 0.005 | |
| PFOA | 6.43 ± 1.02 | 6.25 ± 1.03 | 6.44 ± 1.03 | 0.432 | |
| PFOS | 15.07 ± 1.04 | 14.35 ± 1.04 | 16.20 ± 1.06 | 0.003 | |
| PFHxS | 4.17 ± 1.03 | 3.93 ± 1.05 | 4.35 ± 1.05 | 0.078 | |
| PFNA | 2.06 ± 1.02 | 1.96 ± 1.03 | 2.15 ± 1.04 | 0.028 | |
| PFDeA | 0.91 ± 1.02 | 0.88 ± 1.03 | 0.91 ± 1.04 | 0.358 | |
| Variables | Total PFAS | PFOA | PFOS | PFHxS | PFNA | PFDeA | |
|---|---|---|---|---|---|---|---|
| Total (n = 2,595) | 29.29 (9.62–15.32) | 6.31 (2.09–3.06) | 14.74 (5.25–7.89) | 3.96 (1.52–2.61) | 2.04 (0.77–1.15) | 0.86 (0.27–0.44) | |
| Non-NAFLD (n = 1,768) | 28.31 (9.09–15.36) | 6.18 (1.93–2.97) | 14.36 (5.00–7.66) | 3.79 (1.52–2.75) | 1.95 (0.69–1.12) | 0.86 (0.25–0.43) | |
| NAFLD (n = 827) | 30.74 (9.88–16.52) | 6.55 (2.42–3.03) | 15.62 (5.87–9.1) | 4.28 (1.56–2.46) | 2.16 (0.85–1.22) | 0.86 (0.28–0.44) | |
| Sex | |||||||
| Male (n = 1,017) | 30.92 (9.91–14.14) | 6.61 (2.3–2.86) | 15.09 (5.06–8.33) | 4.41 (1.54–2.87) | 2.12 (0.73–1.13) | 0.88 (0.29–0.44) | |
| Female (n = 1,578) | 27.28 (8.86–16.89) | 6.01 (1.91–3.2) | 14.36 (5.4–7.97) | 3.49 (1.34–2.54) | 1.92 (0.7–1.19) | 0.84 (0.24–0.43) | |
| Age group (years) | |||||||
| 19–39 (n = 547) | 19.18 (4.53–6.21) | 4.27 (1.16–1.44) | 9.43 (2.48–3.76) | 2.69 (0.79–1.45) | 1.24 (0.33–0.43) | 0.59 (0.16–0.18) | |
| 40–59 (n = 1,054) | 30.93 (8.09–12.05) | 6.85 (2.12–2.81) | 15.2 (4.12–5.99) | 4.33 (1.48–2.3) | 2.25 (0.74–0.97) | 0.95 (0.26–0.38) | |
| ≥ 60 (n = 994) | 46.53 (11.05–17.15) | 9.21 (2.53–3.9) | 24.44 (6.72–9.18) | 5.79 (2.07–2.72) | 3.36 (1.02–1.26) | 1.31 (0.35–0.56) | |
| BMIa | |||||||
| Normal (n = 1,383) | 27.73 (8.93–14.97) | 5.93 (1.76–2.88) | 14.12 (5.17–7.56) | 3.59 (1.37–2.77) | 1.89 (0.66–1.05) | 0.84 (0.25–0.39) | |
| Obese (n = 1,212) | 31.44 (10.58–15.95) | 6.75 (2.5–3.32) | 15.89 (5.84–8.09) | 4.32 (1.6–2.5) | 2.23 (0.88–1.26) | 0.88 (0.29–0.52) | |
| Serum PFAS | Crudea | Model 1b | Model 2c |
|---|---|---|---|
| Total PFAS | 1.956 (1.234–3.100) | 2.027 (1.106–3.717) | 1.881 (0.993–3.563) |
| PFOA | 1.225 (0.724–2.070) | 1.221 (0.573–2.158) | 1.272 (0.736–2.199) |
| PFOS | 1.917 (1.283–2.863) | 2.094 (1.285–3.414) | 1.981 (1.170–3.356) |
| PFHxS | 1.458 (0.914–2.326) | 1.157 (0.702–1.906) | 1.153 (0.759–1.752) |
| PFNA | 1.658 (1.068–2.574) | 1.741 (0.947–3.200) | 1.755 (0.994–3.098) |
| PFDeA | 1.252 (0.775–2.021) | 1.188 (0.643–2.196) | 1.243 (0.681–2.266) |
| Serum PFAS | Crudea | Model 1b | Model 2c | |||
|---|---|---|---|---|---|---|
| Normald | Obesee | Normal | Obese | Normal | Obese | |
| Total PFAS | 6.401 (1.883–21.758) | 0.680 (0.391–1.183) | 7.642 (1.850–31.560) | 0.897 (0.405–1.988) | 5.207 (1.480–18.323) | 0.916 (0.408–2.054) |
| PFOA | 1.473 (0.431–5.038) | 0.628 (0.360–1.097) | 1.139 (0.235–5.514) | 0.816 (0.400–1.665) | 1.141 (0.256–5.099) | 0.966 (0.466–2.002) |
| PFOS | 7.018 (2.688–18.319) | 0.684 (0.422–1.108) | 9.210 (3.346–25.353) | 0.872 (0.461–1.650) | 7.030 (2.687–18.392) | 0.877 (0.459–1.676) |
| PFHxS | 1.711 (0.867–3.375) | 0.924 (0.539–1.583) | 1.044 (0.417–2.619) | 0.963 (0.550–1.684) | 0.895 (0.331–2.415) | 1.030 (0.594–1.786) |
| PFNA | 3.542 (0.946–13.270) | 0.722 (0.436–1.195) | 4.296 (0.719–25.679) | 1.020 (0.506–2.059) | 2.687 (0.556–12.988) | 1.212 (0.607–2.419) |
| PFDeA | 4.008 (1.022–15.720) | 0.515 (0.315–0.843) | 5.510 (0.994–30.545) | 0.610 (0.286–1.302) | 3.328 (0.907–12.211) | 0.711 (0.320–1.581) |
Table 1 General characteristics of the study population according to NAFLD
Values are presented as mean ± standard deviation or sample size (weighted %).
NAFLD: non-alcoholic fatty liver disease; n: unweighted sample size; BMI: body mass index; AST: aspartate aminotransferase; ALT: alanine aminotransferase; GGT: gamma-glutamyl transferase; PFAS: perfluoroalkyl substances; PFOA: perfluorooctanoic acid; PFOS: perfluorooctansulfonate; PFHxS: perfluorohexanesulfonic acid; PFNA: perfluorononanoic acid; PFDeA: perfluorodecanoic acid.
aThe
Table 2 Distribution of serum PFAS concentrations (μg/L) according to NAFLD status, sex, age group and BMI
Values are presented as median (interquartile range).
Quartile of serum PFAS levels were calculated using weighted samples.
PFAS: perfluoroalkyl substances; NAFLD: non-alcoholic fatty liver disease; BMI: body mass index; PFOA: perfluorooctanoic acid; PFOS: perfluorooctansulfonate; PFHxS: perfluorohexanesulfonic acid; PFNA: perfluorononanoic acid; PFDeA: perfluorodecanoic acid; n: unweighted sample size.
aNormal, BMI < 25; obese, BMI ≥ 25.
Table 3 The risk of NAFLD by PFAS concentration
Values are presented as odds ratio (95% confidence interval).
NAFLD: non-alcoholic fatty liver disease; PFAS: perfluoroalkyl substances; PFOA: perfluorooctanoic acid; PFOS: perfluorooctansulfonate; PFHxS: perfluorohexanesulfonic acid; PFNA: perfluorononanoic acid; PFDeA: perfluorodecanoic acid.
aSerum PFAS, NAFLD based on hepatic steatosis index score; bCrude + adiusted for age(group), sex; cModel 1 + adiusted for smoking history, physical activity, monthly household income, education, hypertension, diabetes, dyslipidemia.
Table 4 The risk of NAFLD by PFAS concentration to stratified on BMI
Values are presented as odds ratio (95% confidence interval).
NAFLD: non-alcoholic fatty liver disease; PFAS: perfluoroalkyl substances; BMI: body mass index; PFOA: perfluorooctanoic acid; PFOS: perfluorooctansulfonate; PFHxS: perfluorohexanesulfonic acid; PFNA: perfluorononanoic acid; PFDeA: perfluorodecanoic acid.
aSerum PFAS, NAFLD based on hepatic steatosis index score; bCrude + adiusted for age (group), sex; cModel 1 + adiusted for smoking history, physical activity, monthly household income, education, hypertension, diabetes, dyslipidemia; dNormal, BMI < 25; eObese, BMI ≥ 25.

