
Articles
- Page Path
- HOME > Ann Occup Environ Med > Volume 35; 2023 > Article
- Original Article Relationship between the use of plastics in refrigerator food storage and urine phthalate metabolites: the Korean National Environmental Health Survey (KoNEHS) cycle 3
-
Jisoo Kang
 , Seong-yong Cho, Seongyong Yoon
 -
Annals of Occupational and Environmental Medicine 2023;35:e53.
DOI: https://doi.org/10.35371/aoem.2023.35.e53
Published online: December 27, 2023
Department of Occupational and Environmental Medicine, Soonchunhyang University Gumi Hospital, Gumi, Korea.
- Correspondence: Seong-yong Cho. Department of Occupational and Environmental Medicine, Soonchunhyang University Gumi Hospital, 179 1gongdan-ro, Gumi 39371, Korea. 97blueciel@naver.com
• Received: October 18, 2023 • Revised: November 30, 2023 • Accepted: December 20, 2023
Copyright © 2023 Korean Society of Occupational & Environmental Medicine
This is an Open Access article distributed under the terms of the Creative Commons Attribution Non-Commercial License (https://creativecommons.org/licenses/by-nc/4.0/) which permits unrestricted non-commercial use, distribution, and reproduction in any medium, provided the original work is properly cited.
Abstract
-
Background Plastics are high-molecular-weight materials composed of long carbon chains. They are prevalent in daily life, present in various items such as food containers and microwavable packaging. Phthalates, an additive used to enhance their flexibility, are endocrine-disrupting chemicals. We utilized the data from the Korean National Environmental Health Survey (KoNEHS) cycle 3, representing the general South Korean population, to investigate the relationship between the use of plastics in refrigerator food storage and phthalate exposure.
-
Methods We assessed 3,333 adult participants (aged ≥ 19 years) including 1,526 men and 1,807 women, using data from KoNEHS cycle 3. Using the 75th percentile concentration, urine phthalate metabolites were categorized into high and low-concentration groups. χ2 test was conducted to analyze variations in the distribution of each variable, considering sociodemographic factors, health-related factors, food intake, the use of plastics, and the concentration of urine phthalate metabolites as the variables. To calculate odds ratios (ORs) for the high-concentration group of urine phthalate metabolites based on the use of plastics in refrigerator food storage, logistic regression analysis was conducted.
-
Results In men, the use of plastics in refrigerator food storage had significantly higher adjusted ORs compared to those using the others. The adjusted ORs were calculated as follows: mono-(2-ethyl-5-hydroxyhexyl) phthalate (MEHHP) had an OR of 1.35 (95% confidence interval [CI]: 1.05–1.72), mono-(2-ethyl-5-oxohexyl) phthalate (MEOHP) had an OR of 1.48 (95% CI: 1.16–1.88), mono-(2-ethyl-5-carboxypentyl) phthalate (MECPP) had an OR of 1.32 (95% CI: 1.04–1.66), ∑di(2-ethylhexyl) phthalate (∑DEHP) had an OR of 1.37 (95% CI: 1.08–1.74) and mono-n-butyl phthalate (MnBP) had an OR of 1.44 (95% CI: 1.13–1.84).
-
Conclusion The concentrations of urine phthalate metabolites (MEHHP, MEOHP, MECPP, ∑DEHP, and MnBP) were significantly higher in men who used plastics in refrigerator food storage compared to those using the others.
BACKGROUND
Plastics are high-molecular-weight materials composed of long carbon chains.1 They include various types, such as polyvinyl chloride (PVC), polypropylene, polystyrene, polyethylene, polyethylene terephthalate (PET), polycarbonate, phenolic resin, polyester resin and melamine resin. Plastics are prevalent in daily life, including plastic food containers, plastic bottles, cosmetic containers, home appliances, and microwavable packaging.2 The use of plastics has been steadily increasing due to their light weight, durability, and cost-effectiveness.3
Most plastics contain various additives to enhance color, flexibility, and softness. Among these additives, plasticizers are utilized to increase the flexibility of plastics.4 Plasticizers are produced worldwide each year approximately 7.5 million tons. Among these plasticizers, phthalates are most commonly used.5 Phthalates are categorized as high-molecular-weight phthalates and low-molecular-weight phthalates. High-molecular-weight phthalates, including di(2-ethylhexyl) phthalate (DEHP), di-iso-decyl phthalate (DiDP), di-n-octyl phthalate (DNOP), di-iso-nonyl phthalate (DiNP) and butyl benzyl phthalate (BBzP) are predominantly utilized as a PVC plasticizer and found in food containers, food packaging, adhesives, and other vinyl products. Low-molecular-weight phthalates, including di-isobutyl phthalate (DIBP), di-n-butyl phthalate (DBP), dimethyl phthalate (DMP), and diethyl phthalate (DEP) are commonly utilized as cosmetic and pharmaceutical products.6,7
Phthalates are widely recognized as endocrine-disrupting compounds (EDCs).6 So, safety concerns have arisen due to the phthalate migration from plastics into food, depending on factors like food storage duration, temperature, and pH.8 Especially at home, plastics are widely used when storing food in the refrigerator. Additionally, considering that the primary purpose of a refrigerator is storage, the food is relatively exposed to plastics for a long time in the refrigerator which makes phthalates migrate easily to the food. While numerous studies investigated the use of plastics in refrigerator food storage and phthalate exposure, large-scale studies on this topic have not been conducted in South Korea. Therefore, we aimed to investigate the relationship between urine phthalate metabolites and the use of plastics in refrigerator food storage, utilizing the data from the Korean National Environmental Health Survey (KoNEHS) cycle 3.
METHODS
We utilized data from adults (aged ≥ 19 years) who were involved in KoNEHS cycle 3. Following Section 14 of the Environmental Health Act, it is a nationwide legal survey performed every 3 years since 2009. The aim of KoNEHS is to collect nationwide fundamental data regarding the general population’s exposure to environmental risks in South Korea. It analyzes the present status of environmental health, the distribution of environmentally harmful substances in the human body, relevant changes, and influencing factors. The data provided by KoNEHS is instrumental in developing environmental health policies. For this study, 15 sample households were selected using systematic sampling within the 233 sample plots. Survey targets were household members older than 19 years. In KoNEHS cycle 3, 16 clinical test items and 26 types of environmentally harmful substances in the human body were examined via blood samples and urine samples. Among the data of 3,787 adults which includes 1,648 men and 2,139 women, participants with missing data on urine creatinine concentration and urine phthalate metabolites concentration were not included. Among them, Individuals who had urine creatinine concentrations outside the normal range (0.3–3.0 g/L) were not included. So, the final analysis dataset consists of 3,333 adults comprising 1,526 men and 1,807 women (Fig. 1).9
Fig. 1

Flow chart of the selection of study participants.
KoNEHS: Korean National Environmental Health Survey.
For the quantitative assessment of urine phthalate metabolite concentrations, ultra-performance liquid chromatography-mass spectrometry was utilized. To prevent light exposure, we first collected urine samples in specialized aseptic containers and subsequently deposited them in shielded storage containers. The samples went through a 20-minute cooling period in iced water to lower their temperature before they were transported to the lab in an icebox. Once in the lab, the urine samples were kept at −20°C before they were examined. In KoNEHS cycles 3, analyzed urine phthalate metabolites included DEHP metabolites: mono-(2-ethyl-5-hydroxyhexyl) phthalate (MEHHP), mono-(2-ethyl-5-oxohexyl) phthalate (MEOHP) and mono-(2-ethyl-5-carboxypentyl) phthalate (MECPP), DBP metabolite: mono-n-butyl phthalate (MnBP), BzBP metabolite: mono-benzyl phthalate (MBzP), DOP metabolite: mono (3-carboxypropyl) phthalate (MCPP), DNP metabolite: mono-carboxyoctyl phthalate (MCOP), DDP metabolite: monocarboxy-isononyl phthalate (MCNP).10 The DEHP concentration (∑DEHP) was determined by summing the values of MEHHP, MEOHP, and MECPP together.6 In this analysis, we utilized urine creatinine concentration for correction of urine dilution when calculating the final urine phthalate metabolites concentrations. Using the 75th percentile concentration, urine phthalate metabolites were categorized into high and low-concentration groups.11,12
The response items to the question regarding the type of food storage container in the refrigerator at home included glass containers, metal containers, plastic containers, zipper bags, plastic bags, porcelain (ceramic) containers, and others. Participants reporting the use of plastic containers, zipper bags, and plastic bags were considered as using plastics in refrigerator food storage.
The participants’ sociodemographic factors, health-related factors, food intake, and the use of plastics were included as potential cofounders. Food intake included consumption of grilled meat, milk and dairy products, hamburgers, and pizza with high-fat contents, reflecting the lipophilic property of phthalates. And, due to the high concentrations of phthalate detected in seafood as a result of aquatic environmental contamination, the consumption of seafood was included.13,14 Also, we included the consumption of plastic bag drinks, wrap packing delivery food, PET drinks, microwave food, cup noodles, type of drinking water, and type of food storage in the freezer.
χ2 test was conducted to analyze variations in the distribution of each variable, considering sociodemographic factors, health-related factors, food intake, the use of plastics, and the concentration of urine phthalate metabolites as the variables. To calculate odds ratios (ORs) for the high-concentration group of urine phthalate metabolites based on the use of plastics in refrigerator food storage, logistic regression analysis was conducted. The logistic regression was performed by applying weights presented in the original dataset in accordance with the KoNEHS analysis guideline.9 This study employed IBM SPSS version 27 for Windows (IBM Corp., Armonk, NY, USA) to conduct statistical analyses.
This study received approval from the Institutional Review Board of Soonchunhyang University Gumi Hospital (IRB No. 2023-08-01 Medicine).
RESULTS
In this study, 1,526 (46%) were men and 1,807 (54%) were women. Compared with men, MEHHP, MECPP, ∑DEHP, MBzP, MCPP, and MCOP were higher in women. The percentages of overweight, current smokers, use of plastics in refrigerator food storage, consumption of commercial bottled water, and the frequency of consuming PET drinks, cup noodles, and grilled meat over once a week were higher in men compared to women (Table 1).
Table 1
Baseline characteristics of the participants
Data were presented as median (interquartile range), mean ± standard deviation, or number (%).
MEHHP: mono-(2-ethyl-5-hydroxyhexyl) phthalate; MEOHP: mono-(2-ethyl-5-oxohexyl) phthalate; MECPP: mono-(2-ethyl-5-carboxypentyl) phthalate; ∑DEHP: ∑di(2-ethylhexyl) phthalate; MnBP: mono-n-butyl phthalate; MBzP: mono-benzyl phthalate; MCPP: mono (3-carboxypropyl) phthalate; MCOP: mono-carboxyoctyl phthalate; MCNP: mono-carboxy-isononly phthalate; BMI: body mass index.
ap-value calculated by t-test.
bp-value calculated by χ2 test.
Tables 2, 3, 4 presents the distribution variation of urine phthalate metabolites in high and low groups based on sociodemographic factors, health-related factors, food intake, and the use of plastics among men. The mean age of men in the high-concentration group for MEHHP, MEOHP, MECPP, ∑DEHP, MnBP, MBzP, and MCPP was higher than that of men in the low-concentration group. The proportions of participants who were non- or ex-smokers were higher in the high concentration group compared to current smokers for ∑DEHP and MnBP in men. The proportions of using plastics in refrigerator food storage were higher in the high concentration group of urine phthalate metabolites compared to using the others in refrigerator food storage for MEHHP, MEOHP, MECPP, ∑DEHP, MnBP, and MBzP in men.
Table 2
Baseline characteristics of the men according to urine phthalate metabolites (MEHHP, MEOHP, MECPP)
Data were presented as mean ± standard deviation or number (%).
MEHHP: mono-(2-ethyl-5-hydroxyhexyl) phthalate; MEOHP: mono-(2-ethyl-5-oxohexyl) phthalate;MECPP: mono-(2-ethyl-5-carboxypentyl) phthalate; BMI: body mass index; PET: polyethylene terephthalate.
ap-value calculated by t-test.
bp-value calculated by χ2 test.
Table 3
Baseline characteristics of the men according to urine phthalate metabolites (∑DEHP, MnBP, MBzP)
Table 4
Baseline characteristics of the men according to urine phthalate metabolites (MCPP, MCOP, MCNP)
To calculate ORs for the high-concentration group of urine phthalate metabolites based on the use of plastics in refrigerator food storage, logistic regression analysis was conducted. In men, the use of plastics in refrigerator food storage had significantly higher adjusted ORs compared to those using the others. The adjusted ORs were calculated as follows: MEHHP had an OR of 1.35 (95% confidence interval [CI]: 1.05–1.72), MEOHP had an OR of 1.48 (95% CI: 1.16–1.88), MECPP had an OR of 1.32 (95% CI: 1.04–1.66), ∑DEHP had an OR of 1.37 (95% CI: 1.08–1.74), and MnBP had an OR of 1.44 (95% CI: 1.13–1.84). In women, the adjusted ORs did not show significant results, but the unadjusted OR for MnBP was high at 1.30 (95% CI: 1.03–1.64) (Table 5).
Table 5
Adjusted ORs and 95% CIs of the use of plastics in refrigerator food storage with high concentration of urine phthalate metabolites
OR: odds ratio; CI: confidence interval; MEHHP: mono-(2-ethyl-5-hydroxyhexyl) phthalate; MEOHP: mono-(2-ethyl-5-oxohexyl) phthalate; MECPP: mono-(2-ethyl-5-carboxypentyl) phthalate; ∑DEHP: ∑di(2-ethylhexyl) phthalate; MnBP: mono-n-butyl phthalate; MBzP: mono-benzyl phthalate; MCPP: mono (3-carboxypropyl) phthalate; MCOP: mono-carboxyoctyl phthalate; MCNP: mono-carboxy-isononly phthalate.
aMultivariable adjusted model: adjusted for age, body mass index, marital status, smoking, food storage(freezer), type of drinking water, and consumption of plastic bag drink, wrap packing delivery food, PET drinks, microwave food, cup noodles, grilled meat, milk, dairy products, hamburgers, pizza, seafood.
DISCUSSION
This study showed that the group using plastics in refrigerator food storage in men had higher adjusted ORs for the high concentration group of MEHHP, MEOHP, MECPP, ∑DEHP (the sum of MEHHP, MEOHP, MECPP), and MnBP compared to the group without the use of plastics in refrigerator food storage. The urine metabolites of DEHP, namely MEHHP, MEOHP, and MECPP, are known to undergo hydrolysis and oxidation in the body, resulting in relatively long periods of retention. As a result, they are used as biomarkers of DEHP exposure.15 These metabolites have various harmful effects on human health. MEOHP, for instance, has been linked to negative impacts on intelligence quotient and attention in children,16 and pregnant women exposed to it may face an elevated risk of gestational diabetes.17 Moreover, a positive correlation has been found between MECPP and the breast cancer risk for women,18 and exposure of the fetus to MEOHP or ∑DEHP has been linked to an elevated risk of intrauterine growth retardation.19 Additionally, both MEHHP and MECPP have been shown to increase the secretion of β-hexosaminidase by mast cells, leading to skin rashes.20 The urine metabolites of DBP, MnBP has a dose-relationship with small for gestational age and low birth weight for male infants.21 Moreover, MnBP has been connected with an elevated risk of clinical pregnancy loss.22
A study conducted on 2,140 adults in Shanghai, China showed that the use of plastic food containers increased the concentrations of urine metabolites of DEHP, including MEHP, MEHHP, MEOHP, and MECPP, which aligns with the findings of this study.23 In another study involving 39 elementary students in South Korea, the concentration of MEOHP increased by 0.001 μg/g with the intake of a dairy product and by 0.002 μg/g with the intake of meat. In contrast, the concentration of MEOHP increased by 0.225 μg/g through the use of plastic material in food storage and food packaging, indicating a stronger correlation between phthalate exposure and the use of plastic material in food storage and food packaging rather than the intake of dairy products and meat.24 In a study conducted on Slovakian 32 firefighters, MnBP has been associated with the consumption of food heated in plastic material.25 Additionally, in a study conducted on 528 women in Taiwan, the use of plastic food packaging has been positively linked to MnBP.26 Consequently, the use of plastics in refrigerator food storage is presumed to be the main cause of increased urine phthalate metabolites. Furthermore, MEHHP, MEOHP, MECPP, ∑DEHP (the sum of MEHHP, MEOHP, MECPP), and MnBP may be useful indicators of phthalate exposure associated with the use of plastics in refrigerator food storage.
In this study, no relation was observed between the use of plastics in refrigerated food storage and urine phthalate metabolite concentrations in women compared to men. This result can be explained by differences in dietary habits between men and women. In a study investigating the dietary differences between men and women, it was reported that men tend to consume foods with higher fat content compared to women.27 Therefore, even when using the same plastic containers, men are estimated to have consumed a larger quantity of food with higher fat content compared to women.12 Also, in this study, the concentration of urine phthalate metabolites was higher in women than men. We utilized urine creatinine concentration for correction of urine dilution when calculating the final urine phthalate metabolite concentrations. So, because urine creatinine concentration in women is lower than in men, the creatinine-corrected concentrations are estimated to have been consequently higher in women.28 Additionally, the higher concentration of phthalates in women may be attributed to the use of personal care products such as cosmetics, fragrances, and lotions.29
Human exposure to phthalates occurs through numerous pathways such as oral intake, skin absorption, or inhalation but oral intake is the main route of exposure.7 Remarkably, it has been reported that 90% of DEHP exposure occurs through food intake.30 Phthalates do not form covalent bonds with plastic polymer, enabling them to have high mobility within the plastic material.7 Consequently, plastics used in food storage allow phthalates to migrate easily into foods. First, within the polymer, migration occurs via the diffusion process. Second, migration in food may differ depending on the physical properties of the food.31,32
The quantity of the migration of phthalates from plastics to food depends on several factors. This includes fat content, food storage duration, pH, and temperature. Phthalates exhibit a lipophilic nature,33 making them prone to easily bind to foods with high-fat content. When water and cooking oil were placed in plastic food containers to measure phthalate migration levels, it was observed that the levels were 0.020 μg/L for cooking oil and 0.001 μg/L for water.34 These findings suggest that phthalate exposure can increase with eating foods with high-fat content stored in plastic containers. Prolonged food storage duration can also increase phthalate migration from plastics to foods. In a study conducted in Ghana, the DEHP migration level from a plastic food container was 1.00 ± 0.02 mg/kg after 30 minutes, 1.17 ± 0.02 mg/kg after 1 hour, 1.20 ± 0.01 mg/kg after 2 hours and 1.39 ± 0.10 mg/kg after 4 hours.35 Additionally, phthalates are known to migrate more as acidity and temperature increase.36,37 A study investigating phthalate migration using pickles in plastic containers found a negative correlation between pH and the DEHP, DMP, BBP, DEP, DnBP, and DnOP in pickles.38 Another study on phthalate migration after placing 60°C and 80°C water in plastic food containers and heating them for 2 hours revealed higher levels of DEHP, BBP, DBP, DEP, and DMP in the 80°C water compared to 60°C water.39 This is due to the facilitation of ester hydrolysis in acidic conditions and an increase in the rate of hydrolysis with higher temperatures.40 In this study, these factors could not be analyzed because of the absence of detailed information on the types of foods and storage duration, food acidity, and temperature in the KoNEHS questionnaire. Therefore, a follow-up monitoring study on phthalate exposure levels with consideration of food storage duration in plastics, food types, acidity, and temperature is necessary.
This study had several limitations. First, we could not prove causal relationships as it was a cross-sectional study. Secondly, analyzed data consisted of concentrations measured from a single urine sample, which may have resulted in concentration variations. Future research should think about using a 24-hour urine collection method and examining blood concentration too. Third, the KoNEHS data did not provide information on occupational conditions, such as types of exposed chemicals and personal protective gear, occupational factors could not be analyzed in this study. Fourth, due to the absence of detailed information on food type, temperature, acidity, and storage duration in the KoNEHS questionnaire, these factors could not be analyzed in this study.
To the best of our knowledge, there have been limited large-scale studies conducted in Korea that examine the relationship between the use of plastics in food storage and phthalate exposure. Therefore, despite its limitations, this study is significant because it presents the relationship between the use of plastics in refrigerator food storage and the concentrations of MEHHP, MEOHP, MECPP, ∑DEHP, and MnBP by using the data that reflects the general South Korean population.
Phthalates have various adverse effects on human health. Based on the results of this study, it is important to continuously monitor phthalate exposure resulting from the use of plastics in refrigerator food storage. Considering that phthalate migration levels vary according to the type of stored food, temperature, acidity, and storage duration, further studies should be conducted to examine foods stored in plastics in refrigerator food storage.
CONCLUSIONS
This study revealed the association between the use of plastics in refrigerator food storage and the concentrations of urine phthalate metabolites. The concentrations of urine phthalate metabolites (MEHHP, MEOHP, MECPP, ∑DEHP, and MnBP) were significantly higher in men who used plastics in refrigerator food storage compared to those using the others.
ACKNOWLEDGEMENTS
This study used the Korean National Environmental Health Survey Cycle 3 (2015~2017), made by National Institute of Environmental Research (NIER-2017-01-01-001). We appreciate National Institute of Environmental Research making available the raw data of Korean National Environmental Health Survey.
Abbreviations
BBzP
butyl benzyl phthalate
BMI
body mass index
CI
confidence interval
DBP
di-n-butyl phthalate
DEHP
di(2-ethylhexyl) phthalate
DEP
diethyl phthalate
DIBP
di-isobutyl phthalate
DiDP
di-iso-decyl phthalate
DiNP
di-iso-nonyl phthalate
DMP
dimethyl phthalate
DNOP
di-n-octyl phthalate
EDC
endocrine-disrupting compound
KoNEHS
Korean National Environmental Health Survey
MBzP
mono-benzyl phthalate
MCNP
mono-carboxy-isononly phthalate
MCOP
mono-carboxyoctyl phthalate
MCPP
mono (3-carboxypropyl) phthalate
MECPP
mono-(2-ethyl-5-carboxypentyl) phthalate
MEHHP
mono-(2-ethyl-5-hydroxyhexyl) phthalate
MEOHP
mono-(2-ethyl-5-oxohexyl) phthalate
MnBP
mono-n-butyl phthalate
OR
odds ratio
PET
polyethylene terephthalate
PVC
polyvinyl chloride
-
Funding: This research was supported by the Soonchunhyang University Research Fund and Inha University Hospital’s Environmental Health Center for Training Environmental Medicine Professional funded by the Ministry of Environment, Republic of Korea (2023).
-
Competing interests: The authors declare that they have no competing interests.
-
Author Contributions:
NOTES
- 1. Cantor KM, Watts P. Plastics materials. Applied Plastics Engineering Handbook. Amsterdam: William Andrew Publishing; 2011, 3–5.
- 2. Geyer R, Jambeck JR, Law KL. Production, use, and fate of all plastics ever made. Sci Adv 2017;3(7):e1700782. 28776036.ArticlePubMedPMC
- 3. Plastics Europe. Plastics - the facts 2019. An analysis of European plastics production, demand and waste data. Updated 2019]. Accessed December 10, 2023]. https://www.plasticseurope.org/en/resources/publications/1804-plastics-facts-2019 .
- 4. Graham PR. Phthalate ester plasticizers--why and how they are used. Environ Health Perspect 1973;3:3–12. 4712540.ArticlePubMedPMC
- 5. Yan Y, Zhu F, Zhu C, Chen Z, Liu S, Wang C, et al. Dibutyl phthalate release from polyvinyl chloride microplastics: influence of plastic properties and environmental factors. Water Res 2021;204:117597. 34482095.ArticlePubMed
- 6. Choi J, Kim J, Choi G, Kim K. Relationship between dietary habits and urinary phthalate mtabolite concentrations in elementary school children. J Environ Health Sci 2018;44(5):433–443.
- 7. Giovanoulis G, Bui T, Xu F, Papadopoulou E, Padilla-Sanchez JA, Covaci A, et al. Multi-pathway human exposure assessment of phthalate esters and DINCH. Environ Int 2018;112:115–126. 29272775.ArticlePubMed
- 8. Bang DY, Kyung M, Kim MJ, Jung BY, Cho MC, Choi SM, et al. Human risk assessment of endocrine-disrupting chemicals derived from plastic food containers. Compr Rev Food Sci Food Saf 2012;11(5):453–470.Article
- 9. Korean National Institute of Environmental Research. Guidelines for Using Raw Materials for Korean National Environmental Health Survey (Adult) - The Third Stage (‘15~‘17). Incheon: Korean National Institute of Environmental Research; 2019, 1–31.
- 10. Korean National Institute of Environmental Research. Environmental Hazardous Materials Analysis Manual (Organic compounds) in Korean National Environmental Health Survey (Adult) - The Third Stage (‘15~‘17). Incheon: Korean National Institute of Environmental Research; 2019, 36–56.
- 11. Kim Y, Park M, Nam DJ, Yang EH, Ryoo JH. Relationship between seafood consumption and bisphenol A exposure: the Second Korean National Environmental Health Survey (KoNEHS 2012-2014). Ann Occup Environ Med 2020;32(1):e10. 32411375.ArticlePubMedPMCPDF
- 12. Kang J, Cho SY, Kim J, Yoon S, An JM, Kim G, et al. Relationship between shellfish consumption and urinary phthalate metabolites: Korean National Environmental Health Survey (KoNEHS) cycle 3 (2015-2017). Ann Occup Environ Med 2023;35:e2. 36925631.ArticlePubMedPMCPDF
- 13. He M, Yang C, Geng R, Zhao X, Hong L, Piao X, et al. Monitoring of phthalates in foodstuffs using gas purge microsyringe extraction coupled with GC-MS. Anal Chim Acta 2015;879(879):63–68. 26002478.ArticlePubMed
- 14. Hu X, Gu Y, Huang W, Yin D. Phthalate monoesters as markers of phthalate contamination in wild marine organisms. Environ Pollut 2016;218:410–418. 27435611.ArticlePubMed
- 15. Koch HM, Preuss R, Angerer J. Di(2-ethylhexyl)phthalate (DEHP): human metabolism and internal exposure-- an update and latest results. Int J Androl 2006;29(1):155–165. 16466535.PubMed
- 16. Kim JI, Hong YC, Shin CH, Lee YA, Lim YH, Kim BN. The effects of maternal and children phthalate exposure on the neurocognitive function of 6-year-old children. Environ Res 2017;156:519–525. 28431379.ArticlePubMed
- 17. Chen W, He C, Liu X, An S, Wang X, Tao L, et al. Effects of exposure to phthalate during early pregnancy on gestational diabetes mellitus: a nested case-control study with propensity score matching. Environ Sci Pollut Res Int 2023;30(12):33555–33566. 36480145.ArticlePubMedPDF
- 18. Fu Z, Zhao F, Chen K, Xu J, Li P, Xia D, et al. Association between urinary phthalate metabolites and risk of breast cancer and uterine leiomyoma. Reprod Toxicol 2017;74:134–142. 28951174.ArticlePubMed
- 19. Zhao Y, Chen L, Li LX, Xie CM, Li D, Shi HJ, et al. Gender-specific relationship between prenatal exposure to phthalates and intrauterine growth restriction. Pediatr Res 2014;76(4):401–408. 25003910.ArticlePubMedPDF
- 20. Kim SH, Moon JY, Park HS, Shin YS. The role of di (2-ethylhexyl) phthalate as an exacerbating factor in chronic spontaneous urticaria. Allergy Asthma Immunol Res 2022;14(3):339–343. 35557498.ArticlePubMedPMCPDF
- 21. Chang CH, Tsai YA, Huang YF, Tsai MS, Hou JW, Lin CL, et al. The sex-specific association of prenatal phthalate exposure with low birth weight and small for gestational age: a nationwide survey by the Taiwan Maternal and Infant Cohort Study (TMICS). Sci Total Environ 2022;806(Pt 3):151261. 34715222.ArticlePubMed
- 22. Mu D, Gao F, Fan Z, Shen H, Peng H, Hu J. Levels of phthalate metabolites in urine of pregnant women and risk of clinical pregnancy loss. Environ Sci Technol 2015;49(17):10651–10657. 26251123.ArticlePubMed
- 23. Dong RH, Zhang H, Zhang MR, Chen JS, Wu M, Li SG, et al. Association between phthalate exposure and the use of plastic containers in Shanghai adults. Biomed Environ Sci 2017;30(10):727–736. 29122093.PubMed
- 24. Kim S, Kang S, Lee G, Lee S, Jo A, Kwak K, et al. Urinary phthalate metabolites among elementary school children of Korea: sources, risks, and their association with oxidative stress marker. Sci Total Environ 2014;472:49–55. 24291132.ArticlePubMed
- 25. Kolena B, Petrovičová I, Šidlovská M, Hlisníková H, Bystričanová L, Wimmerová S, et al. Occupational hazards and risks associated with phthalates among Slovakian firefighters. Int J Environ Res Public Health 2020;17(7):2483. 32260494.ArticlePubMedPMC
- 26. Chen HK, Chang YH, Sun CW, Wu MT, Chen ML, Wang SL, et al. Associations of urinary phthalate metabolites with household environments among mothers and their preschool-age children. Ecotoxicol Environ Saf 2023;262:115162. 37352583.ArticlePubMed
- 27. Varì R, Scazzocchio B,, Del Papa S. Dietary habits and gender differences. J Sex Gend Specif Med 2017;3(2):55–58.
- 28. National Institute of Food and Drug Safety Evaluation (KR). Exposure and Human Risk Assessment of Phthalates. Updated 2007]. Accessed December 10, 2023]. https://scienceon.kisti.re.kr/mobile/srch/selectPORSrchReport.do?cn=TRKO201000014839 .
- 29. Ghosh R, Haque M, Turner PC, Cruz-Cano R, Dallal CM. Racial and sex differences between urinary phthalates and metabolic syndrome among U.S. adults: NHANES 2005-2014. Int J Environ Res Public Health 2021;18(13):6870. 34206929.ArticlePubMedPMC
- 30. Erythropel HC, Maric M, Nicell JA, Leask RL, Yargeau V. Leaching of the plasticizer di(2-ethylhexyl)phthalate (DEHP) from plastic containers and the question of human exposure. Appl Microbiol Biotechnol 2014;98(24):9967–9981. 25376446.ArticlePubMedPDF
- 31. Coltro L, Pitta JB, da Costa PA, Perez MÂ, de Araújo VA, Rodrigues R. Migration of conventional and new plasticizers from PVC films into food simulants: a comparative study. Food Control 2014;44:118–129.Article
- 32. Chung D, Papadakis SE, Yam KL. Simple models for assessing migration from food-packaging films. Food Addit Contam 2002;19(6):611–617. 12042028.ArticlePubMed
- 33. Cavaliere B, Macchione B, Sindona G, Tagarelli A. Tandem mass spectrometry in food safety assessment: the determination of phthalates in olive oil. J Chromatogr A 2008;1205(1-2):137–143. 18755465.ArticlePubMed
- 34. Xu Q, Yin X, Wang M, Wang H, Zhang N, Shen Y, et al. Analysis of phthalate migration from plastic containers to packaged cooking oil and mineral water. J Agric Food Chem 2010;58(21):11311–11317. 20949921.ArticlePubMed
- 35. Ayamba AA, Agyekum AA, Derick C, Dontoh D. Assessment of phthalate migration in polyethylene food contact materials sold on the Ghanaian market. Cogent Environ Sci 2020;6(1):1794242.Article
- 36. Fang H, Wang J, Lynch RA. Migration of di (2-ethylhexyl) phthalate (DEHP) and di-n-butylphthalate (DBP) from polypropylene food containers. Food Control 2017;73(B):1298–1302.Article
- 37. Farhoodi M, Emam-Djomeh Z, Ehsani MR, Oromiehie A. Effect of environmental conditions on the migration of di (2-ethylhexyl) phthalate from PET bottles into yogurt drinks: influence of time, temperature and food simulant. Arab J Sci Eng 2008;33(2):279–287.
- 38. Cheshmazar E, Arfaeinia L, Vasseghian Y, Ramavandi B, Moradi M, Hashemi SE, et al. Phthalate acid esters in pickled vegetables packaged in polyethylene terephthalate container: occurrence, migration, and estrogenic activity-associated risk assessment. J Food Compos Anal 2021;99:103880.Article
- 39. Wang M, Liu Y, Liang G, Ding H, Zhou X, Qin S, et al. Migration analysis and health impact assessment of phthalates in takeaway food packaging materials. J Food Saf 2023;43(1):e13021.ArticlePDF
- 40. Liu JM, Li CY, Zhao N, Wang ZH, Lv SW, Liu JC, et al. Migration regularity of phthalates in polyethylene wrap film of food packaging. J Food Sci 2020;85(7):2105–2113. 32506566.ArticlePubMedPDF
REFERENCES
REFERENCES
Figure & Data
REFERENCES
Citations
Citations to this article as recorded by 
- Age-Specific Association Between Urinary Phthalate Metabolites and Diabetes Mellitus: Findings from the Korean National Environmental Health Survey Cycle 4 (2018–2020)
Jung-Eun Lee, Gyu Tae Lee, Han-A Cho
Healthcare.2026; 14(5): 655. CrossRef - Biomonitoring of Endocrine Disrupting Chemicals in Exclusively Breastfed Infants and Correlation with the Mother Surveys
Adnan Barutcu, Pinar Efeoglu Ozseker, Hacer Yapicioglu Yildizdas, Saliha Barutcu, Alihan Sursal, Ali Evrim Dogan, Nurdan Evliyaoglu
Exposure and Health.2025; 17(6): 1443. CrossRef - Microplastic Migration from Plastic Packaging into Honey
Klytaimnistra Katsara, Zacharias Viskadourakis, Eleftherios Alissandrakis, George Kenanakis, Vassilis M. Papadakis
Microplastics.2025; 4(4): 90. CrossRef - Microplastic particles in human blood and their association with coagulation markers
Dong-Wook Lee, Jaehak Jung, Seul-ah Park, Yunjeong Lee, Juyang Kim, Changwoo Han, Hwan-Cheol Kim, Joon Hee Lee, Yun-Chul Hong
Scientific Reports.2024;[Epub] CrossRef
 Cite
Cite- Figure
-
- Related articles
-
- Association between delivery-food consumption frequency and urinary bisphenol concentrations among Korean adults: a nationally representative study (Korean National Environmental Health Survey cycle 5, 2021–2023)
- Association between outdoor clothing use and serum perfluoroalkyl substances (PFAS): Korean National Environmental Health Survey cycle 4
- Relationship between the use of hair products and urine benzophenone-3: the Korean National Environmental Health Survey (KoNEHS) cycle 4
- Relationship between crustacean consumption and serum perfluoroalkyl substances (PFAS): the Korean National Environmental Health Survey (KoNEHS) cycle 4
- Association between serum perfluoroalkyl substances concentrations and non-alcoholic fatty liver disease among Korean adults: a cross-sectional study using the National Environmental Health Survey cycle 4
Relationship between the use of plastics in refrigerator food storage and urine phthalate metabolites: the Korean National Environmental Health Survey (KoNEHS) cycle 3
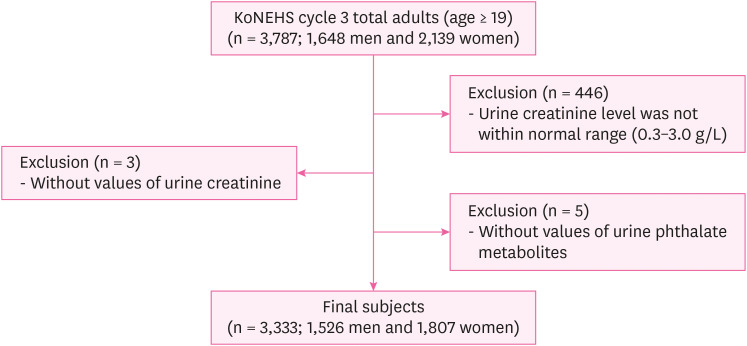
Fig. 1 Flow chart of the selection of study participants.KoNEHS: Korean National Environmental Health Survey.
Fig. 1
Relationship between the use of plastics in refrigerator food storage and urine phthalate metabolites: the Korean National Environmental Health Survey (KoNEHS) cycle 3
| Category | Total (n = 3,333) | Men (n = 1,526) | Women (n = 1,807) | ||
|---|---|---|---|---|---|
| Urine phthalate metabolites | |||||
| MEHHP (μg/g Cr) | 18.2 (10.7–30.3) | 15.6 (9.1–25.1) | 20.8 (12.3–34.5) | 0.004 | |
| MEOHP (μg/g Cr) | 13.5 (7.8–23.6) | 11.3 (6.7–19.5) | 16.1 (9.3–27.1) | 0.143 | |
| MECPP (μg/g Cr) | 27.6 (16.4–51.8) | 22.8 (13.7–42.9) | 32.1 (19.2–61.4) | < 0.001 | |
| ∑DEHP (μg/g Cr) | 61.0 (37.7–106.8) | 51.2 (31.6–88.1) | 71.6 (43.8–122.8) | 0.002 | |
| MnBP (μg/g Cr) | 31.8 (16.8–56.7) | 27.4 (14.7–49.1) | 35.1 (19.3–62.3) | 0.132 | |
| MBzP (μg/g Cr) | 2.7 (1.4–5.4) | 2.4 (1.2–4.8) | 3.0 (1.5–6.0) | 0.003 | |
| MCPP (μg/g Cr) | 1.1 (0.6–1.9) | 1.0 (0.6–1.7) | 1.3 (0.7–2.2) | 0.001 | |
| MCOP (μg/g Cr) | 0.5 (0.2–0.8) | 0.4 (0.2–0.7) | 0.5 (0.2–1.0) | < 0.001 | |
| MCNP (μg/g Cr) | 1.1 (0.7–1.9) | 1.0 (0.6–1.6) | 1.3 (0.9–2.2) | 0.298 | |
| Age (years) | 52.9 ± 14.8 | 52.8 ± 15.1 | 53.0 ± 14.6 | 0.687a | |
| BMI (kg/m2) | < 0.001b | ||||
| Normal | 1,919 (57.6) | 809 (53.0) | 1,110 (61.4) | ||
| Overweight | 1,414 (42.4) | 717 (47.0) | 697 (38.6) | ||
| Marital status | < 0.001 | ||||
| Single | 371 (11.1) | 223 (14.6) | 148 (8.1) | ||
| Married | 2,583 (77.5) | 1,225 (80.3) | 1,358 (75.2) | ||
| The others | 379 (11.4) | 78 (5.1) | 301 (16.7) | ||
| Smoking | < 0.001 | ||||
| None or ex–smokers | 2,777 (83.3) | 1,021 (66.9) | 1,756 (97.2) | ||
| Current smokers | 556 (16.7) | 505 (33.1) | 51 (2.8) | ||
| Food storage (refrigerator) | 0.017 | ||||
| Plastics | 1,736 (52.1) | 829 (54.3) | 907 (50.2) | ||
| The others | 1,597 (47.9) | 697 (45.7) | 900 (49.8) | ||
| Food storage (freezer) | 0.400 | ||||
| Plastics | 3,299 (99.0) | 1,508 (98.8) | 1,791 (99.1) | ||
| The others | 34 (1.0) | 18 (1.2) | 16 (0.9) | ||
| Plastic bag drink | 0.140 | ||||
| ≤ Once a week | 2,450 (73.5) | 1,103 (72.3) | 1,347 (74.5) | ||
| > Once a week | 883 (26.5) | 423 (27.7) | 460 (25.5) | ||
| Wrap packing delivery food | 0.253 | ||||
| ≤ Once a week | 3,209 (96.3) | 1,463 (95.9) | 1,746 (96.6) | ||
| > Once a week | 124 (3.7) | 63 (4.1) | 61 (3.4) | ||
| PET drinks | < 0.001 | ||||
| ≤ Once a week | 1,546 (46.4) | 505 (33.1) | 1,041 (57.6) | ||
| > Once a week | 1,787 (53.6) | 1,021 (66.9) | 766 (42.4) | ||
| Microwave food | 0.887 | ||||
| ≤ Once a week | 3,253 (97.6) | 1,490 (97.6) | 1,763 (97.6) | ||
| > Once a week | 80 (2.4) | 36 (2.4) | 44 (2.4) | ||
| Cup noodles | < 0.001 | ||||
| ≤ Once a week | 3,190 (95.7) | 1,428 (93.6) | 1,762 (97.5) | ||
| > Once a week | 143 (4.3) | 98 (6.4) | 45 (2.5) | ||
| Type of drinking water (at home) | 0.004 | ||||
| Commercial bottled water | 486 (14.6) | 252 (16.5) | 234 (12.9) | ||
| The others | 2,847 (85.4) | 1,274 (83.5) | 1,573 (87.1) | ||
| Type of drinking water (at outdoor) | < 0.001 | ||||
| Commercial bottled water | 760 (22.8) | 402 (26.3) | 358 (19.8) | ||
| The others | 2,573 (77.2) | 1,124 (73.7) | 1,449 (80.2) | ||
| Grilled meat | < 0.001 | ||||
| ≤ Once a week | 2,887 (86.6) | 1,281 (83.9) | 1,606 (88.9) | ||
| > Once a week | 446 (13.4) | 245 (16.1) | 201 (11.1) | ||
| Milk, dairy products | < 0.001 | ||||
| ≤ Once a week | 1,524 (45.7) | 791 (51.8) | 733 (40.6) | ||
| > Once a week | 1,809 (54.3) | 735 (48.2) | 1,074 (59.4) | ||
| Hamburgers, pizza | 0.139 | ||||
| ≤ Once a week | 3,289 (98.7) | 1,501 (98.4) | 1,788 (98.9) | ||
| > Once a week | 44 (1.3) | 25 (1.6) | 19 (1.1) | ||
| Large fish and tuna | 0.017 | ||||
| ≤ Once a week | 3,232 (97.0) | 1,468 (96.2) | 1,764 (97.6) | ||
| > Once a week | 101 (3.0) | 58 (3.8) | 43 (2.4) | ||
| Fish | 0.369 | ||||
| ≤ Once a week | 2,341 (70.2) | 1,060 (69.5) | 1,281 (70.9) | ||
| > Once a week | 992 (29.8) | 466 (30.5) | 526 (29.1) | ||
| Shellfish | 0.591 | ||||
| ≤ Once a week | 3,135 (94.1) | 1,439 (94.3) | 1,696 (93.9) | ||
| > Once a week | 198 (5.9) | 87 (5.7) | 111 (6.1) | ||
| Crustacean | 0.613 | ||||
| ≤ Once a week | 3,218 (96.5) | 1,476 (96.7) | 1,742 (96.4) | ||
| > Once a week | 115 (3.5) | 50 (3.3) | 65 (3.6) | ||
| Seaweed | 0.093 | ||||
| ≤ Once a week | 1,370 (41.1) | 651 (42.7) | 719 (39.8) | ||
| > Once a week | 1,963 (58.9) | 875 (57.3) | 1,088 (60.2) | ||
| Other seafood items | 0.647 | ||||
| ≤ Once a week | 3,171 (95.1) | 1,449 (95.0) | 1,722 (95.3) | ||
| > Once a week | 162 (4.9) | 77 (5.0) | 85 (4.7) | ||
| Category | MEHHP | MEOHP | MECPP | |||||||
|---|---|---|---|---|---|---|---|---|---|---|
| Low (n = 1,145) | High (n = 381) | Low (n = 1,145) | High (n = 381) | Low (n = 1,145) | High (n = 381) | |||||
| Age (years) | 51.1 ± 15.2 | 57.8 ± 13.7 | < 0.001 | 51.2 ± 15.2 | 57.4 ± 13.9 | < 0.001 | 51.6 ± 15.1 | 56.2 ± 14.5 | < 0.001a | |
| BMI | 0.192 | 0.097 | 0.058b | |||||||
| Normal | 596 (73.7) | 213 (26.3) | 593 (73.3) | 216 (26.7) | 591 (73.1) | 218 (26.9) | ||||
| Overweight | 549 (76.6) | 168 (23.4) | 552 (77.0) | 165 (23.0) | 554 (77.3) | 163 (22.7) | ||||
| Marital status | 0.012 | 0.105 | 0.375 | |||||||
| Single | 185 (83.0) | 38 (17.0) | 180 (80.7) | 43 (19.3) | 173 (77.6) | 50 (22.4) | ||||
| Married | 904 (73.8) | 321 (26.2) | 907 (74.0) | 318 (26.0) | 910 (74.3) | 315 (25.7) | ||||
| The others | 56 (71.8) | 22 (28.2) | 58 (74.4) | 20 (25.6) | 62 (79.5) | 16 (20.5) | ||||
| Smoking | 0.608 | 0.698 | 0.129 | |||||||
| None or ex-smokers | 762 (74.6) | 259 (25.4) | 763 (74.7) | 258 (25.3) | 754 (73.8) | 267 (26.2) | ||||
| Current smokers | 383 (75.8) | 122 (24.2) | 382 (75.6) | 123 (24.4) | 391 (77.4) | 114 (22.6) | ||||
| Food storage (refrigerator) | 0.001 | < 0.001 | 0.002 | |||||||
| Plastics | 593 (71.5) | 236 (28.5) | 588 (70.9) | 241 (29.1) | 596 (71.9) | 233 (28.1) | ||||
| The others | 552 (79.2) | 145 (20.8) | 557 (79.9) | 140 (20.1) | 549 (78.8) | 148 (21.2) | ||||
| Food storage (freezer) | 0.787 | 0.413 | 0.413 | |||||||
| Plastics | 1,131 (75.0) | 377 (25.0) | 1,130 (74.9) | 378 (25.1) | 1,130 (74.9) | 378 (25.1) | ||||
| The others | 14 (77.8) | 4 (22.2) | 15 (83.3) | 3 (16.7) | 15 (83.3) | 3 (16.7) | ||||
| Plastic bag drink | 0.161 | 0.315 | 0.854 | |||||||
| ≤ Once a week | 817 (74.1) | 286 (25.9) | 820 (74.3) | 283 (25.7) | 829 (75.2) | 274 (24.8) | ||||
| > Once a week | 328 (77.5) | 95 (22.5) | 325 (76.8) | 98 (23.2) | 316 (74.7) | 107 (25.3) | ||||
| Wrap packing delivery food | 0.828 | 0.607 | 0.417 | |||||||
| ≤ Once a week | 1,097 (75.0) | 366 (25.0) | 1,096 (74.9) | 367 (25.1) | 1,095 (74.8) | 368 (25.2) | ||||
| > Once a week | 48 (76.2) | 15 (23.8) | 49 (77.8) | 14 (22.2) | 50 (79.4) | 13 (20.6) | ||||
| PET drinks | 0.992 | 0.714 | 0.385 | |||||||
| ≤ Once a week | 379 (75.0) | 126 (25.0) | 376 (74.5) | 129 (25.5) | 372 (73.7) | 133 (26.3) | ||||
| > Once a week | 766 (75.0) | 255 (25.0) | 769 (75.3) | 252 (24.7) | 773 (75.7) | 248 (24.3) | ||||
| Microwave food | 0.020 | 0.052 | 0.438 | |||||||
| ≤ Once a week | 1,112 (74.6) | 378 (25.4) | 1,113 (74.7) | 377 (25.3) | 1,116 (74.9) | 374 (25.1) | ||||
| > Once a week | 33 (91.7) | 3 (8.3) | 32 (88.9) | 4 (11.1) | 29 (80.6) | 7 (19.4) | ||||
| Cup noodles | 0.006 | 0.012 | 0.119 | |||||||
| ≤ Once a week | 1,060 (74.2) | 368 (25.8) | 1,061 (74.3) | 367 (25.7) | 1,065 (74.6) | 363 (25.4) | ||||
| > Once a week | 85 (86.7) | 13 (13.3) | 84 (85.7) | 14 (14.3) | 80 (81.6) | 18 (18.4) | ||||
| Type of drinking water (at home) | 0.027 | 0.155 | 0.271 | |||||||
| Commercial bottled water | 203 (80.6) | 49 (19.4) | 198 (78.6) | 54 (21.4) | 196 (77.8) | 56 (22.2) | ||||
| The others | 942 (73.9) | 332 (26.1) | 947 (74.3) | 327 (25.7) | 949 (74.5) | 325 (25.5) | ||||
| Type of drinking water (at outdoor) | 0.558 | 0.393 | 0.750 | |||||||
| Commercial bottled water | 306 (76.1) | 96 (23.9) | 308 (76.6) | 94 (23.4) | 304 (75.6) | 98 (24.4) | ||||
| The others | 839 (74.6) | 285 (25.4) | 837 (74.5) | 287 (25.5) | 841 (74.8) | 283 (25.2) | ||||
| Grilled meat | 0.101 | 0.101 | 0.727 | |||||||
| ≤ Once a week | 951 (74.2) | 330 (25.8) | 951 (74.2) | 330 (25.8) | 959 (74.9) | 322 (25.1) | ||||
| > Once a week | 194 (79.2) | 51 (20.8) | 194 (79.2) | 51 (20.8) | 186 (75.9) | 59 (24.1) | ||||
| Milk, dairy products | 0.021 | 0.314 | 0.139 | |||||||
| ≤ Once a week | 574 (72.6) | 217 (27.4) | 585 (74.0) | 206 (26.0) | 581 (73.5) | 210 (26.5) | ||||
| > Once a week | 571 (77.7) | 164 (22.3) | 560 (76.2) | 175 (23.8) | 564 (76.7) | 171 (23.3) | ||||
| Hamburgers, pizza | 0.563 | 0.131 | 0.563 | |||||||
| ≤ Once a week | 1,125 (75.0) | 376 (25.0) | 1,123 (74.8) | 378 (25.2) | 1,125 (75.0) | 376 (25.0) | ||||
| > Once a week | 20 (80.0) | 5 (20.0) | 22 (88.0) | 3 (12.0) | 20 (80.0) | 5 (20.0) | ||||
| Large fish and tuna | 0.443 | 0.647 | 0.647 | |||||||
| ≤ Once a week | 1,099 (74.9) | 369 (25.1) | 1,100 (74.9) | 368 (25.1) | 1,100 (74.9) | 368 (25.1) | ||||
| > Once a week | 46 (79.3) | 12 (20.7) | 45 (77.6) | 13 (22.4) | 45 (77.6) | 13 (22.4) | ||||
| Fish | 0.171 | 0.267 | 0.135 | |||||||
| ≤ Once a week | 806 (76.0) | 254 (24.0) | 804 (75.8) | 256 (24.2) | 807 (76.1) | 253 (23.9) | ||||
| > Once a week | 339 (72.7) | 127 (27.3) | 341 (73.2) | 125 (26.8) | 338 (72.5) | 128 (27.5) | ||||
| Shellfish | 0.854 | 0.561 | 0.561 | |||||||
| ≤ Once a week | 1,079 (75.0) | 360 (25.0) | 1,082 (75.2) | 357 (24.8) | 1,082 (75.2) | 357 (24.8) | ||||
| > Once a week | 66 (75.9) | 21 (24.1) | 63 (72.4) | 24 (27.6) | 63 (72.4) | 24 (27.6) | ||||
| Crustacean | 0.622 | 0.403 | 0.864 | |||||||
| ≤ Once a week | 1,106 (74.9) | 370 (25.1) | 1,110 (75.2) | 366 (24.8) | 1,108 (75.1) | 368 (24.9) | ||||
| > Once a week | 39 (78.0) | 11 (22.0) | 35 (70.0) | 15 (30.0) | 37 (74.0) | 13 (26.0) | ||||
| Seaweed | 0.440 | 0.956 | 0.861 | |||||||
| ≤ Once a week | 482 (74.0) | 169 (26.0) | 488 (75.0) | 163 (25.0) | 487 (74.8) | 164 (25.2) | ||||
| > Once a week | 663 (75.8) | 212 (24.2) | 657 (75.1) | 218 (24.9) | 658 (75.2) | 217 (24.8) | ||||
| Other seafood items | 0.548 | 0.006 | 0.548 | |||||||
| ≤ Once a week | 1,085 (74.9) | 364 (25.1) | 1,077 (74.3) | 372 (25.7) | 1,085 (74.9) | 364 (25.1) | ||||
| > Once a week | 60 (77.9) | 17 (22.1) | 68 (88.3) | 9 (11.7) | 60 (77.9) | 17 (22.1) | ||||
| Category | ∑DEHP | MnBP | MBzP | |||||||
|---|---|---|---|---|---|---|---|---|---|---|
| Low (n = 1,144) | High (n = 382) | Low (n = 1,145) | High (n = 381) | Low (n = 1,145) | High (n = 381) | |||||
| Age (years) | 51.3 ± 15.1 | 57.1 ± 14.4 | < 0.001 | 51.3 ± 14.9 | 57.3 ± 14.8 | < 0.001 | 51.5 ± 15.1 | 56.5 ± 14.5 | < 0.001a | |
| BMI | 0.214 | 0.044 | 0.904b | |||||||
| Normal | 596 (73.7) | 213 (26.3) | 590 (72.9) | 219 (27.1) | 606 (74.9) | 203 (25.1) | ||||
| Overweight | 548 (76.4) | 169 (23.6) | 555 (77.4) | 162 (22.6) | 539 (75.2) | 178 (24.8) | ||||
| Marital status | 0.323 | 0.117 | 0.745 | |||||||
| Single | 176 (78.9) | 47 (21.1) | 178 (79.8) | 45 (20.2) | 171 (76.7) | 52 (23.3) | ||||
| Married | 909 (74.2) | 316 (25.8) | 913 (74.5) | 312 (25.5) | 914 (74.6) | 311 (25.4) | ||||
| The others | 59 (75.6) | 19 (24.4) | 54 (69.2) | 24 (30.8) | 60 (76.9) | 18 (23.1) | ||||
| Smoking | 0.029 | 0.043 | 0.444 | |||||||
| None or ex-smokers | 748 (73.3) | 273 (26.7) | 750 (73.5) | 271 (26.5) | 760 (74.4) | 261 (25.6) | ||||
| Current smokers | 396 (78.4) | 109 (21.6) | 395 (78.2) | 110 (21.8) | 385 (76.2) | 120 (23.8) | ||||
| Food storage (refrigerator) | < 0.001 | 0.009 | 0.032 | |||||||
| Plastics | 592 (71.4) | 237 (28.6) | 600 (72.4) | 229 (27.6) | 604 (72.9) | 225 (27.1) | ||||
| The others | 552 (79.2) | 145 (20.8) | 545 (78.2) | 152 (21.8) | 541 (77.6) | 156 (22.4) | ||||
| Food storage (freezer) | 0.410 | 0.413 | 0.056 | |||||||
| Plastics | 1,129 (74.9) | 379 (25.1) | 1,130 (74.9) | 378 (25.1) | 1,128 (74.8) | 380 (25.2) | ||||
| The others | 15 (83.3) | 3 (16.7) | 15 (83.3) | 3 (16.7) | 17 (94.4) | 1 (5.6) | ||||
| Plastic bag drink | 0.192 | 0.315 | 0.125 | |||||||
| ≤ Once a week | 817 (74.1) | 286 (25.9) | 820 (74.3) | 283 (25.7) | 816 (74.0) | 287 (26.0) | ||||
| > Once a week | 327 (77.3) | 96 (22.7) | 325 (76.8) | 98 (23.2) | 329 (77.8) | 94 (22.2) | ||||
| Wrap packing delivery food | 0.946 | 0.417 | 0.268 | |||||||
| ≤ Once a week | 1,097 (75.0) | 366 (25.0) | 1,095 (74.8) | 368 (25.2) | 1,094 (74.8) | 369 (25.2) | ||||
| > Once a week | 47 (74.6) | 16 (25.4) | 50 (79.4) | 13 (20.6) | 51 (81.0) | 12 (19.0) | ||||
| PET drinks | 0.483 | 0.045 | 0.537 | |||||||
| ≤ Once a week | 373 (73.9) | 132 (26.1) | 363 (71.9) | 142 (28.1) | 374 (74.1) | 131 (25.9) | ||||
| > Once a week | 771 (75.5) | 250 (24.5) | 782 (76.6) | 239 (23.4) | 771 (75.5) | 250 (24.5) | ||||
| Microwave food | 0.051 | 0.244 | 0.996 | |||||||
| ≤ Once a week | 1,112 (74.6) | 378 (25.4) | 1,115 (74.8) | 375 (25.2) | 1,118 (75.0) | 372 (25.0) | ||||
| > Once a week | 32 (88.9) | 4 (11.1) | 30 (83.3) | 6 (16.7) | 27 (75.0) | 9 (25.0) | ||||
| Cup noodles | 0.069 | 0.403 | 0.119 | |||||||
| ≤ Once a week | 1,063 (74.4) | 365 (25.6) | 1,068 (74.8) | 360 (25.2) | 1,065 (74.6) | 363 (25.4) | ||||
| > Once a week | 81 (82.7) | 17 (17.3) | 77 (78.6) | 21 (21.4) | 80 (81.6) | 18 (18.4) | ||||
| Type of drinking water (at home) | 0.109 | 0.207 | 0.433 | |||||||
| Commercial bottled water | 199 (79.0) | 53 (21.0) | 197 (78.2) | 55 (21.8) | 194 (77.0) | 58 (23.0) | ||||
| The others | 945 (74.2) | 329 (25.8) | 948 (74.4) | 326 (25.6) | 951 (74.6) | 323 (25.4) | ||||
| Type of drinking water (at outdoor) | 0.534 | 0.932 | 0.961 | |||||||
| Commercial bottled water | 306 (76.1) | 96 (23.9) | 301 (74.9) | 101 (25.1) | 302 (75.1) | 100 (24.9) | ||||
| The others | 838 (74.6) | 286 (25.4) | 844 (75.1) | 280 (24.9) | 843 (75.0) | 281 (25.0) | ||||
| Grilled meat | 0.068 | 0.188 | 0.034 | |||||||
| ≤ Once a week | 949 (74.1) | 332 (25.9) | 953 (74.4) | 328 (25.6) | 948 (74.0) | 333 (26.0) | ||||
| > Once a week | 195 (79.6) | 50 (20.4) | 192 (78.4) | 53 (21.6) | 197 (80.4) | 48 (19.6) | ||||
| Milk, dairy products | 0.033 | 0.374 | 0.139 | |||||||
| ≤ Once a week | 575 (72.7) | 216 (27.3) | 586 (74.1) | 205 (25.9) | 581 (73.5) | 210 (26.5) | ||||
| > Once a week | 569 (77.4) | 166 (22.6) | 559 (76.1) | 176 (23.9) | 564 (76.7) | 171 (23.3) | ||||
| Hamburgers, pizza | 0.293 | 0.910 | 0.048 | |||||||
| ≤ Once a week | 1,123 (74.8) | 378 (25.2) | 1,126 (75.0) | 375 (25.0) | 1,122 (74.8) | 379 (25.2) | ||||
| > Once a week | 21 (84.0) | 4 (16.0) | 19 (76.0) | 6 (24.0) | 23 (92.0) | 2 (8.0) | ||||
| Large fish and tuna | 0.882 | 0.282 | 0.021 | |||||||
| ≤ Once a week | 1,101 (75.0) | 367 (25.0) | 1,098 (74.8) | 370 (25.2) | 1,094 (74.5) | 374 (25.5) | ||||
| > Once a week | 43 (74.1) | 15 (25.9) | 47 (81.0) | 11 (19.0) | 51 (87.9) | 7 (12.1) | ||||
| Fish | 0.493 | 0.135 | 0.832 | |||||||
| ≤ Once a week | 800 (75.5) | 260 (24.5) | 807 (76.1) | 253 (23.9) | 797 (75.2) | 263 (24.8) | ||||
| > Once a week | 344 (73.8) | 122 (26.2) | 338 (72.5) | 128 (27.5) | 348 (74.7) | 118 (25.3) | ||||
| Shellfish | 0.756 | 0.035 | 0.943 | |||||||
| ≤ Once a week | 1,080 (75.1) | 359 (24.9) | 1,088 (75.6) | 351 (24.4) | 1,080 (75.1) | 359 (24.9) | ||||
| > Once a week | 64 (73.6) | 23 (26.4) | 57 (65.5) | 30 (34.5) | 65 (74.7) | 22 (25.3) | ||||
| Crustacean | 0.615 | 0.133 | 0.403 | |||||||
| ≤ Once a week | 1,105 (74.9) | 371 (25.1) | 1,112 (75.3) | 364 (24.7) | 1,110 (75.2) | 366 (24.8) | ||||
| > Once a week | 39 (78.0) | 11 (22.0) | 33 (66.0) | 17 (34.0) | 35 (70.0) | 15 (30.0) | ||||
| Seaweed | 0.717 | 0.010 | 0.014 | |||||||
| ≤ Once a week | 485 (74.5) | 166 (25.5) | 467 (71.7) | 184 (28.3) | 468 (71.9) | 183 (28.1) | ||||
| > Once a week | 659 (75.3) | 216 (24.7) | 678 (77.5) | 197 (22.5) | 677 (77.4) | 198 (22.6) | ||||
| Other seafood items | 0.377 | 0.453 | 0.158 | |||||||
| ≤ Once a week | 1,083 (74.7) | 366 (25.3) | 1,090 (75.2) | 359 (24.8) | 1,082 (74.7) | 367 (25.3) | ||||
| > Once a week | 61 (79.2) | 16 (20.8) | 55 (71.4) | 22 (28.6) | 63 (81.8) | 14 (18.2) | ||||
| Category | MCPP | MCOP | MCNP | |||||||
|---|---|---|---|---|---|---|---|---|---|---|
| Low (n = 1,145) | High (n = 381) | Low (n = 1,144) | High (n = 382) | Low (n = 1,144) | High (n = 382) | |||||
| Age (years) | 52.3 ± 15.1 | 54.2 ± 15.1 | 0.038 | 52.9 ± 14.9 | 52.2 ± 15.7 | 0.387 | 52.4 ± 15.1 | 53.9 ± 15.1 | 0.075a | |
| BMI | < 0.001 | 0.214 | 0.021b | |||||||
| Normal | 575 (71.1) | 234 (28.9) | 596 (73.7) | 213 (26.3) | 587 (72.6) | 222 (27.4) | ||||
| Overweight | 570 (79.5) | 147 (20.5) | 548 (76.4) | 169 (23.6) | 557 (77.7) | 160 (22.3) | ||||
| Marital status | 0.655 | 0.129 | 0.216 | |||||||
| Single | 162 (72.6) | 61 (27.4) | 156 (70.0) | 67 (30.0) | 166 (74.4) | 57 (25.6) | ||||
| Married | 925 (75.5) | 300 (24.5) | 926 (75.6) | 299 (24.4) | 913 (74.5) | 312 (25.5) | ||||
| The others | 58 (74.4) | 20 (25.6) | 62 (79.5) | 16 (20.5) | 65 (83.3) | 13 (16.7) | ||||
| Smoking | 0.373 | 0.420 | 0.859 | |||||||
| None or ex-smokers | 759 (74.3) | 262 (25.7) | 759 (74.3) | 262 (25.7) | 764 (74.8) | 257 (25.2) | ||||
| Current smokers | 386 (76.4) | 119 (23.6) | 385 (76.2) | 120 (23.8) | 380 (75.2) | 125 (24.8) | ||||
| Food storage (refrigerator) | 0.633 | 0.214 | 0.951 | |||||||
| Plastics | 618 (74.5) | 211 (25.5) | 611 (73.7) | 218 (26.3) | 622 (75.0) | 207 (25.0) | ||||
| The others | 527 (75.6) | 170 (24.4) | 533 (76.5) | 164 (23.5) | 522 (74.9) | 175 (25.1) | ||||
| Food storage (freezer) | 0.172 | 0.410 | 0.170 | |||||||
| Plastics | 1,129 (74.9) | 379 (25.1) | 1,129 (74.9) | 379 (25.1) | 1,128 (74.8) | 380 (25.2) | ||||
| The others | 16 (88.9) | 2 (11.1) | 15 (83.3) | 3 (16.7) | 16 (88.9) | 2 (11.1) | ||||
| Plastic bag drink | 0.458 | 0.803 | 0.437 | |||||||
| ≤ Once a week | 822 (74.5) | 281 (25.5) | 825 (74.8) | 278 (25.2) | 821 (74.4) | 282 (25.6) | ||||
| > Once a week | 323 (76.4) | 100 (23.6) | 319 (75.4) | 104 (24.6) | 323 (76.4) | 100 (23.6) | ||||
| Wrap packing delivery food | 0.160 | 0.599 | 0.087 | |||||||
| ≤ Once a week | 1,093 (74.7) | 370 (25.3) | 1,095 (74.8) | 368 (25.2) | 1,091 (74.6) | 372 (25.4) | ||||
| > Once a week | 52 (82.5) | 11 (17.5) | 49 (77.8) | 14 (22.2) | 53 (84.1) | 10 (15.9) | ||||
| PET drinks | 0.213 | 0.842 | 0.229 | |||||||
| ≤ Once a week | 369 (73.1) | 136 (26.9) | 377 (74.7) | 128 (25.3) | 369 (73.1) | 136 (26.9) | ||||
| > Once a week | 776 (76.0) | 245 (24.0) | 767 (75.1) | 254 (24.9) | 775 (75.9) | 246 (24.1) | ||||
| Microwave food | 0.244 | 0.433 | 0.241 | |||||||
| ≤ Once a week | 1,115 (74.8) | 375 (25.2) | 1,115 (74.8) | 375 (25.2) | 1,114 (74.8) | 376 (25.2) | ||||
| > Once a week | 30 (83.3) | 6 (16.7) | 29 (80.6) | 7 (19.4) | 30 (83.3) | 6 (16.7) | ||||
| Cup noodles | 0.041 | 0.898 | 0.395 | |||||||
| ≤ Once a week | 1,063 (74.4) | 365 (25.6) | 1,070 (74.9) | 358 (25.1) | 1,067 (74.7) | 361 (25.3) | ||||
| > Once a week | 82 (83.7) | 16 (16.3) | 74 (75.5) | 24 (24.5) | 77 (78.6) | 21 (21.4) | ||||
| Type of drinking water (at home) | 0.863 | 0.990 | 0.333 | |||||||
| Commercial bottled water | 188 (74.6) | 64 (25.4) | 189 (75.0) | 63 (25.0) | 195 (77.4) | 57 (22.6) | ||||
| The others | 957 (75.1) | 317 (24.9) | 955 (75.0) | 319 (25.0) | 949 (74.5) | 325 (25.5) | ||||
| Type of drinking water (at outdoor) | 0.961 | 0.724 | 0.751 | |||||||
| Commercial bottled water | 302 (75.1) | 100 (24.9) | 304 (75.6) | 98 (24.4) | 299 (74.4) | 103 (25.6) | ||||
| The others | 843 (75.0) | 281 (25.0) | 840 (74.7) | 284 (25.3) | 845 (75.2) | 279 (24.8) | ||||
| Grilled meat | 0.188 | 0.788 | 0.096 | |||||||
| ≤ Once a week | 953 (74.4) | 328 (25.6) | 962 (75.1) | 319 (24.9) | 950 (74.2) | 331 (25.8) | ||||
| > Once a week | 192 (78.4) | 53 (21.6) | 182 (74.3) | 63 (25.7) | 194 (79.2) | 51 (20.8) | ||||
| Milk, dairy products | 0.768 | 0.722 | 0.288 | |||||||
| ≤ Once a week | 596 (75.3) | 195 (24.7) | 596 (75.3) | 195 (24.7) | 584 (73.8) | 207 (26.2) | ||||
| > Once a week | 549 (74.7) | 186 (25.3) | 548 (74.6) | 187 (25.4) | 560 (76.2) | 175 (23.8) | ||||
| Hamburgers, pizza | 0.131 | 0.730 | 0.293 | |||||||
| ≤ Once a week | 1,123 (74.8) | 378 (25.2) | 1,126 (75.0) | 375 (25.0) | 1,123 (74.8) | 378 (25.2) | ||||
| > Once a week | 22 (88.0) | 3 (12.0) | 18 (72.0) | 7 (28.0) | 21 (84.0) | 4 (16.0) | ||||
| Large fish and tuna | 0.162 | 0.282 | 0.882 | |||||||
| ≤ Once a week | 1,106 (75.3) | 362 (24.7) | 1,104 (75.2) | 364 (24.8) | 1,101 (75.0) | 367 (25.0) | ||||
| > Once a week | 39 (67.2) | 19 (32.8) | 40 (69.0) | 18 (31.0) | 43 (74.1) | 15 (25.9) | ||||
| Fish | 0.171 | 0.066 | 0.763 | |||||||
| ≤ Once a week | 806 (76.0) | 254 (24.0) | 809 (76.3) | 251 (23.7) | 797 (75.2) | 263 (24.8) | ||||
| > Once a week | 339 (72.7) | 127 (27.3) | 335 (71.9) | 131 (28.1) | 347 (74.5) | 119 (25.5) | ||||
| Shellfish | 0.018 | 0.066 | 0.412 | |||||||
| ≤ Once a week | 1,089 (75.7) | 350 (24.3) | 1,086 (75.5) | 353 (24.5) | 1,082 (75.2) | 357 (24.8) | ||||
| > Once a week | 56 (64.4) | 31 (35.6) | 58 (66.7) | 29 (33.3) | 62 (71.3) | 25 (28.7) | ||||
| Crustacean | 0.622 | 0.404 | 0.615 | |||||||
| ≤ Once a week | 1,106 (74.9) | 370 (25.1) | 1,104 (74.8) | 372 (25.2) | 1,105 (74.9) | 371 (25.1) | ||||
| > Once a week | 39 (78.0) | 11 (22.0) | 40 (80.0) | 10 (20.0) | 39 (78.0) | 11 (22.0) | ||||
| Seaweed | 0.949 | 0.636 | 0.405 | |||||||
| ≤ Once a week | 489 (75.1) | 162 (24.9) | 492 (75.6) | 159 (24.4) | 495 (76.0) | 156 (24.0) | ||||
| > Once a week | 656 (75.0) | 219 (25.0) | 652 (74.5) | 223 (25.5) | 649 (74.2) | 226 (25.8) | ||||
| Other seafood items | 0.952 | 0.377 | 0.377 | |||||||
| ≤ Once a week | 1,087 (75.0) | 362 (25.0) | 1,083 (74.7) | 366 (25.3) | 1,083 (74.7) | 366 (25.3) | ||||
| > Once a week | 58 (75.3) | 19 (24.7) | 61 (79.2) | 16 (20.8) | 61 (79.2) | 16 (20.8) | ||||
| Category | Men | Women | ||||||
|---|---|---|---|---|---|---|---|---|
| Unadjusted | Multivariable adjusted modela | Unadjusted | Multivariable adjusted modela | |||||
| The others | Plastics | The others | Plastics | The others | Plastics | The others | Plastics | |
| MEHHP | 1 | 1.42 (1.13–1.79) | 1 | 1.35 (1.05–1.72) | 1 | 1.15 (0.91–1.46) | 1 | 0.94 (0.72–1.22) |
| MEOHP | 1 | 1.56 (1.24–1.97) | 1 | 1.48 (1.16–1.88) | 1 | 1.17 (0.88–1.41) | 1 | 1.05 (0.81–1.34) |
| MECPP | 1 | 1.36 (1.09–1.70) | 1 | 1.32 (1.04–1.66) | 1 | 1.12 (0.89–1.42) | 1 | 1.06 (0.83–1.35) |
| ∑DEHP | 1 | 1.43 (1.14–1.80) | 1 | 1.37 (1.08–1.74) | 1 | 1.19 (0.94–1.50) | 1 | 1.08 (0.84–1.38) |
| MnBP | 1 | 1.47 (1.17–1.86) | 1 | 1.44 (1.13–1.84) | 1 | 1.30 (1.03–1.64) | 1 | 1.17 (0.92–1.50) |
| MBzP | 1 | 1.34 (1.05–1.70) | 1 | 1.22 (0.95–1.56) | 1 | 1.09 (0.86–1.39) | 1 | 0.93 (0.72–1.20) |
| MCPP | 1 | 1.03 (0.83–1.28) | 1 | 0.97 (0.77–1.22) | 1 | 1.19 (0.95–1.49) | 1 | 1.18 (0.93–1.48) |
| MCOP | 1 | 1.10 (0.89–1.36) | 1 | 1.09 (0.88–1.36) | 1 | 0.82 (0.66–1.03) | 1 | 0.85 (0.68–1.07) |
| MCNP | 1 | 0.90 (0.72–1.12) | 1 | 0.84 (0.67–1.05) | 1 | 0.88 (0.70–1.10) | 1 | 0.86 (0.68–1.09) |
Table 1 Baseline characteristics of the participants
Data were presented as median (interquartile range), mean ± standard deviation, or number (%).
MEHHP: mono-(2-ethyl-5-hydroxyhexyl) phthalate; MEOHP: mono-(2-ethyl-5-oxohexyl) phthalate; MECPP: mono-(2-ethyl-5-carboxypentyl) phthalate; ∑DEHP: ∑di(2-ethylhexyl) phthalate; MnBP: mono-n-butyl phthalate; MBzP: mono-benzyl phthalate; MCPP: mono (3-carboxypropyl) phthalate; MCOP: mono-carboxyoctyl phthalate; MCNP: mono-carboxy-isononly phthalate; BMI: body mass index.
a
b
Table 2 Baseline characteristics of the men according to urine phthalate metabolites (MEHHP, MEOHP, MECPP)
Data were presented as mean ± standard deviation or number (%).
MEHHP: mono-(2-ethyl-5-hydroxyhexyl) phthalate; MEOHP: mono-(2-ethyl-5-oxohexyl) phthalate;MECPP: mono-(2-ethyl-5-carboxypentyl) phthalate; BMI: body mass index; PET: polyethylene terephthalate.
a
b
Table 3 Baseline characteristics of the men according to urine phthalate metabolites (∑DEHP, MnBP, MBzP)
Data were presented as mean ± standard deviation or number (%).
∑DEHP: ∑di(2-ethylhexyl) phthalate; MnBP: mono-n-butyl phthalate; MBzP: mono-benzyl phthalate; BMI: body mass index; PET: polyethylene terephthalate.
a
b
Table 4 Baseline characteristics of the men according to urine phthalate metabolites (MCPP, MCOP, MCNP)
Data were presented as mean ± standard deviation or number (%).
MCPP: mono (3-carboxypropyl) phthalate; MCOP: mono-carboxyoctyl phthalate; MCNP: mono-carboxy-isononly phthalate; BMI: body mass index; PET: polyethylene terephthalate.
a
b
Table 5 Adjusted ORs and 95% CIs of the use of plastics in refrigerator food storage with high concentration of urine phthalate metabolites
OR: odds ratio; CI: confidence interval; MEHHP: mono-(2-ethyl-5-hydroxyhexyl) phthalate; MEOHP: mono-(2-ethyl-5-oxohexyl) phthalate; MECPP: mono-(2-ethyl-5-carboxypentyl) phthalate; ∑DEHP: ∑di(2-ethylhexyl) phthalate; MnBP: mono-n-butyl phthalate; MBzP: mono-benzyl phthalate; MCPP: mono (3-carboxypropyl) phthalate; MCOP: mono-carboxyoctyl phthalate; MCNP: mono-carboxy-isononly phthalate.
aMultivariable adjusted model: adjusted for age, body mass index, marital status, smoking, food storage(freezer), type of drinking water, and consumption of plastic bag drink, wrap packing delivery food, PET drinks, microwave food, cup noodles, grilled meat, milk, dairy products, hamburgers, pizza, seafood.

