
Articles
- Page Path
- HOME > Ann Occup Environ Med > Volume 36; 2024 > Article
- Original Article Relationship between crustacean consumption and serum perfluoroalkyl substances (PFAS): the Korean National Environmental Health Survey (KoNEHS) cycle 4
-
Sung Woo Huh
 , Seong-yong Cho, Seongyong Yoon, Daehwan Kim, Hyun Woo Park, Jisoo Kang, Keon Woo Kim
 -
Annals of Occupational and Environmental Medicine 2024;36:e12.
DOI: https://doi.org/10.35371/aoem.2024.36.e12
Published online: April 19, 2024
Department of Occupational and Environmental Medicine, Soonchunhyang University Gumi Hospital, Gumi, Korea.
- Correspondence: Seong-yong Cho. Department of Occupational and Environmental Medicine, Soonchunhyang University Gumi Hospital, 179 1gongdan-ro, Gumi 39371, Korea. 97blueciel@naver.com
• Received: January 10, 2024 • Revised: April 3, 2024 • Accepted: April 17, 2024
© 2024 Korean Society of Occupational & Environmental Medicine
This is an Open Access article distributed under the terms of the Creative Commons Attribution Non-Commercial License (https://creativecommons.org/licenses/by-nc/4.0/) which permits unrestricted non-commercial use, distribution, and reproduction in any medium, provided the original work is properly cited.
Abstract
-
Background Perfluoroalkyl substances (PFASs) are non-aromatic organic compounds, whose hydrogen atoms in the carbon chain substituted by fluorine atoms. PFASs exhibit developmental toxicity, carcinogenicity, hepatotoxicity, reproductive toxicity, immunotoxicity, and hormone toxicity. PFASs are used in the production of disposable food packages, aircraft and automobile devices, cooking utensils, outdoor gear, furniture and carpets, aqueous film forming foam (AFFF), cables and wires, electronics, and semiconductors. This study aimed to determine the association between crustacean consumption and serum PFASs.
-
Methods Adult participants (2,993) aged ≥ 19 years were extracted from the 4th cycle data of the Korean National Environmental Health Survey (KoNEHS). Based on the 50th percentile concentrations of serum PFASs, participants were divided into the low-concentration group (LC) and the high-concentration group (HC). General characteristics, dietary factors, coated product usage, and personal care product usage, an independent t-test and χ2 test were analyzed. The odds ratio (OR) of serum PFAS concentration against crustacean consumption was estimated via logistic regression analysis adjusting for general characteristics, dietary factors, coated product usage, and personal care product usage.
-
Results The OR for the HC of serum PFASs was higher in individuals with ≥once a week crustacean consumption than in those with < once a week crustacean consumption. Estimated ORs were perfluorohexanesulfonic acid 2.15 (95% confidence interval [CI]: 1.53–3.02), perfluorononanoic acid (PFNA) 1.23 (95% CI: 1.07–1.41), and perfluorodecanoic acid (PFDeA) 1.42 (95% CI: 1.17–1.74) in males, and perfluorooctanoic acid 1.48 (95% CI: 1.19–1.84), perfluorooctanesulfonic acid 1.39 (95% CI: 1.27–1.52), PFNA 1.70 (95% CI: 1.29–2.26) and PFDeA 1.43 (95% CI: 1.32–1.54) in females.
-
Conclusions This study revealed the association between the crustacean consumption and concentrations of serum PFASs in general Korean population.
BACKGROUND
Perfluoroalkyl substances (PFASs) are non-aromatic organic chemical compounds, in which hydrogen atoms within the carbon chain are substituted by fluorine atoms.1 PFASs are highly stable based on the strong binding between carbon and fluorine, and their non-stick and surface tension-lowering properties allow application in many fields.1,2 The main uses include disposable food packages, aircraft and automobile devices, cooking utensils, outdoor gear, furniture and carpets, aqueous film forming foam (AFFF), cables and wires, electronics, and semiconductors.3 The high stability of PFASs prevents degradation, continuously affecting the marine environment.4
Crustaceans include shrimps, crayfish, crabs, krill, and etc., and they feed on seaweeds, plankton, small fish, and organic matter in sediments.5,6,7 High concentrations of PFASs are detected in crustaceans due to high PFAS exposure from food and habitat conditions.8 Crustaceans are abundantly found in the marine environment and can be used to quantitatively assess the level of marine pollution, so they are used as biomonitors for PFAS contamination.9,10
The PFAS exposure pathways in the human body include oral intake, dust inhalation, and skin contact, while the main pathway is through food intake.11 The elimination half-life of PFASs in the human body is 2.7 years for perfluorooctanoic acid (PFOA), 3.4 years for perfluorooctanesulfonic acid (PFOS), and 5.3 years for perfluorohexanesulfonic acid (PFHxS), which is considerably long.12 Various symptoms may be induced with long-term persistence of PFASs in the body, from developmental toxicity to carcinogenicity, hepatotoxicity, reproductive toxicity, immunotoxicity, and hormone toxicity.13,14
South Korea’s seafood consumption is one of the highest in Asia, and like ganjang-gejang (soy sauce marinated crab), there is a recipe for eating the intestines of crustaceans.15,16 So far, few large-scale studies in South Korea have investigated the association between crustacean consumption and serum PFAS. Thus, this study aimed to determine the association between crustacean consumption and serum concentrations of PFASs in the Korean population using the 4th cycle data (2018–2020) of the Korean National Environmental Health Survey (KoNEHS).
METHODS
This study used the KoNEHS data collected between 2018 and 2020. 4,239 participants, who were aged ≥ 19 years were selected. The KoNEHS is a national monitoring program that has been conducted by the Ministry of Environment and the National Institute of Environmental Research in 3-year intervals since 2009.17 Those with missing values on the main variables of this study were excluded. After excluding 1,246 participants, 2,993 individuals were included in the analysis (Fig. 1).
Fig. 1

Flow chart of the selection of study participants.
KoNEHS: Korean National Environmental Health Survey; PFAS: perfluoroalkyl substance.
Investigated in KoNEHS data were 5 PFAS types: PFOA, PFOS, PFHxS, perfluorononanoic acid (PFNA), and perfluorodecanoic acid (PFDeA). Blood samples were collected in a container and stored in a −70°C freezer.17 After protein precipitation via centrifugation and removal of, and using the Q-sight Triple Quad High-Performance Liquid Chromatography/Mass Spectrometer (PerkinElmer, Waltham, MA, USA), serum PFASs were isolated and quantitatively analyzed.17 The limit of detection (LOD) in this study was as follows: PFOA 0.071 μg/L, PFOS 0.056 μg/L, PFHxS 0.071 μg/L, PFNA 0.019 μg/L, and PFDeA 0.017 μg/L.17 In this way, serum PFAS concentration was divided into quartiles, and participants were divided into the low-concentration group (LC) and the high-concentration group (HC) based on the 50th percentile concentration.18
The question on crustacean consumption in the KoNEHS is on the following frequency scale: rarely, once a month, 2 to 3 times a month, once a week, 2 to 3 times a week, 4 to 6 times a week, once a day, twice a day, and 3 times a day. The survey about crustacean consumption was conducted from year 2018 to 2020.17 In this study, responses of rarely, once a month, and 2 to 3 times a month were grouped as < once a week consumption, and those of once a week, 2 to 3 times a week, four to 6 times a week, once a day, twice a day, and 3 times a day were grouped as ≥ once a week consumption.19
The confounders in this study were set as follows: general characteristics, including age, body mass index (BMI), marital status, smoking, the usage of products containing PFASs, food and water intake, and ventilation time. To exclude additional PFAS exposure other than crustacean consumption, the usage of products known to contain PFASs for waterproofing or anti-stick purposes, which leads to exposure via oral or dermal was included.11,20 Those are, coated frying pans, coated pots, coated electric cookers, coated containers, hiking suits, hiking boots and sneakers, disposable paper cups, hair products, make-up products, and ultraviolet (UV) block sunscreen.2,11,20,21 The food and water intake items included seafood, the type of indoor or outdoor water drinking, and the average ventilation time per day. 2,11 Consumption of grilled meat and grilled fish was included because frying or grilling can increase the total PFAS, while popcorn and hamburger-pizza-chicken consumption was included because PFAS is used in packages.22,23
Since previous studies recommended separating the analysis of males and females, we stratified the analysis according to the sex of the participants.24 An independent t-test and χ2 test were employed to compare serum PFAS concentrations, general characteristics, dietary factors, coated product usage, and personal care product usage. The odds ratio (OR) of serum PFAS concentration against crustacean consumption was estimated via logistic regression analysis after adjustments for general characteristics, dietary factors, coated product usage, and personal care product usage. In this study, a complex sample analysis was performed, including stratification, clustering, and weighting.17 In all analyses, IBM SPSS version 28 for Windows (IBM Corp., Armonk, NY, USA) was used, and statistical significance was set at p < 0.05.
This study received approval from the Institutional Review Board of Soonchunhyang University Gumi Hospital (IRB No.2023-12-02).
RESULTS
Table 1 describes the general characteristics of the study participants. Among 2,993 participants, 1,298 (43%) were males, and 1,695 (57%) were females. The mean concentrations of PFOA, PFOS, PFHxS, PFNA, and PFDeA were consistently higher in males than in females. Males exhibited higher consumption of large fish and tuna, fish, and seaweeds, and disposable paper cups. Conversely, females showed higher usage frequency of hair products, make-up products, and UV block sunscreen.
Table 1
Baseline characteristics of the participants
Data are presented as mean (95% confidence interval), number (%) for categorical variables and as mean ± standard error for continuous variables.
PFAS: perfluoroalkyl substances; PFOA: perfluorooctanoic acid; PFOS: perfluorooctanesulfonic acid; PFHxS: perfluorohexanesulfonic acid; PFNA: perfluorononanoic acid; PFDeA: perfluorodecanoic acid; BMI: body mass index.
aUnweighted count; bp-value by t-test; cp-value by χ2 test.
Tables 2 and 3 show the distribution of serum PFASs according to the tested variables, with the participants divided into the HC and LC based on the 50th percentile concentrations of serum PFOA, PFOS, PFHxS, PFNA, and PFDeA. For all PFASs; PFOA, PFOS, PFHxS, PFNA, and PFDeA, the average age of males was higher in the HC. Males in the HC had higher percentages when frequently using a coated frying pan or with ≥ once a week crustaceans, shellfish, or seaweed consumption than those with < once a week consumption. Females in the HC had higher percentages when using a coated agent or polish or hiking suit or boots once or more in 1 week and those with ≥ once a week consumption of fish, shellfish, or seaweeds. In both males and females, HC percentages were higher for those consuming groundwater or tap water for drinking compared to those drinking purified or mineral water.
Table 2
Baseline characteristics of the men according to serum perfluoroalkyl substances: PFOA, PFOS, PFHxS, PFNA, PFDeA
Data are presented as number (%) for categorical variables and as mean ± standard error for continuous variables
PFOA: perfluorooctanoic acid; PFOS: perfluorooctanesulfonic acid; PFHxS: perfluorohexanesulfonic acid; PFNA: perfluorononanoic acid; PFDeA: perfluorodecanoic acid; BMI: body mass index
aUnweighted count; bp-value by t-test; cp-value by χ2 test.
Table 3
Baseline characteristics of the women according to serum perfluoroalkyl substances: PFOA, PFOS, PFHxS, PFNA, PFDeA
Data are presented as number (%) for categorical variables and as mean ± standard error for continuous variables.
PFOA: perfluorooctanoic acid; PFOS: perfluorooctanesulfonic acid; PFHxS: perfluorohexanesulfonic acid; PFNA: perfluorononanoic acid; PFDeA: perfluorodecanoic acid; BMI: body mass index.
aUnweighted count; bp-value by t-test; cp-value by χ2 test.
Table 4 describes the results of multiple logistic regression analysis, indicating the association between crustacean consumption and serum PFAS concentration in males and females. The OR was higher in males with ≥once a week crustacean consumption than those with < once a week consumption: PFOA 1.57 (95% CI: 0.85–2.90), PFOS 0.94 (95% CI: 0.71–1.25), PFHxS 2.15 (95% CI: 1.53–3.02), PFNA 1.23 (95% CI: 1.07–1.41), and PFDeA 1.42 (95% CI: 1.17–1.74). The OR was higher in females with ≥ once a week crustacean consumption: PFOA 1.48 (95% CI: 1.19–1.84), PFOS 1.39 (95% CI: 1.27–1.52), PFHxS 1.56 (95% CI: 0.68–3.57), PFNA 1.70 (95% CI: 1.29–2.26), and PFDeA 1.43 (95% CI: 1.32–1.54).
Table 4
Adjusted ORs and 95% CIs of crustacean consumption with high concentrations of serum PFAS
OR: odds ratio; CI: confidence interval; PFAS: perfluoroalkyl substances; PFOA: perfluorooctanoic acid; PFOS: perfluorooctanesulfonic acid; PFHxS: perfluorohexanesulfonic acid; PFNA: perfluorononanoic acid; PFDeA: perfluorodecanoic acid.
aAdjusted for age, body mass index, marital status, smoking, number of coated frying pans usage, number of coated pot usage, number of electric cookers usage, number of coated containers usage, number of hiking suit usage, number of hiking boots and sneakers usage, number of disposable paper cups usage, number of coated agent or polish usage, number of consumption of grilled meat, grilled fish, popcorn, hamburger-pizza-fried chicken, large fish and tuna, fish, crustacean, seaweed, shellfish, other seafood items, type of water drinking indoor, type of water drinking outdoor, average ventilation time per day, usage of hair products, usage of make-up products, usage of ultraviolet block sunscreens.
DISCUSSION
This study demonstrated that the OR for the HC of serum PFASs was higher in individuals with ≥once a week crustacean consumption than in those with < once a week crustacean consumption. PFASs exhibit developmental toxicity, carcinogenicity, hepatotoxicity, reproductive toxicity, immunotoxicity, neurotoxicity, and hormone toxicity.13,25,26 PFOS, PFOA, PFHxS, PFNA, and PFDeA decrease neonatal antibody concentration;27 PFOA, PFNA, and PFDeA cause congenital hypothyroidism;28 PFOA and PFOS increase LDL cholesterol, total cholesterol, and ALT while suppressing antibody responses t, vaccines.25 PFOA and PFOS are associated with testicular cancer, kidney cancer, and low birth weight infants.29,30 Furthermore, PFOA is associated with ulcerative colitis, thyroid disease, and pregnancy-induced hypertension, and PFHxS is associated with developmental disability.31,32,33,34
PFASs are mainly released to the marine environment from industrial and urban wastewater treatment plants.35 From the treatment plants, wastewater with incomplete removal of PFASs is released to river and ultimately flows into seawater.36 For this reason, rivers are considered the main source of PFASs in the marine environment.37 Among different PFASs, PFOA, PFOS, PFNA, PFHxS, and PFDeA (C ≥ 6) which has a linear isomer or long carbon chain exhibit high hydrophobicity to be present abundantly in seawater sediments.38,39 With thermal and chemical stability conferred by the strong C-F bond, PFASs are not readily degraded in the natural environment.1 The half-life of PFOS in underwater environment is 41 years and that of PFOA is 92 years, which is considerably longer in comparison.40 Hence, PFASs, once released into seawater, can persist for a long time without degradation to continuously exert negative effects on marine ecosystems.
A study on marine organisms collected from an urban estuary and a nearby coastal area in Rhodes Island, U.S., revealed a high concentration of PFASs found in crustaceans.41 In Tunisia, it was found that the sum of 8 kinds of PFAS was the highest in crustaceans (2.24 ng/g dry weight [dw]), followed by fish (0.751 ng/g dw), and mollusk (0.510 ng/g dw).42 In a study on seafood in a coastal area on the northeastern side of Brazil, PFOS concentration was the highest in shrimps.43 In a study examining the Bohai Sea in China, the total PFAS was 4.64 μg/kg in crustaceans, 1.82 μg/kg in fish, and 1.40 μg/kg in cephalopods.8 Total PFAS concentration varies where the habitat is, for example, Mexican crab shows 0.16–0.37 μg/kg, while Indonesian crab shows 0.6–2.2 μg/kg of total PFAS concentration.44 Crustaceans feed on PFAS-contaminated sediments, resulting in a higher level of PFAS exposure.10,44
Once absorbed through the gill and food intake by crustaceans, PFASs accumulate in the hepatopancreas, which is responsible for absorbing and storing nutrients.45,46 Long-chain PFASs accumulate at a high density in hepatopancreas due to high affinity to liver fatty acid binding proteins.9,45 In a study on Chinese mitten crab, high levels of perfluorododecanoic acid, perfluorotridecanoic acid, and perfluorotetradecanoic acid were observed in the hepatopancreas compared to muscle or shell tissues.9 In a study on PFOS in the crabs of the Bohai Sea in China, the PFOS concentration was higher in the intestines at 105 ng/g than in other parts at 1.17 ng/g.47,48 In a study conducted in Spain, the total concentration of PFASs was higher in the head of crustaceans, where the hepatopancreas is located.49 In previous study, the correlation between crustacean intestine consumption and blood cadmium level was already shown.15 For humans, PFAS exposure increases as the consumption of flesh and intestines of crustaceans increases.
The PFAS exposure pathways in the human body include oral intake, dust inhalation, and skin contact, while the main pathway is through food intake.11 A study analyzing the statistical data of the National Health and Nutrition Examination Survey in the U.S. reported that the concentrations of serum PFOA, PFOS, PFHxS, perfluoroundecanoic acid, PFNA, and PFDeA increased after crab consumption.50 A study conducted in Japan verified the association between crab or shrimp consumption and increased levels of PFOS and PFOA in blood.51 The largest proportion of PFASs (86%) absorbed via food intake is through seafood, especially fish and crustaceans which are the main causes of PFAS exposure.52 Currently, the European Food Safety Authority set the tolerable weekly intake of 4.4 ng/kg bw per week.25
PFASs consist of 2 parts: the anionic head and the aliphatic tail.53 These 2 parts exhibit strong binding with albumin, while they migrate to various organs via blood.45,47 As they reach the liver, PFASs accumulate inside hepatocytes through binding with liver fatty acid binding proteins.45,54 In the kidney, PFASs released in urine are reabsorbed by the organic anion transporter 4, and in the small intestine, PFASs are reabsorbed by organic anion transporting polypeptide, sodium taurocholate co-transporting polypeptide, and apical sodium-dependent bile acid transporter to remain in the body for long.45,55,56,57 The elimination half-life of PFASs in the human body is 2.7 years for PFOA, 3.4 years for PFOS, and 5.3 years for PFHxS.12 As a result, continuous consumption of crustaceans can cause prolonged effects of PFASs in the human body. Additionally, PFOA, PFOS, PFHxS, PFNA, and PFDeA can serve as key indicators in assessing PFAS exposure associated with crustacean consumption.
This study has limitations. First, the causality remains unidentified as this study was a cross-sectional study. Second, due to the COVID-19 pandemic, the KoNEHS in 2020 had been conducted using non-face-to-face methods and the number of participants in blood analysis was small. Third, the possibility of occupational exposure, such as work environment and use of protective gear, had not been taken into account. Fourth, since the data has only 5 kinds of PFASs in the KoNEHS 4th cycle, other types of PFAS frequently used nowadays were not accounted for.58 Fifth, it was impossible to identify the total PFAS concentration of crustacean in the KoNEHS 4th cycle. Finally, the comparison in this study was based on the frequency of crustacean consumption, the data of which were obtained through recall, implying potential recall bias.
So far, few large-scale studies have been conducted on the association between crustacean consumption and serum PFASs in the Korean population. This study is significant in exploring the association between crustacean consumption and concentrations of serum PFASs by analyzing the data of samples representing the general population of South Korea. Considering that the toxicity of PFASs in the human body is well-known, research on the amount of crustacean consumption which can affect human health, and periodic monitoring is necessary regarding the PFAS concentration in crustaceans.
CONCLUSIONS
This study revealed the association between crustacean consumption and concentrations of serum PFASs in general Korean population. Periodic monitoring of PFAS concentration in crustaceans is needed due to toxicity of PFAS on human.
Acknowledgements
This study used the Korean National Environmental Health Survey cycle 4 (2018–2020), made by National Institute of Environmental Research (NIER-2020-01-01-016). We appreciate National Institute of Environmental Research for making the raw data of Korean National Environmental Health Survey available.
Abbreviations
AFFF
aqueous film forming foam
BMI
body mass index
CI
confidence interval
dw
dry weight
HC
high-concentration group
KoNEHS
Korean National Environmental Health Survey
LC
low-concentration group
LOD
limit of detection
OR
odds ratio
PFAS
perfluoroalkyl substance
PFDeA
perfluorodecanoic acid
PFHxS
perfluorohexanesulfonic acid
PFNA
perfluorononanoic acid
PFOA
perfluorooctanoic acid
PFOS
perfluorooctanesulfonic acid
UV
ultraviolet
-
Funding: This research was supported by the Soonchunhyang University Research Fund and Inha University Hospital’s Environmental Health Center for Training Environmental Medicine Professional funded by the Ministry of Environment, Republic of Korea (2024).
-
Competing interests: The authors declare that they have no competing interests.
-
Author contributions:
NOTES
- 1. Brunn H, Arnold G, Körner W, Rippen G, Steinhäuser KG, Valentin I. PFASs: forever chemicals—persistent, bioaccumulative and mobile. Reviewing the status and the need for their phase out and remediation of contaminated sites. Environ Sci Eur 2023;35(1):20.
- 2. Sunderland EM, Hu XC, Dassuncao C, Tokranov AK, Wagner CC, Allen JG. A review of the pathways of human exposure to poly- and perfluoroalkyl substances (PFASs) and present understanding of health effects. J Expo Sci Environ Epidemiol 2019;29(2):131–147. 30470793.ArticlePubMedPMCPDF
- 3. Wang Z, DeWitt JC, Higgins CP, Cousins IT. A never-ending story of per- and polyfluoroalkyl substances (PFASs)? Environ Sci Technol 2017;51(5):2508–2518. 28224793.ArticlePubMed
- 4. Armitage J, Cousins IT, Buck RC, Prevedouros K, Russell MH, MacLeod M, et al. Modeling global-scale fate and transport of perfluorooctanoate emitted from direct sources. Environ Sci Technol 2006;40(22):6969–6975. 17154003.ArticlePubMed
- 5. Venugopal V, Gopakumar K. Shellfish: nutritive value, health benefits, and consumer safety. Compr Rev Food Sci Food Saf 2017;16(6):1219–1242. 33371588.ArticlePubMedPDF
- 6. Ip CC, Li XD, Zhang G, Wong CS, Zhang WL. Heavy metal and Pb isotopic compositions of aquatic organisms in the Pearl River Estuary, South China. Environ Pollut 2005;138(3):494–504. 15970366.ArticlePubMed
- 7. Barutot RA, D’Incao F, Fonseca D. Natural diet of Neohelice granulata (Dana, 1851) (Crustacea, Varunidae) in two salt marshes of the estuarine region of the Lagoa dos Patos Lagoon. Braz Arch Biol Technol 2011;54(1):91–98.Article
- 8. Guo M, Wu F, Geng Q, Wu H, Song Z, Zheng G, et al. Perfluoroalkyl substances (PFASs) in aquatic products from the Yellow-Bohai Sea coasts, China: concentrations and profiles across species and regions. Environ Pollut 2023;327:121514. 36990342.ArticlePubMed
- 9. Groffen T, Keirsebelik H, Dendievel H, Falcou-Préfol M, Bervoets L, Schoelynck J. Are Chinese mitten crabs (Eriocheir sinensis) suitable as biomonitor or bioindicator of per- and polyfluoroalkyl substances (PFAS) pollution? J Hazard Mater 2024;464:133024. 37988866.PubMed
- 10. de Almeida Rodrigues P, Ferrari RG, Kato LS, Hauser-Davis RA, Conte-Junior CA. A systematic review on metal dynamics and marine toxicity risk assessment using crustaceans as bioindicators. Biol Trace Elem Res 2022;200(2):881–903. 33788164.ArticlePubMedPDF
- 11. DeLuca NM, Angrish M, Wilkins A, Thayer K, Cohen Hubal EA. Human exposure pathways to poly- and perfluoroalkyl substances (PFAS) from indoor media: a systematic review protocol. Environ Int 2021;146:106308. 33395950.ArticlePubMedPMC
- 12. Li Y, Fletcher T, Mucs D, Scott K, Lindh CH, Tallving P, et al. Half-lives of PFOS, PFHxS and PFOA after end of exposure to contaminated drinking water. Occup Environ Med 2018;75(1):46–51. 29133598.ArticlePubMedPMC
- 13. Fenton SE, Ducatman A, Boobis A, DeWitt JC, Lau C, Ng C, et al. Per- and polyfluoroalkyl substance toxicity and human health review: current state of knowledge and strategies for informing future research. Environ Toxicol Chem 2021;40(3):606–630. 33017053.ArticlePubMedPDF
- 14. Jian JM, Chen D, Han FJ, Guo Y, Zeng L, Lu X, et al. A short review on human exposure to and tissue distribution of per- and polyfluoroalkyl substances (PFASs). Sci Total Environ 2018;636:1058–1069. 29913568.ArticlePubMed
- 15. Choi CY, Park GI, Byun YS, Jeon MJ, Choi KH, Sakong J. The association between blood cadmium level, frequency and amount of gejang (marinated crab) intake. Ann Occup Environ Med 2016;28(1):23. 27182443.ArticlePubMedPMC
- 16. Korea Rural Economic Institute (KREI). 2019 Food Balance Sheet. Naju, Korea: KREI; 2019.
- 17. Korean National Institute of Environmental Research. Guidelines for Using Raw Materials for Korean National Environmental Health Survey (Adult)-the Fourth Stage (2018–2020). Incheon, Korea: Korean National Institute of Environmental Research; 2022.
- 18. Daniels SI, Chambers JC, Sanchez SS, La Merrill MA, Hubbard AE, Macherone A, et al. Elevated levels of organochlorine pesticides in South Asian immigrants are associated with an increased risk of diabetes. J Endocr Soc 2018;2(8):832–841. 30019022.ArticlePubMedPMCPDF
- 19. Park M, Kim S, Kim Y, Nam DJ, Ryoo JH, Lim S. Relationship between personal care products usage and triclosan exposure: the second Korean National Environmental Health Survey (KoNEHS 2012-2014). Ann Occup Environ Med 2019;31(1):2. 30705759.ArticlePubMedPMCPDF
- 20. Ragnarsdóttir O, Abdallah MA, Harrad S. Dermal uptake: an important pathway of human exposure to perfluoroalkyl substances? Environ Pollut 2022;307:119478. 35588958.ArticlePubMed
- 21. Whitehead HD, Venier M, Wu Y, Eastman E, Urbanik S, Diamond ML, et al. Fluorinated compounds in North American cosmetics. Environ Sci Technol Lett 2021;8(7):538–544.ArticlePDF
- 22. Seltenrich N. PFAS in food packaging: a hot, greasy exposure. Environ Health Perspect 2020;128(5):54002. 32463326.ArticlePubMedPMC
- 23. Vassiliadou I, Costopoulou D, Kalogeropoulos N, Karavoltsos S, Sakellari A, Zafeiraki E, et al. Levels of perfluorinated compounds in raw and cooked Mediterranean finfish and shellfish. Chemosphere 2015;127:117–126. 25676497.ArticlePubMed
- 24. Jain RB, Ducatman A. Serum concentrations of selected perfluoroalkyl substances for US females compared to males as they age. Sci Total Environ 2022;842:156891. 35753482.ArticlePubMed
- 25. EFSA Panel on Contaminants in the Food Chain (CONTAM). Knutsen HK, Alexander J, Barregård L, Bignami M, Brüschweiler B, et al. Risk to human health related to the presence of perfluorooctane sulfonic acid and perfluorooctanoic acid in food. EFSA J 2018;16(12):e05194. 32625773.PubMedPMC
- 26. Jin R, McConnell R, Catherine C, Xu S, Walker DI, Stratakis N, et al. Perfluoroalkyl substances and severity of nonalcoholic fatty liver in Children: an untargeted metabolomics approach. Environ Int 2020;134:105220. 31744629.ArticlePubMed
- 27. Grandjean P, Heilmann C, Weihe P, Nielsen F, Mogensen UB, Timmermann A, et al. Estimated exposures to perfluorinated compounds in infancy predict attenuated vaccine antibody concentrations at age 5-years. J Immunotoxicol 2017;14(1):188–195. 28805477.ArticlePubMedPMCPDF
- 28. Kim DH, Kim UJ, Kim HY, Choi SD, Oh JE. Perfluoroalkyl substances in serum from South Korean infants with congenital hypothyroidism and healthy infants--Its relationship with thyroid hormones. Environ Res 2016;147:399–404. 26950028.ArticlePubMed
- 29. Steenland K, Winquist A. PFAS and cancer, a scoping review of the epidemiologic evidence. Environ Res 2021;194:110690. 33385391.ArticlePubMedPMC
- 30. Xiao C, Grandjean P, Valvi D, Nielsen F, Jensen TK, Weihe P, et al. Associations of exposure to perfluoroalkyl substances with thyroid hormone concentrations and birth size. J Clin Endocrinol Metab 2020;105(3):735–745. 31665456.ArticlePubMedPDF
- 31. Steenland K, Zhao L, Winquist A, Parks C. Ulcerative colitis and perfluorooctanoic acid (PFOA) in a highly exposed population of community residents and workers in the Mid-Ohio Valley. Environ Health Perspect 2013;121(8):900–905. 23735465.ArticlePubMedPMC
- 32. Darrow LA, Stein CR, Steenland K. Serum perfluorooctanoic acid and perfluorooctane sulfonate concentrations in relation to birth outcomes in the Mid-Ohio Valley, 2005-2010. Environ Health Perspect 2013;121(10):1207–1213. 23838280.ArticlePubMedPMC
- 33. Lopez-Espinosa MJ, Mondal D, Armstrong B, Bloom MS, Fletcher T. Thyroid function and perfluoroalkyl acids in children living near a chemical plant. Environ Health Perspect 2012;120(7):1036–1041. 22453676.ArticlePubMedPMC
- 34. Yao W, Xu J, Tang W, Gao C, Tao L, Yu J, et al. Developmental toxicity of perfluorohexane sulfonate at human relevant dose during pregnancy via disruption in placental lipid homeostasis. Environ Int 2023;177:108014. 37315490.ArticlePubMed
- 35. Panieri E, Baralic K, Djukic-Cosic D, Buha Djordjevic A, Saso L. PFASs molecules: a major concern for the human health and the environment. Toxics 2022;10(2):44. 35202231.ArticlePubMedPMC
- 36. Murakami M, Imamura E, Shinohara H, Kiri K, Muramatsu Y, Harada A, et al. Occurrence and sources of perfluorinated surfactants in rivers in Japan. Environ Sci Technol 2008;42(17):6566–6572. 18800531.ArticlePubMed
- 37. Lukić Bilela L, Matijošytė I, Krutkevičius J, Alexandrino DA, Safarik I, Burlakovs J, et al. Impact of per- and polyfluorinated alkyl substances (PFAS) on the marine environment: raising awareness, challenges, legislation, and mitigation approaches under the One Health concept. Mar Pollut Bull 2023;194(Pt A):115309. 37591052.ArticlePubMed
- 38. Mussabek D, Ahrens L, Persson KM, Berndtsson R. Temporal trends and sediment-water partitioning of per- and polyfluoroalkyl substances (PFAS) in lake sediment. Chemosphere 2019;227:624–629. 31009869.ArticlePubMed
- 39. Schulz K, Silva MR, Klaper R. Distribution and effects of branched versus linear isomers of PFOA, PFOS, and PFHxS: a review of recent literature. Sci Total Environ 2020;733:139186. 32474294.ArticlePubMed
- 40. Hung MD, Jung HJ, Jeong HH, Lam NH, Cho HS. Perfluoroalkyl substances (PFASs) in special management sea areas of Korea: distribution and bioconcentration in edible fish species. Mar Pollut Bull 2020;156:111236. 32510380.ArticlePubMed
- 41. Hedgespeth ML, Taylor DL, Balint S, Schwartz M, Cantwell MG. Ecological characteristics impact PFAS concentrations in a U.S. North Atlantic food web. Sci Total Environ 2023;880:163302. 37031936.ArticlePubMedPMC
- 42. Barhoumi B, Sander SG, Driss MR, Tolosa I. Survey of legacy and emerging per- and polyfluorinated alkyl substances in Mediterranean seafood from a North African ecosystem. Environ Pollut 2022;292(Pt B):118398. 34695516.ArticlePubMed
- 43. Miranda DA, Benskin JP, Awad R, Lepoint G, Leonel J, Hatje V. Bioaccumulation of per- and polyfluoroalkyl substances (PFASs) in a tropical estuarine food web. Sci Total Environ 2021;754:142146. 33254889.ArticlePubMed
- 44. Young W, Wiggins S, Limm W, Fisher CM, DeJager L, Genualdi S. Analysis of per- and poly(fluoroalkyl) substances (PFASss) in highly consumed seafood products from U.S. markets. J Agric Food Chem 2022;70(42):13545–13553. 36251396.ArticlePubMedPMCPDF
- 45. Zhao L, Teng M, Zhao X, Li Y, Sun J, Zhao W, et al. Insight into the binding model of per- and polyfluoroalkyl substances to proteins and membranes. Environ Int 2023;175:107951. 37126916.ArticlePubMed
- 46. Wang W, Wu X, Liu Z, Zheng H, Cheng Y. Insights into hepatopancreatic functions for nutrition metabolism and ovarian development in the crab Portunus trituberculatus: gene discovery in the comparative transcriptome of different hepatopancreas stages. PLoS One 2014;9(1):e84921. 24454766.ArticlePubMedPMC
- 47. Choi S, Kim JJ, Kim MH, Joo YS, Chung MS, Kho Y, et al. Origin and organ-specific bioaccumulation pattern of perfluorinated alkyl substances in crabs. Environ Pollut 2020;261:114185. 32114125.ArticlePubMed
- 48. Yang L, Tian S, Zhu L, Liu Z, Zhang Y. Bioaccumulation and distribution of perfloroalkyl acids in seafood products from Bohai Bay, China. Environ Toxicol Chem 2012;31(9):1972–1979. 22707313.ArticlePubMedPDF
- 49. Marín-García M, Fàbregas C, Argenté C, Díaz-Ferrero J, Gómez-Canela C. Accumulation and dietary risks of perfluoroalkyl substances in fish and shellfish: a market-based study in Barcelona. Environ Res 2023;237(Pt 2):117009. 37652217.ArticlePubMed
- 50. Christensen KY, Raymond M, Blackowicz M, Liu Y, Thompson BA, Anderson HA, et al. Perfluoroalkyl substances and fish consumption. Environ Res 2017;154:145–151. 28073048.ArticlePubMed
- 51. Yamaguchi M, Arisawa K, Uemura H, Katsuura-Kamano S, Takami H, Sawachika F, et al. Consumption of seafood, serum liver enzymes, and blood levels of PFOS and PFOA in the Japanese population. J Occup Health 2013;55(3):184–194. 23574777.ArticlePubMedPDF
- 52. European Food Safety Authority (EFSA). Perfluorooctane sulfonate (PFOS), perfluorooctanoic acid (PFOA) and their salts scientific opinion of the Panel on Contaminants in the Food Chain. EFSA J 2008;6(7):653. 37213838.ArticlePubMedPMCPDF
- 53. MacManus-Spencer LA, Tse ML, Hebert PC, Bischel HN, Luthy RG. Binding of perfluorocarboxylates to serum albumin: a comparison of analytical methods. Anal Chem 2010;82(3):974–981. 20039637.ArticlePubMed
- 54. Sheng N, Cui R, Wang J, Guo Y, Wang J, Dai J. Cytotoxicity of novel fluorinated alternatives to long-chain perfluoroalkyl substances to human liver cell line and their binding capacity to human liver fatty acid binding protein. Arch Toxicol 2018;92(1):359–369. 28864880.ArticlePubMedPDF
- 55. Zhao W, Zitzow JD, Weaver Y, Ehresman DJ, Chang SC, Butenhoff JL, et al. Organic anion transporting polypeptides contribute to the disposition of perfluoroalkyl acids in humans and rats. Toxicol Sci 2017;156(1):84–95. 28013215.ArticlePubMedPMC
- 56. Yang CH, Glover KP, Han X. Characterization of cellular uptake of perfluorooctanoate via organic anion-transporting polypeptide 1A2, organic anion transporter 4, and urate transporter 1 for their potential roles in mediating human renal reabsorption of perfluorocarboxylates. Toxicol Sci 2010;117(2):294–302. 20639259.ArticlePubMed
- 57. Salihović S, Dickens AM, Schoultz I, Fart F, Sinisalu L, Lindeman T, et al. Simultaneous determination of perfluoroalkyl substances and bile acids in human serum using ultra-high-performance liquid chromatography-tandem mass spectrometry. Anal Bioanal Chem 2020;412(10):2251–2259. 31760452.ArticlePubMedPMCPDF
- 58. Dewapriya P, Chadwick L, Gorji SG, Schulze B, Valsecchi S, Samanipour S, et al. Per- and polyfluoroalkyl substances (PFAS) in consumer products: current knowledge and research gaps. J Hazard Mater Lett 2023;4:100086.Article
REFERENCES
REFERENCES
Figure & Data
REFERENCES
Citations
Citations to this article as recorded by 
- Association between outdoor clothing use and serum perfluoroalkyl substances (PFAS): Korean National Environmental Health Survey cycle 4
Keon Woo Kim, Jisoo Kang, Seong-yong Cho, Seongyong Yoon, Daehwan Kim, Hyun Woo Park
Annals of Occupational and Environmental Medicine.2026; 38: e4. CrossRef - Environment-wide association study of five per- and polyfluoroalkyl substance (PFASs) exposure pathways in Korean adolescents from the Korean National Environmental Health Survey (2018–2020)
Soonsu Shin, Dajeong Ham, Sanghyuk Bae
Chemosphere.2025; 373: 144161. CrossRef - Environmental disease monitoring by regional Environmental Health
Centers in Korea: a narrative review
Myung-Sook Park, Hwan-Cheol Kim, Woo Jin Kim, Yun-Chul Hong, Won-Jun Choi, Seock-Yeon Hwang, Jiho Lee, Young-Seoub Hong, Yong-Dae Kim, Seong-Chul Hong, Joo Hyun Sung, Inchul Jeong, Kwan Lee, Won-Ju Park, Hyun-Joo Bae, Seong-Yong Yoon, Cheolmin Lee, Kyoung
The Ewha Medical Journal.2025;[Epub] CrossRef - Presence of per- and poly-fluoroalkyl substances (PFAS) in brain samples of marine mammals from the St. Lawrence Estuary and Gulf, Canada
Nejumal Kannankeril Khalid, Amira Aker, Stéphane Lair, Sébastien Sauvé
Environmental Science: Advances.2025; 4(10): 1599. CrossRef - Association between exposure to VOCs mixture and impaired renal function in Korean adults
Seong-Uk Baek, Jin-Ha Yoon
American Journal of Epidemiology.2025; 194(12): 3520. CrossRef - The Exposure Status of Environmental Chemicals in South Korea: The Korean National Environmental Health Survey 2018–2020
Sooyeon Hong, Ok-Jin Kim, Sun Kyoung Jung, Hye Li Jeon, Suejin Kim, Jihyon Kil
Toxics.2024; 12(11): 829. CrossRef
 Cite
Cite- Figure
-
- Related articles
-
- Association between outdoor clothing use and serum perfluoroalkyl substances (PFAS): Korean National Environmental Health Survey cycle 4
- Relationship between the use of hair products and urine benzophenone-3: the Korean National Environmental Health Survey (KoNEHS) cycle 4
- Association between serum perfluoroalkyl substances concentrations and non-alcoholic fatty liver disease among Korean adults: a cross-sectional study using the National Environmental Health Survey cycle 4
Relationship between crustacean consumption and serum perfluoroalkyl substances (PFAS): the Korean National Environmental Health Survey (KoNEHS) cycle 4
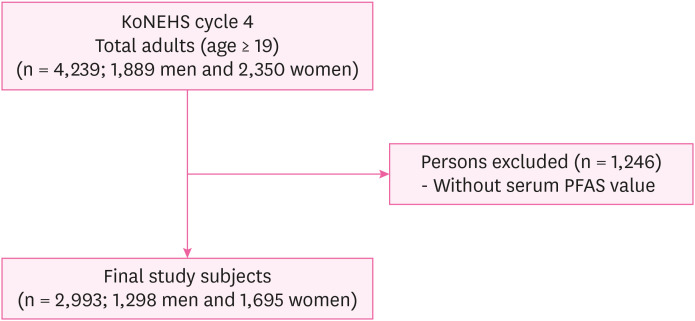
Fig. 1 Flow chart of the selection of study participants.KoNEHS: Korean National Environmental Health Survey; PFAS: perfluoroalkyl substance.
Fig. 1
Relationship between crustacean consumption and serum perfluoroalkyl substances (PFAS): the Korean National Environmental Health Survey (KoNEHS) cycle 4
| Category | Total (n = 2,993)a | Men (n = 1,298) | Women (n = 1,695) | ||
|---|---|---|---|---|---|
| PFAS | |||||
| PFOA | 7.66 (7.33–8.00) | 7.99 (7.53–8.45) | 7.34 (7.13–7.55) | < 0.001b | |
| PFOS | 18.87 (18.64–19.10) | 20.26 (19.53–20.98) | 17.48 (17.02–17.94) | < 0.001 | |
| PFHxS | 5.76 (5.39–6.12) | 6.42 (6.11–6.74) | 5.09 (4.68–5.50) | < 0.001 | |
| PFNA | 2.54 (2.52–2.57) | 2.73 (2.71–2.75) | 2.35 (2.32–2.39) | < 0.001 | |
| PFDeA | 1.08 (1.06–1.10) | 1.15 (1.13–1.17) | 1.01 (1.00–1.03) | < 0.001 | |
| Age | 47.4 ± 0.13 | 46.4 ± 0.18 | 48.5 ± 0.10 | < 0.001 | |
| BMI group | 0.003c | ||||
| ≤ 25 kg/m2 | 1,577 (53.4) | 595 (46.1) | 982 (60.7) | ||
| > 25 kg/m2 | 1,416 (46.6) | 703 (53.9) | 713 (39.3) | ||
| Marital status | 0.001 | ||||
| Single | 354 (22.8) | 176 (26.5) | 178 (19.2) | ||
| Married | 2,286 (67.8) | 1,035 (69.0) | 1,251 (66.6) | ||
| Others | 353 (9.4) | 87 (4.5) | 266 (14.2) | ||
| Smoking | < 0.001 | ||||
| None or ex-smoker | 2,527 (80.9) | 879 (64.7) | 1,648 (97.0) | ||
| Current smoker | 466 (19.1) | 419 (35.3) | 47 (3.0) | ||
| Coated frying pans usage | < 0.001 | ||||
| < Once a week | 199 (5.5) | 96 (6.0) | 103 (5.0) | ||
| ≥ Once a week | 2,794 (94.5) | 1,202 (94.0) | 1,592 (95.0) | ||
| Coated pot usage | 0.046 | ||||
| < Once a week | 1,250 (41.1) | 543 (39.7) | 707 (42.4) | ||
| ≥ Once a week | 1,743 (58.9) | 755 (60.3) | 988 (57.6) | ||
| Coated electric cookers usage | 0.770 | ||||
| < Once a week | 411 (14.1) | 173 (14.1) | 238 (14.1) | ||
| ≥ Once a week | 2,582 (85.9) | 1,125 (85.9) | 1,457 (85.9) | ||
| Coated containers usage | 0.047 | ||||
| < Once a week | 2,594 (86.4) | 1,126 (86.1) | 1,468 (86.7) | ||
| ≥ Once a week | 399 (13.6) | 172 (13.9) | 227 (13.3) | ||
| Hiking suit usage | 0.002 | ||||
| < Once a week | 1,869 (62.4) | 697 (54.6) | 1,172 (70.0) | ||
| ≥ Once a week | 1,124 (37.6) | 601 (45.4) | 523 (30.0) | ||
| Hiking boots and sneakers usage | < 0.001 | ||||
| < Once a week | 1,872 (61.1) | 708 (52.9) | 1,164 (69.3) | ||
| ≥ Once a week | 1,121 (38.9) | 590 (47.1) | 531 (30.7) | ||
| Disposable paper cups usage | < 0.001 | ||||
| < Once a week | 1,286 (41.3) | 419 (30.8) | 867 (51.6) | ||
| ≥ Once a week | 1,707 (58.7) | 879 (69.2) | 828 (48.4) | ||
| Coated agent or polish usage | 0.006 | ||||
| < Once a week | 2,969 (99.2) | 1,279 (98.7) | 1,690 (99.7) | ||
| ≥ Once a week | 24 (0.8) | 19 (1.3) | 5 (0.3) | ||
| Consumption of grilled meat | 0.001 | ||||
| < Once a week | 1,813 (53.6) | 730 (47.2) | 1,083 (59.9) | ||
| ≥ Once a week | 1,180 (46.4) | 568 (52.8) | 612 (40.1) | ||
| Consumption of grilled fish | 0.001 | ||||
| < Once a week | 2,377 (79.3) | 1,019 (77.3) | 1,358 (81.3) | ||
| ≥ Once a week | 616 (20.7) | 279 (22.7) | 337 (18.7) | ||
| Consumption of popcorn | 0.405 | ||||
| < Once a week | 2,976 (99.1) | 1,291 (98.9) | 1,685 (99.3) | ||
| ≥ Once a week | 17 (0.9) | 7 (1.1) | 10 (0.7) | ||
| Consumption of hamburger-pizza-fried chicken | < 0.001 | ||||
| < Once a week | 2,558 (78.1) | 1,084 (72.7) | 1,474 (83.4) | ||
| ≥ Once a week | 435 (21.9) | 214 (27.3) | 221 (16.6) | ||
| Consumption of large fish and tuna | 0.002 | ||||
| < Once a week | 2,700 (88.0) | 1,148 (84.5) | 1,552 (91.5) | ||
| ≥ Once a week | 293 (12.0) | 150 (15.5) | 143 (8.5) | ||
| Consumption of fish | 0.001 | ||||
| < Once a week | 1,349 (48.9) | 552 (46.8) | 797 (50.9) | ||
| ≥ Once a week | 1,644 (51.1) | 746 (53.2) | 898 (49.1) | ||
| Consumption of crustacean | 0.076 | ||||
| < Once a week | 2,753 (91.8) | 1,189 (91.6) | 1,564 (92.1) | ||
| ≥ Once a week | 240 (8.2) | 109 (8.4) | 131 (7.9) | ||
| Consumption of seaweed | 0.136 | ||||
| < Once a week | 700 (23.6) | 287 (22.8) | 413 (24.4) | ||
| ≥ Once a week | 2,293 (76.4) | 1,011 (77.2) | 1,282 (75.6) | ||
| Consumption of shellfish | 0.001 | ||||
| < Once a week | 2,600 (85.4) | 1,121 (84.2) | 1,479 (86.5) | ||
| ≥ Once a week | 393 (14.6) | 177 (15.8) | 216 (13.5) | ||
| Consumption of other seafood items | 0.004 | ||||
| < Once a week | 2,634 (87.4) | 1,125 (85.3) | 1,509 (89.4) | ||
| ≥ Once a week | 359 (12.6) | 173 (14.7) | 186 (10.6) | ||
| Type of water drinking indoor | 0.001 | ||||
| Water purifier, bottled water, etc. | 2,047 (71.4) | 896 (73.5) | 1,151 (69.4) | ||
| Underground water, small-scale water-supply system, tap water | 946 (28.6) | 402 (26.5) | 544 (30.6) | ||
| Type of water drinking outdoor | < 0.001 | ||||
| Water purifier, bottled water, etc. | 2,747 (93.3) | 1,207 (95.1) | 1,540 (91.4) | ||
| Underground water, small-scale water-supply system, tap water | 246 (6.7) | 91 (4.9) | 155 (8.6) | ||
| Average ventilation time per day | 0.043 | ||||
| < 30 min | 354 (10.5) | 174 (11.3) | 180 (9.7) | ||
| ≥ 30 min, < 60 min | 371 (11.1) | 156 (10.6) | 215 (11.4) | ||
| ≥ 60 min, < 600 min | 1,112 (36.6) | 488 (37.7) | 624 (35.6) | ||
| ≥ 600 min | 1,156 (41.8) | 480 (40.4) | 676 (43.3) | ||
| Usage of hair products | < 0.001 | ||||
| < Once a week | 2,019 (67.6) | 1,102 (81.2) | 917 (54.1) | ||
| ≥ Once a week | 974 (32.4) | 196 (18.8) | 778 (45.9) | ||
| Usage of make-up products | < 0.001 | ||||
| < Once a week | 1,399 (50.7) | 1,139 (87.3) | 260 (14.4) | ||
| ≥ Once a week | 1,594 (49.3) | 159 (12.7) | 1,435 (85.6) | ||
| Usage of ultraviolet block sunscreens | < 0.001 | ||||
| < Once a week | 1,405 (49.2) | 1,086 (82.2) | 319 (16.4) | ||
| ≥ Once a week | 1,588 (50.8) | 212 (17.8) | 1,376 (83.6) | ||
| Variable | PFOA | PFOS | PFHxS | PFNA | PFDeA | |||||||||||
|---|---|---|---|---|---|---|---|---|---|---|---|---|---|---|---|---|
| Low (n = 649)a | High (n = 649) | Low (n = 649) | High (n = 649) | Low (n = 649)a | High (n = 649) | Low (n = 649) | High (n = 649) | Low (n = 649) | High (n = 649) | |||||||
| Age | 40.5 ± 0.27 | 54.4 ± 0.33 | < 0.001b | 39.4 ± 0.27 | 56.9 ± 0.23 | < 0.001 | 40.8 ± 0.25 | 52.9 ± 0.35 | < 0.001b | 39.4 ± 0.32 | 57.0 ± 0.08 | < 0.001 | 39.2 ± 0.29 | 58.0 ± 0.11 | < 0.001 | |
| BMI group | 0.013c | 0.489 | 0.737c | 0.737 | 0.044 | |||||||||||
| ≤ 25 kg/m2 | 321 (59.9) | 274 (40.1) | 301 (60.3) | 294 (39.7) | 303 (54.0) | 292 (46.0) | 315 (60.6) | 280 (39.4) | 294 (59.8) | 301 (40.2) | ||||||
| > 25 kg/m2 | 328 (55.9) | 375 (44.1) | 348 (60.6) | 355 (39.4) | 346 (54.3) | 357 (45.7) | 334 (60.3) | 369 (39.7) | 355 (63.8) | 348 (36.2) | ||||||
| Marital status | < 0.001 | < 0.001 | 0.001 | 0.001 | 0.001 | |||||||||||
| Single | 145 (88.5) | 31 (11.5) | 153 (90.5) | 23 (9.5) | 135 (80.8) | 41 (19.2) | 159 (96.5) | 17 (3.5) | 162 (97.0) | 14 (3.0) | ||||||
| Married | 452 (45.4) | 583 (54.6) | 452 (49.2) | 583 (50.8) | 477 (44.7) | 558 (55.3) | 445 (46.7) | 590 (53.3) | 442 (49.0) | 593 (51.0) | ||||||
| Others | 52 (65.0) | 35 (35.0) | 44 (56.1) | 43 (43.9) | 37 (40.9) | 50 (59.1) | 45 (59.2) | 42 (40.8) | 45 (54.1) | 42 (45.9) | ||||||
| Smoking | 0.190 | < 0.001 | 0.675 | 0.007 | 0.004 | |||||||||||
| None or ex-smoker | 422 (56.9) | 457 (43.1) | 400 (57.7) | 479 (42.3) | 438 (54.4) | 441 (45.6) | 412 (58.9) | 467 (41.1) | 405 (59.4) | 474 (40.6) | ||||||
| Current smoker | 227 (59.3) | 192 (40.7) | 249 (65.4) | 170 (34.6) | 211 (53.6) | 208 (46.4) | 237 (63.3) | 182 (36.7) | 244 (66.7) | 175 (33.3) | ||||||
| Coated frying pans usage | 0.004 | < 0.001 | 0.002 | 0.001 | < 0.001 | |||||||||||
| < Once a week | 54 (76.0) | 42 (24.0) | 49 (75.6) | 47 (24.4) | 53 (72.6) | 43 (27.4) | 46 (64.7) | 50 (35.3) | 48 (73.3) | 48 (26.7) | ||||||
| ≥ Once a week | 595 (56.6) | 607 (43.4) | 600 (59.5) | 602 (40.5) | 596 (53.0) | 606 (47.0) | 603 (60.2) | 599 (39.8) | 601 (61.3) | 601 (38.7) | ||||||
| Coated pot usage | 0.374 | 0.018 | 0.123 | 0.304 | 0.485 | |||||||||||
| < Once a week | 258 (56.9) | 285 (43.1) | 252 (57.3) | 291 (42.7) | 274 (56.0) | 269 (44.0) | 267 (59.5) | 276 (40.5) | 265 (61.5) | 278 (38.5) | ||||||
| ≥ Once a week | 391 (58.3) | 364 (41.7) | 397 (62.5) | 358 (37.5) | 375 (52.9) | 380 (47.1) | 382 (61.1) | 373 (38.9) | 384 (62.3) | 371 (37.7) | ||||||
| Coated electric cookers usage | 0.807 | 0.311 | 0.020 | 0.081 | 0.340 | |||||||||||
| < Once a week | 84 (57.9) | 89 (42.1) | 83 (61.4) | 90 (38.6) | 88 (52.0) | 85 (48.0) | 82 (58.2) | 91 (41.8) | 83 (63.2) | 90 (36.8) | ||||||
| ≥ Once a week | 565 (57.7) | 560 (42.3) | 566 (60.3) | 559 (39.7) | 561 (54.5) | 564 (45.5) | 567 (60.8) | 558 (39.2) | 566 (61.8) | 559 (38.2) | ||||||
| Coated containers usage | < 0.001 | 0.002 | 0.249 | < 0.001 | 0.005 | |||||||||||
| < Once a week | 555 (56.3) | 571 (43.7) | 544 (58.7) | 582 (41.3) | 570 (53.8) | 556 (46.2) | 546 (58.9) | 580 (41.1) | 543 (60.1) | 583 (39.9) | ||||||
| ≥ Once a week | 94 (66.6) | 78 (33.4) | 105 (71.0) | 67 (29.0) | 79 (56.6) | 93 (43.4) | 103 (69.9) | 69 (30.1) | 106 (73.4) | 66 (26.6) | ||||||
| Hiking suit usage | 0.021 | 0.477 | 0.136 | 0.055 | 0.174 | |||||||||||
| < Once a week | 378 (61.7) | 319 (38.3) | 349 (61.0) | 348 (39.0) | 347 (55.3) | 350 (44.7) | 370 (62.8) | 327 (37.2) | 371 (62.7) | 326 (37.3) | ||||||
| ≥ Once a week | 271 (52.9) | 330 (47.1) | 300 (59.8) | 301 (40.2) | 302 (52.8) | 299 (47.2) | 279 (57.6) | 322 (42.4) | 278 (61.1) | 323 (38.9) | ||||||
| Hiking boots and sneakers usage | 0.006 | 0.156 | < 0.001 | 0.053 | 0.103 | |||||||||||
| < Once a week | 372 (59.5) | 336 (40.5) | 357 (60.1) | 351 (39.9) | 365 (56.7) | 343 (43.3) | 365 (59.6) | 343 (40.4) | 365 (60.9) | 343 (39.1) | ||||||
| ≥ Once a week | 277 (55.8) | 313 (44.2) | 292 (60.9) | 298 (39.1) | 284 (51.3) | 306 (48.7) | 284 (61.3) | 306 (38.7) | 284 (63.2) | 306 (36.8) | ||||||
| Disposable paper cups usage | 0.090 | 0.005 | 0.002 | 0.215 | < 0.001 | |||||||||||
| < Once a week | 214 (58.7) | 205 (41.3) | 192 (55.0) | 227 (45.0) | 204 (50.5) | 215 (49.5) | 209 (60.8) | 210 (39.2) | 210 (58.9) | 209 (41.1) | ||||||
| ≥ Once a week | 435 (57.3) | 444 (42.7) | 457 (62.9) | 422 (37.1) | 445 (55.8) | 434 (44.2) | 440 (60.3) | 439 (39.7) | 439 (63.3) | 440 (36.7) | ||||||
| Coated agent or polish usage | 0.043 | 0.076 | 0.042 | 0.011 | 0.007 | |||||||||||
| < Once a week | 641 (57.8) | 638 (42.2) | 640 (60.4) | 639 (39.6) | 641 (54.3) | 638 (45.7) | 641 (60.5) | 638 (39.5) | 641 (62.1) | 638 (37.9) | ||||||
| ≥ Once a week | 8 (49.6) | 11 (50.4) | 9 (60.8) | 10 (39.2) | 8 (40.0) | 11 (60.0) | 8 (56.3) | 11 (43.7) | 8 (55.1) | 11 (44.9) | ||||||
| Consumption of grilled meat | 0.165 | 0.004 | 0.060 | 0.494 | 0.029 | |||||||||||
| < Once a week | 358 (57.0) | 372 (73.0) | 317 (53.2) | 413 (46.8) | 362 (52.2) | 368 (47.8) | 345 (60.0) | 385 (40.0) | 337 (58.8) | 393 (41.2) | ||||||
| ≥ Once a week | 291 (58.4) | 277 (41.6) | 332 (66.9) | 236 (33.1) | 287 (55.9) | 281 (44.1) | 304 (60.8) | 264 (39.2) | 312 (64.8) | 256 (35.2) | ||||||
| Consumption of grilled fish | < 0.001 | 0.649 | 0.012 | 0.073 | 0.034 | |||||||||||
| < Once a week | 526 (58.3) | 493 (41.7) | 530 (60.5) | 489 (39.5) | 508 (53.0) | 511 (47.0) | 532 (61.1) | 487 (38.9) | 537 (63.0) | 482 (37.0) | ||||||
| ≥ Once a week | 123 (55.9) | 156 (44.1) | 119 (60.3) | 160 (39.7) | 141 (58.2) | 138 (41.8) | 117 (58.3) | 162 (41.7) | 112 (58.7) | 167 (41.3) | ||||||
| Consumption of popcorn | 0.002 | < 0.001 | < 0.001 | < 0.001 | < 0.001 | |||||||||||
| < Once a week | 645 (57.5) | 646 (42.5) | 644 (60.1) | 647 (39.9) | 644 (53.8) | 647 (46.2) | 645 (60.3) | 646 (39.7) | 644 (61.7) | 647 (38.3) | ||||||
| ≥ Once a week | 4 (74.5) | 3 (25.5) | 5 (87.4) | 2 (12.6) | 5 (87.4) | 2 (12.6) | 4 (74.5) | 3 (25.5) | 5 (87.4) | 2 (12.6) | ||||||
| Consumption of hamburger-pizza-fried chicken | < 0.001 | < 0.001 | < 0.001 | < 0.001 | < 0.001 | |||||||||||
| < Once a week | 492 (50.3) | 592 (49.7) | 476 (51.9) | 608 (48.1) | 514 (48.1) | 570 (51.9) | 479 (52.5) | 605 (47.5) | 472 (53.6) | 612 (46.4) | ||||||
| ≥ Once a week | 157 (77.6) | 57 (22.4) | 173 (83.2) | 41 (16.8) | 135 (70.2) | 79 (29.8) | 170 (81.7) | 44 (18.3) | 177 (84.5) | 37 (15.5) | ||||||
| Consumption of large fish and tuna | < 0.001 | < 0.001 | 0.002 | 0.002 | 0.002 | |||||||||||
| < Once a week | 553 (55.5) | 595 (44.5) | 547 (58.0) | 601 (42.0) | 562 (52.2) | 586 (47.8) | 544 (57.8) | 604 (42.2) | 544 (58.7) | 604 (41.3) | ||||||
| ≥ Once a week | 96 (70.1) | 54 (29.9) | 102 (73.8) | 48 (26.2) | 87 (64.9) | 63 (35.1) | 105 (75.1) | 45 (24.9) | 105 (79.9) | 45 (20.1) | ||||||
| Consumption of fish | < 0.001 | 0.002 | < 0.001 | 0.002 | 0.004 | |||||||||||
| < Once a week | 339 (69.9) | 213 (30.1) | 336 (69.9) | 216 (30.1) | 302 (59.9) | 250 (40.1) | 340 (72.2) | 212 (27.8) | 348 (73.3) | 204 (26.7) | ||||||
| ≥ Once a week | 310 (47.0) | 436 (53.0) | 313 (52.1) | 433 (47.9) | 347 (49.1) | 399 (50.9) | 309 (50.1) | 437 (49.9) | 301 (52.0) | 445 (48.0) | ||||||
| Consumption of crustacean | 0.005 | 0.008 | < 0.001 | < 0.001 | < 0.001 | |||||||||||
| < Once a week | 602 (59.5) | 587 (40.5) | 590 (61.2) | 599 (38.8) | 606 (55.8) | 583 (44.2) | 594 (62.0) | 595 (38.0) | 592 (63.5) | 597 (36.5) | ||||||
| ≥ Once a week | 47 (38.1) | 62 (61.9) | 59 (52.4) | 50 (47.6) | 43 (35.9) | 66 (64.1) | 55 (43.9) | 54 (56.1) | 57 (45.8) | 52 (54.2) | ||||||
| Consumption of seaweed | 0.008 | < 0.001 | 0.450 | 0.004 | 0.007 | |||||||||||
| < Once a week | 164 (66.5) | 123 (33.5) | 157 (65.6) | 130 (34.4) | 148 (54.4) | 139 (45.6) | 162 (71.7) | 125 (28.3) | 161 (70.6) | 126 (29.4) | ||||||
| ≥ Once a week | 485 (55.1) | 526 (44.9) | 492 (58.9) | 519 (41.1) | 501 (54.1) | 510 (45.9) | 487 (57.1) | 524 (42.9) | 488 (59.4) | 523 (40.6) | ||||||
| Consumption of shellfish | < 0.001 | < 0.001 | < 0.001 | 0.003 | 0.004 | |||||||||||
| < Once a week | 588 (61.1) | 533 (38.9) | 574 (62.7) | 547 (37.3) | 582 (55.8) | 539 (44.2) | 580 (63.3) | 541 (36.7) | 576 (64.0) | 545 (36.0) | ||||||
| ≥ Once a week | 61 (39.9) | 116 (60.1) | 75 (48.4) | 102 (51.6) | 67 (45.1) | 110 (54.9) | 69 (45.1) | 108 (54.9) | 73 (51.1) | 104 (48.9) | ||||||
| Consumption of other seafood items | 0.005 | 0.011 | 0.003 | 0.040 | 0.286 | |||||||||||
| < Once a week | 564 (58.1) | 561 (41.9) | 554 (59.7) | 571 (40.3) | 556 (52.8) | 569 (47.2) | 560 (60.7) | 565 (39.3) | 560 (61.8) | 565 (38.2) | ||||||
| ≥ Once a week | 85 (55.6) | 88 (44.4) | 95 (64.6) | 78 (35.4) | 93 (62.0) | 80 (38.0) | 89 (59.1) | 84 (40.9) | 89 (63.1) | 84 (36.9) | ||||||
| Type of water drinking indoor | 0.008 | 0.002 | 0.033 | 0.001 | < 0.001 | |||||||||||
| Water purifier, bottled water, etc. | 466 (60.6) | 430 (39.4) | 488 (65.6) | 408 (34.4) | 452 (56.4) | 444 (43.6) | 481 (65.1) | 415 (34.9) | 489 (67.0) | 407 (33.0) | ||||||
| Underground water, small-scale water-supply system, tap water | 183 (49.6) | 219 (50.4) | 161 (46.1) | 241 (53.9) | 197 (48.0) | 205 (52.0) | 168 (47.6) | 234 (52.4) | 160 (48.1) | 242 (51.9) | ||||||
| Type of water drinking outdoor | < 0.001 | 0.005 | 0.001 | 0.003 | 0.002 | |||||||||||
| Water purifier, bottled water, etc. | 611 (58.7) | 596 (41.3) | 617 (61.4) | 590 (38.6) | 604 (55.1) | 603 (44.9) | 615 (61.5) | 592 (38.5) | 620 (63.3) | 587 (36.7) | ||||||
| Underground water, small-scale water-supply system, tap water | 38 (38.9) | 53 (61.1) | 32 (41.9) | 59 (58.1) | 45 (35.7) | 46 (64.3) | 34 (40.0) | 57 (60.0) | 29 (36.8) | 62 (63.2) | ||||||
| Average ventilation time per day | < 0.001 | 0.039 | 0.001 | 0.019 | 0.012 | |||||||||||
| < 30 min | 72 (46.2) | 102 (53.8) | 78 (55.4) | 96 (44.6) | 76 (43.4) | 98 (56.6) | 72 (53.6) | 102 (46.4) | 76 (51.6) | 98 (48.4) | ||||||
| ≥ 30 min, < 60 min | 81 (66.8) | 75 (33.2) | 78 (67.7) | 78 (32.3) | 77 (57.8) | 79 (42.2) | 80 (66.2) | 76 (33.8) | 76 (63.7) | 80 (36.3) | ||||||
| ≥ 60 min, < 600 min | 240 (53.0) | 248 (47.0) | 240 (57.9) | 248 (42.1) | 242 (51.4) | 246 (48.6) | 239 (57.2) | 249 (42.8) | 234 (59.0) | 254 (41.0) | ||||||
| ≥ 600 min | 256 (63.0) | 224 (37.0) | 253 (62.3) | 227 (33.7) | 254 (58.8) | 226 (41.2) | 258 (63.8) | 222 (36.2) | 263 (67.2) | 217 (32.8) | ||||||
| Usage of hair products | < 0.001 | 0.004 | 0.002 | 0.002 | 0.003 | |||||||||||
| < Once a week | 540 (55.6) | 562 (44.4) | 527 (57.1) | 575 (42.9) | 545 (52.8) | 557 (47.2) | 538 (58.0) | 564 (42.0) | 533 (59.0) | 569 (41.0) | ||||||
| ≥ Once a week | 109 (67.1) | 87 (32.9) | 122 (74.7) | 74 (25.3) | 104 (60.0) | 92 (40.0) | 111 (71.0) | 85 (29.0) | 116 (74.7) | 80 (25.3) | ||||||
| Usage of make-up products | 0.002 | 0.001 | 0.058 | 0.002 | 0.002 | |||||||||||
| < Once a week | 559 (55.7) | 580 (44.3) | 564 (59.3) | 575 (40.7) | 571 (53.7) | 568 (46.3) | 558 (58.6) | 581 (41.4) | 565 (60.1) | 574 (39.9) | ||||||
| ≥ Once a week | 90 (71.6) | 69 (28.4) | 85 (68.0) | 74 (32.0) | 78 (57.2) | 81 (42.8) | 91 (73.4) | 68 (26.6) | 84 (75.0) | 75 (25.0) | ||||||
| Usage of ultraviolet block sunscreens | 0.007 | 0.009 | 0.008 | 0.011 | 0.001 | |||||||||||
| < Once a week | 536 (55.6) | 550 (44.4) | 541 (58.9) | 545 (41.1) | 538 (52.6) | 548 (47.4) | 537 (59.1) | 549 (40.9) | 541 (59.7) | 545 (40.3) | ||||||
| ≥ Once a week | 113 (67.5) | 99 (32.5) | 108 (67.7) | 104 (32.3) | 111 (61.3) | 101 (38.7) | 112 (66.9) | 100 (33.1) | 108 (72.5) | 104 (27.5) | ||||||
| Variable | PFOA | PFOS | PFHxS | PFNA | PFDeA | |||||||||||
|---|---|---|---|---|---|---|---|---|---|---|---|---|---|---|---|---|
| Low (n = 848)a | High (n = 847) | Low (n = 848) | High (n = 847) | Low (n = 848)a | High (n = 847) | Low (n = 850) | High (n = 845) | Low (n = 848) | High (n = 847) | |||||||
| Age | 41.0 ± 0.21 | 58.2 ± 0.13 | < 0.001b | 40.4 ± 0.05 | 59.7 ± 0.06 | < 0.001 | 42.0 ± 0.16 | 56.1 ± 0.37 | < 0.001b | 40.7 ± 0.18 | 60.1 ± 0.04 | < 0.001 | 41.5 ± 0.23 | 58.8 ± 0.10 | < 0.001 | |
| BMI group | 0.002c | < 0.001 | 0.009c | < 0.001 | < 0.001 | |||||||||||
| ≤ 25 kg/m2 | 534 (61.6) | 448 (38.4) | 542 (63.8) | 440 (36.2) | 525 (59.4) | 457 (40.6) | 559 (66.6) | 423 (33.4) | 535 (64.1) | 447 (35.9) | ||||||
| > 25 kg/m2 | 314 (49.1) | 399 (50.9) | 306 (49.3) | 407 (50.7) | 323 (46.2) | 390 (53.8) | 291 (50.1) | 422 (49.9) | 313 (52.4) | 400 (47.6) | ||||||
| Marital status | < 0.001 | < 0.001 | 0.001 | < 0.001 | < 0.001 | |||||||||||
| Single | 150 (85.7) | 28 (14.3) | 154 (86.3) | 24 (13.7) | 142 (81.3) | 36 (18.7) | 162 (91.9) | 16 (8.1) | 159 (89.0) | 19 (11.0) | ||||||
| Married | 610 (53.9) | 641 (46.1) | 615 (56.1) | 636 (43.9) | 620 (51.3) | 631 (48.7) | 617 (57.9) | 634 (42.1) | 612 (56.9) | 639 (43.1) | ||||||
| Others | 88 (30.4) | 178 (69.6) | 79 (29.6) | 187 (70.4) | 86 (31.0) | 180 (69.0) | 71 (27.7) | 195 (72.3) | 77 (31.9) | 189 (68.1) | ||||||
| Smoking | < 0.001 | < 0.001 | 0.025 | < 0.001 | < 0.001 | |||||||||||
| None or ex-smoker | 818 (56.0) | 830 (44.0) | 816 (57.6) | 832 (42.4) | 824 (54.0) | 824 (46.0) | 820 (59.5) | 828 (40.5) | 820 (59.0) | 828 (41.0) | ||||||
| Current smoker | 30 (78.2) | 17 (21.8) | 32 (74.9) | 15 (25.1) | 24 (61.3) | 23 (38.7) | 30 (78.9) | 17 (21.1) | 28 (74.9) | 19 (25.1) | ||||||
| Coated frying pans usage | 0.285 | 0.125 | 0.018 | 0.002 | 0.003 | |||||||||||
| < Once a week | 43 (57.0) | 60 (43.0) | 45 (60.8) | 58 (39.2) | 51 (58.2) | 52 (41.8) | 36 (50.9) | 67 (49.1) | 37 (51.9) | 66 (48.1) | ||||||
| ≥ Once a week | 805 (56.6) | 787 (43.4) | 803 (58.0) | 789 (42.0) | 797 (54.0) | 765 (46.0) | 814 (60.6) | 778 (39.4) | 811 (59.9) | 781 (40.1) | ||||||
| Coated pot usage | 0.134 | 0.081 | 0.004 | 0.132 | 0.063 | |||||||||||
| < Once a week | 337 (55.4) | 370 (44.6) | 338 (56.4) | 369 (43.6) | 362 (56.0) | 345 (44.0) | 339 (58.4) | 368 (41.6) | 331 (57.3) | 376 (42.7) | ||||||
| ≥ Once a week | 511 (57.6) | 477 (42.4) | 510 (59.4) | 478 (40.6) | 486 (52.9) | 502 (47.1) | 511 (61.4) | 477 (38.6) | 517 (61.2) | 471 (38.8) | ||||||
| Coated electric cookers usage | 0.002 | 0.752 | 0.358 | 0.085 | 0.007 | |||||||||||
| < Once a week | 108 (54.7) | 130 (45.3) | 113 (58.2) | 125 (41.8) | 112 (53.3) | 126 (46.7) | 115 (59.4) | 123 (40.6) | 122 (64.1) | 116 (35.9) | ||||||
| ≥ Once a week | 740 (57.0) | 717 (43.0) | 735 (58.1) | 722 (41.9) | 736 (54.3) | 721 (45.7) | 735 (60.2) | 722 (39.8) | 726 (58.8) | 731 (41.2) | ||||||
| Coated containers usage | 0.009 | 0.013 | 0.035 | 0.005 | 0.012 | |||||||||||
| < Once a week | 713 (55.4) | 755 (44.6) | 710 (56.8) | 758 (43.2) | 723 (53.2) | 745 (46.8) | 703 (58.5) | 765 (41.5) | 703 (58.1) | 765 (41.9) | ||||||
| ≥ Once a week | 135 (64.9) | 92 (35.1) | 138 (66.6) | 89 (33.4) | 125 (60.4) | 102 (39.6) | 147 (70.4) | 80 (29.6) | 145 (69.0) | 82 (31.0) | ||||||
| Hiking suit usage | 0.006 | 0.001 | 0.009 | < 0.001 | 0.002 | |||||||||||
| < Once a week | 617 (60.5) | 555 (39.5) | 615 (62.8) | 557 (37.2) | 605 (57.6) | 567 (42.4) | 619 (63.3) | 553 (36.7) | 615 (62.7) | 557 (37.3) | ||||||
| ≥ Once a week | 231 (47.8) | 292 (52.2) | 233 (47.3) | 290 (52.7) | 243 (46.3) | 280 (53.7) | 231 (52.7) | 292 (47.3) | 233 (52.0) | 290 (48.0) | ||||||
| Hiking boots and sneakers usage | 0.011 | 0.038 | 0.030 | 0.008 | 0.001 | |||||||||||
| < Once a week | 590 (57.9) | 574 (42.1) | 589 (59.1) | 575 (40.9) | 576 (55.0) | 588 (45.0) | 602 (61.8) | 562 (38.2) | 603 (61.4) | 561 (38.6) | ||||||
| ≥ Once a week | 258 (53.9) | 273 (46.1) | 259 (55.9) | 272 (44.1) | 272 (52.4) | 259 (47.6) | 248 (56.4) | 283 (43.6) | 245 (55.2) | 286 (44.8) | ||||||
| Disposable paper cups usage | 0.002 | < 0.001 | 0.483 | 0.007 | 0.026 | |||||||||||
| < Once a week | 415 (54.6) | 452 (45.4) | 398 (53.5) | 469 (46.5) | 427 (54.0) | 440 (46.0) | 395 (56.6) | 472 (43.4) | 405 (57.4) | 462 (42.6) | ||||||
| ≥ Once a week | 433 (58.9) | 395 (41.1) | 450 (63.1) | 378 (36.9) | 421 (54.4) | 407 (45.6) | 455 (63.9) | 373 (36.1) | 443 (61.7) | 385 (38.3) | ||||||
| Coated agent or polish usage | < 0.001 | < 0.001 | 0.001 | < 0.001 | < 0.001 | |||||||||||
| < Once a week | 846 (56.8) | 844 (43.2) | 845 (58.2) | 845 (41.8) | 846 (54.3) | 844 (45.7) | 848 (60.3) | 842 (39.7) | 846 (59.7) | 844 (40.3) | ||||||
| ≥ Once a week | 2 (18.0) | 3 (82.0) | 3 (38.0) | 2 (62.0) | 2 (18.0) | 3 (82.0) | 2 (18.0) | 3 (82.0) | 2 (18.0) | 3 (82.0) | ||||||
| Consumption of grilled meat | < 0.001 | < 0.001 | 0.005 | < 0.001 | < 0.001 | |||||||||||
| < Once a week | 484 (52.2) | 599 (47.8) | 478 (52.6) | 605 (47.4) | 501 (49.6) | 582 (50.4) | 471 (53.5) | 612 (46.5) | 483 (52.8) | 600 (47.2) | ||||||
| ≥ Once a week | 364 (63.3) | 248 (36.7) | 370 (66.3) | 242 (33.7) | 347 (61.0) | 265 (39.0) | 379 (70.1) | 233 (29.9) | 365 (69.5) | 247 (30.5) | ||||||
| Consumption of grilled fish | 0.002 | 0.002 | 0.222 | 0.003 | < 0.001 | |||||||||||
| < Once a week | 704 (58.0) | 654 (42.0) | 712 (60.0) | 646 (40.0) | 679 (54.5) | 679 (45.5) | 716 (61.4) | 642 (38.6) | 714 (61.4) | 644 (38.6) | ||||||
| ≥ Once a week | 144 (50.6) | 193 (49.4) | 136 (49.9) | 201 (50.1) | 169 (52.8) | 168 (47.2) | 134 (54.7) | 203 (45.3) | 134 (51.4) | 203 (48.6) | ||||||
| Consumption of popcorn | 0.007 | 0.046 | 0.313 | 0.010 | 0.010 | |||||||||||
| < Once a week | 840 (56.4) | 845 (43.6) | 839 (57.9) | 846 (42.1) | 841 (54.1) | 844 (45.9) | 842 (59.9) | 843 (40.1) | 840 (59.3) | 845 (40.7) | ||||||
| ≥ Once a week | 8 (87.9) | 2 (12.1) | 9 (92.3) | 1 (7.7) | 7 (67.8) | 3 (32.2) | 8 (87.9) | 2 (12.1) | 8 (87.9) | 2 (12.1) | ||||||
| Consumption of hamburger-pizza-fried chicken | 0.002 | < 0.001 | 0.004 | < 0.001 | 0.002 | |||||||||||
| < Once a week | 673 (51.9) | 801 (48.1) | 670 (53.0) | 804 (47.0) | 700 (51.5) | 774 (48.5) | 664 (55.0) | 810 (45.0) | 668 (54.3) | 806 (45.7) | ||||||
| ≥ Once a week | 175 (80.5) | 46 (19.5) | 178 (83.7) | 43 (16.3) | 148 (67.9) | 73 (32.1) | 186 (86.1) | 35 (13.9) | 180 (85.9) | 41 (14.1) | ||||||
| Consumption of large fish and tuna | 0.006 | < 0.001 | 0.006 | < 0.001 | 0.004 | |||||||||||
| < Once a week | 747 (55.1) | 805 (44.9) | 745 (56.4) | 807 (43.6) | 754 (53.1) | 798 (46.9) | 750 (58.8) | 802 (41.2) | 749 (58.1) | 803 (41.9) | ||||||
| ≥ Once a week | 101 (73.9) | 42 (26.1) | 103 (76.9) | 40 (23.1) | 94 (65.9) | 49 (34.1) | 100 (74.5) | 43 (25.5) | 99 (75.3) | 44 (24.7) | ||||||
| Consumption of fish | 0.002 | 0.002 | < 0.001 | 0.001 | 0.003 | |||||||||||
| < Once a week | 486 (66.0) | 311 (34.0) | 490 (67.7) | 307 (32.3) | 442 (60.1) | 355 (39.9) | 501 (69.6) | 296 (30.4) | 501 (68.8) | 296 (31.2) | ||||||
| ≥ Once a week | 362 (46.9) | 536 (53.1) | 358 (48.2) | 540 (51.8) | 406 (48.1) | 492 (51.9) | 349 (50.3) | 549 (49.7) | 347 (49.9) | 551 (50.1) | ||||||
| Consumption of crustacean | 0.050 | 0.032 | 0.141 | 0.006 | 0.001 | |||||||||||
| < Once a week | 792 (57.0) | 772 (43.0) | 783 (58.2) | 781 (41.8) | 793 (54.8) | 771 (45.2) | 793 (60.6) | 771 (39.4) | 793 (59.9) | 771 (40.1) | ||||||
| ≥ Once a week | 56 (53.2) | 75 (46.8) | 65 (57.5) | 66 (42.5) | 55 (46.8) | 76 (53.2) | 57 (54.7) | 74 (45.3) | 55 (55.7) | 76 (44.3) | ||||||
| Consumption of seaweed | < 0.001 | 0.022 | 0.003 | 0.014 | 0.083 | |||||||||||
| < Once a week | 232 (62.5) | 181 (37.5) | 213 (61.2) | 200 (38.8) | 220 (61.3) | 193 (38.7) | 231 (65.8) | 182 (34.2) | 221 (62.0) | 192 (38.0) | ||||||
| ≥ Once a week | 616 (54.8) | 666 (45.2) | 635 (57.1) | 647 (42.9) | 628 (51.9) | 654 (48.1) | 619 (58.3) | 663 (41.7) | 627 (58.7) | 655 (41.3) | ||||||
| Consumption of shellfish | 0.005 | < 0.001 | 0.004 | 0.001 | < 0.001 | |||||||||||
| < Once a week | 772 (59.4) | 707 (40.6) | 764 (60.1) | 715 (39.9) | 762 (56.6) | 717 (43.4) | 780 (63.3) | 699 (36.7) | 783 (63.1) | 696 (36.9) | ||||||
| ≥ Once a week | 76 (39.2) | 140 (60.8) | 84 (45.5) | 132 (54.5) | 86 (38.6) | 130 (61.4) | 70 (39.8) | 146 (60.2) | 65 (36.5) | 151 (63.5) | ||||||
| Consumption of other seafood items | 0.047 | 0.059 | 0.353 | 0.115 | 0.844 | |||||||||||
| < Once a week | 747 (56.1) | 762 (43.9) | 751 (57.7) | 758 (42.3) | 758 (54.1) | 751 (45.9) | 757 (60.3) | 752 (39.7) | 758 (59.5) | 751 (40.5) | ||||||
| ≥ Once a week | 101 (61.0) | 85 (39.0) | 97 (61.2) | 89 (38.8) | 90 (55.1) | 96 (44.9) | 93 (58.8) | 93 (41.2) | 90 (59.4) | 96 (40.6) | ||||||
| Type of water drinking indoor | 0.004 | 0.008 | < 0.001 | 0.004 | 0.007 | |||||||||||
| Water purifier, bottled water, etc. | 624 (60.9) | 527 (39.1) | 631 (62.2) | 520 (37.8) | 602 (59.0) | 549 (41.0) | 647 (65.6) | 504 (34.4) | 626 (63.9) | 525 (36.1) | ||||||
| Underground water, small-scale water-supply system, tap water | 224 (46.9) | 320 (53.1) | 217 (48.8) | 327 (51.2) | 246 (43.2) | 298 (56.8) | 203 (47.8) | 341 (52.2) | 222 (49.7) | 322 (50.3) | ||||||
| Type of water drinking outdoor | < 0.001 | 0.003 | < 0.001 | < 0.001 | < 0.001 | |||||||||||
| Water purifier, bottled water, etc. | 794 (58.9) | 746 (41.1) | 800 (60.4) | 740 (39.6) | 782 (56.1) | 758 (43.9) | 808 (62.8) | 732 (37.2) | 800 (62.0) | 740 (38.0) | ||||||
| Underground water, small-scale water-supply system, tap water | 54 (32.6) | 101 (67.4) | 48 (33.9) | 107 (66.1) | 66 (34.0) | 89 (66.0) | 42 (31.1) | 113 (68.9) | 48 (33.3) | 107 (66.7) | ||||||
| Average ventilation time per day | 0.012 | 0.067 | 0.003 | 0.017 | 0.013 | |||||||||||
| < 30 min | 82 (44.4) | 98 (55.6) | 88 (52.5) | 92 (47.5) | 80 (43.1) | 100 (56.9) | 80 (47.0) | 100 (53.0) | 80 (47.0) | 100 (53.0) | ||||||
| ≥ 30 min, < 60 min | 94 (54.8) | 121 (45.2) | 101 (56.4) | 114 (43.6) | 96 (50.2) | 119 (49.8) | 101 (61.4) | 114 (38.6) | 98 (56.4) | 117 (43.6) | ||||||
| ≥ 60 min, < 600 min | 314 (55.9) | 310 (44.1) | 301 (57.1) | 323 (42.9) | 316 (51.8) | 308 (40.2) | 299 (56.9) | 325 (43.1) | 300 (56.5) | 324 (43.5) | ||||||
| ≥ 600 min | 358 (60.5) | 318 (39.5) | 358 (60.6) | 318 (39.4) | 356 (59.7) | 320 (40.3) | 370 (65.4) | 306 (34.6) | 370 (65.6) | 306 (34.4) | ||||||
| Usage of hair products | 0.011 | 0.519 | 0.011 | 0.490 | 0.241 | |||||||||||
| < Once a week | 468 (57.9) | 449 (42.1) | 455 (58.4) | 462 (41.6) | 466 (55.5) | 451 (44.5) | 462 (59.9) | 455 (40.1) | 460 (59.2) | 457 (40.8) | ||||||
| ≥ Once a week | 380 (55.2) | 398 (44.8) | 393 (57.7) | 385 (42.3) | 382 (52.6) | 396 (47.4) | 388 (60.4) | 390 (39.6) | 388 (60.0) | 390 (40.0) | ||||||
| Usage of make-up products | 0.388 | < 0.001 | 0.001 | 0.005 | 0.006 | |||||||||||
| < Once a week | 130 (57.2) | 130 (42.8) | 112 (52.2) | 148 (47.8) | 123 (47.9) | 137 (52.1) | 117 (54.1) | 143 (45.9) | 122 (54.1) | 138 (45.9) | ||||||
| ≥ Once a week | 718 (56.6) | 717 (43.4) | 736 (59.1) | 699 (40.9) | 725 (55.2) | 710 (44.8) | 733 (61.1) | 702 (38.9) | 726 (60.4) | 709 (39.6) | ||||||
| Usage of ultraviolet block sunscreens | 0.067 | 0.001 | 0.006 | 0.031 | 0.060 | |||||||||||
| < Once a week | 157 (54.3) | 162 (45.7) | 140 (50.9) | 179 (49.1) | 161 (49.9) | 158 (50.1) | 143 (54.5) | 176 (45.5) | 156 (55.5) | 163 (44.5) | ||||||
| ≥ Once a week | 691 (57.1) | 685 (42.9) | 708 (59.5) | 668 (40.5) | 687 (55.0) | 689 (45.0) | 707 (61.2) | 669 (38.8) | 692 (60.3) | 684 (39.7) | ||||||
| Category | Men | Women | ||||||
|---|---|---|---|---|---|---|---|---|
| Unadjusted | Adjusteda | Unadjusted | Adjusteda | |||||
| < Once a week | ≥ Once a week | < Once a week | ≥ Once a week | < Once a week | ≥ Once a week | < Once a week | ≥ Once a week | |
| PFOA | 1 | 2.38 (1.80–3.15) | 1 | 1.57 (0.85–2.90) | 1 | 1.16 (1.00–1.35) | 1 | 1.48 (1.19–1.84) |
| PFOS | 1 | 1.43 (1.24–1.64) | 1 | 0.94 (0.71–1.25) | 1 | 1.02 (1.01–1.04) | 1 | 1.39 (1.27–1.52) |
| PFHxS | 1 | 2.25 (2.16–2.35) | 1 | 2.15 (1.53–3.02) | 1 | 1.38 (0.76–2.49) | 1 | 1.56 (0.68–3.57) |
| PFNA | 1 | 2.08 (1.98–2.18) | 1 | 1.23 (1.07–1.41) | 1 | 1.27 (1.17–1.37) | 1 | 1.70 (1.29–2.26) |
| PFDeA | 1 | 2.05 (1.98–2.12) | 1 | 1.42 (1.17–1.74) | 1 | 1.18 (1.15–1.21) | 1 | 1.43 (1.32–1.54) |
Table 1 Baseline characteristics of the participants
Data are presented as mean (95% confidence interval), number (%) for categorical variables and as mean ± standard error for continuous variables.
PFAS: perfluoroalkyl substances; PFOA: perfluorooctanoic acid; PFOS: perfluorooctanesulfonic acid; PFHxS: perfluorohexanesulfonic acid; PFNA: perfluorononanoic acid; PFDeA: perfluorodecanoic acid; BMI: body mass index.
aUnweighted count; b
Table 2 Baseline characteristics of the men according to serum perfluoroalkyl substances: PFOA, PFOS, PFHxS, PFNA, PFDeA
Data are presented as number (%) for categorical variables and as mean ± standard error for continuous variables
PFOA: perfluorooctanoic acid; PFOS: perfluorooctanesulfonic acid; PFHxS: perfluorohexanesulfonic acid; PFNA: perfluorononanoic acid; PFDeA: perfluorodecanoic acid; BMI: body mass index
aUnweighted count; b
Table 3 Baseline characteristics of the women according to serum perfluoroalkyl substances: PFOA, PFOS, PFHxS, PFNA, PFDeA
Data are presented as number (%) for categorical variables and as mean ± standard error for continuous variables.
PFOA: perfluorooctanoic acid; PFOS: perfluorooctanesulfonic acid; PFHxS: perfluorohexanesulfonic acid; PFNA: perfluorononanoic acid; PFDeA: perfluorodecanoic acid; BMI: body mass index.
aUnweighted count; b
Table 4 Adjusted ORs and 95% CIs of crustacean consumption with high concentrations of serum PFAS
OR: odds ratio; CI: confidence interval; PFAS: perfluoroalkyl substances; PFOA: perfluorooctanoic acid; PFOS: perfluorooctanesulfonic acid; PFHxS: perfluorohexanesulfonic acid; PFNA: perfluorononanoic acid; PFDeA: perfluorodecanoic acid.
aAdjusted for age, body mass index, marital status, smoking, number of coated frying pans usage, number of coated pot usage, number of electric cookers usage, number of coated containers usage, number of hiking suit usage, number of hiking boots and sneakers usage, number of disposable paper cups usage, number of coated agent or polish usage, number of consumption of grilled meat, grilled fish, popcorn, hamburger-pizza-fried chicken, large fish and tuna, fish, crustacean, seaweed, shellfish, other seafood items, type of water drinking indoor, type of water drinking outdoor, average ventilation time per day, usage of hair products, usage of make-up products, usage of ultraviolet block sunscreens.

