
Articles
- Page Path
- HOME > Ann Occup Environ Med > Volume 35; 2023 > Article
- Original Article The association of perfluoroalkyl substances (PFAS) exposure and kidney function in Korean adolescents using data from Korean National Environmental Health Survey (KoNEHS) cycle 4 (2018–2020): a cross-sectional study
-
Jisuk Yun
 , Eun-Chul Jang, Soon-Chan Kwon, Young-Sun Min, Yong-Jin Lee
 -
Annals of Occupational and Environmental Medicine 2023;35:e5.
DOI: https://doi.org/10.35371/aoem.2023.35.e5
Published online: March 15, 2023
Department of Occupational and Environmental Medicine, Soonchunhyang University Cheonan Hospital, Cheonan, Korea.
- Correspondence: Yong-Jin Lee. Department of Occupational and Environmental Medicine, Soonchunhyang University Cheonan Hospital, 31 Suncheonhyang 6-gil, Dongnam-gu, Cheonan 31151, Korea. regina94@schmc.ac.kr
• Received: November 28, 2022 • Revised: January 24, 2023 • Accepted: February 9, 2023
Copyright © 2023 Korean Society of Occupational & Environmental Medicine
This is an Open Access article distributed under the terms of the Creative Commons Attribution Non-Commercial License (https://creativecommons.org/licenses/by-nc/4.0/) which permits unrestricted non-commercial use, distribution, and reproduction in any medium, provided the original work is properly cited.
Abstract
-
Background Perfluoroalkyl substances (PFAS) are chemicals widely used in various products in everyday life. Due to its unique strong binding force, the half-life of PFAS is very long, so bioaccumulation and toxicity to the human body are long-standing concerns. In particular, effects on kidney function have recently emerged and there are no studies on the effect of PFAS on kidney function through epidemiological investigations in Korea. From 2018 to 2020, the Korean National Environmental Health Survey (KoNEHS) cycle 4, conducted an epidemiological investigation on the blood concentration of PFAS for the first time in Korea. Based on this data, the relationship between PFAS blood concentration and kidney function was analyzed for adolescents.
-
Methods We investigated 5 types of PFAS and their total blood concentration in 811 middle and high school students, living in Korea and included in KoNEHS cycle 4, and tried to find changes in kidney function in relation to PFAS concentration. After dividing the concentration of each of the 5 PFAS and the total concentration into quartiles, multivariable linear regression was performed to assess the correlation with kidney function. The bedside Schwartz equation was used as an indicator of kidney function.
-
Results As a result of multivariable linear regression, when observing a change in kidney function according to the increase in the concentration of each of the 5 PFAS and their total, a significant decrease in kidney function was confirmed in some or all quartiles.
-
Conclusions In this cross-sectional study of Korean adolescents based on KoNEHS data, a negative correlation between serum PFAS concentration and kidney function was found. A well-designed longitudinal study and continuous follow-up are necessary.
BACKGROUND
Due to the development of civilization, we are using various chemicals for the convenience of daily life, and the amount and frequency of exposure to chemicals is proportionally increasing. Among the many chemicals, perfluoroalkyls, a group of synthetic fluorine-containing chemicals, the so-called “forever chemicals”, have been widely used for diverse applications. Due to special hydrophobic and oleophobic properties, perfluoroalkyl substances (PFAS) can generally be found in consumer products such as disposable food packaging, cookware, outdoor gear, furniture, and carpet.1,2 PFAS have a well-documented long half-life and do not readily decompose due to the presence of a unique, strong carbon-fluorine bond, which in turn creates large problems due to bioaccumulation.3 In Korea, various types and concentrations of PFAS are detected in rivers and sediments,4 and PFAS are continuously detected, even in purified tap water.5,6
Overseas literature has continuously suggested the negative effects of PFAS on the human body through various animal experiments as well as epidemiological studies,7 and recently, PFAS have emerged as a threat to kidney health,8,9 especially focusing on the effects on kidney function.9 It is widely known that PFAS induces the production of reactive oxidative species (ROS), which has a toxic effect on the kidneys, decreasing kidney function.10,11 The risks of PFAS have increased steadily over time. The Stockholm Convention specifically noted that these substances could have toxic effects on health, such as immunotoxicity, developmental toxicity, and reproductive toxicity, by bioaccumulation over a long period of time. Therefore, perfluorooctansulfonate (PFOS) and perfluorooctanoic acid (PFOA) were listed as persistent organic pollutants in 2009 and 2019, respectively, and many countries control their production and use in various ways.12 However, PFAS are still detectable globally in the bio-specimens of humans due to their unique persistence and bioaccumulation.13 The National Health and Nutrition Examination Survey (NHANES) which is an annual national survey conducted in the United States has been measuring blood PFAS concentrations since 1999, and it was reported that PFAS was detected in the blood of more than 98 percent of the population.14
As a result of continuous warnings about the negative effects on the human body, regulations on production and use have continued, and thanks to this, the concentration of PFAS in the blood has decreased significantly during NHANES follow-up over the past 20 years.15 Recently, in Korea, the Ministry of Environment and the National Institute of Environmental Research conducted the Korean National Environmental Health Survey (KoNEHS) cycle 4, from 2018 to 2020. The 4th KoNEHS conducted from 2018 to 2020 is the first national health survey conducted in Korea that includes data on the blood concentration of PFAS. Five types of PFAS were investigated; PFOA, PFOS, perfluorohexanesulfonic acid (PFHxS), perfluorononanoic acid (PFNA), and perfluorodecanoic acid (PFDeA), respectively. It is the first population-based epidemiological survey of PFAS in Korea, and to our knowledge, no other study has investigated the blood concentration of PFAS and their association with the kidneys based on Korean raw data. This study was designed from this perspective. We targeted the pediatric population, in the 4th cycle KoNEHS data to better understand the effect on kidney function. Children are generally known to be more vulnerable to toxicity due to their relatively low weight and immature metabolic pathways compared to adults.16 Based on this data, the relationship between blood PFAS concentration and kidney function in middle and high school students residing in Korea was analyzed.
METHODS
This study is a secondary analysis study based on the 4th KoNEHS raw data collected by the National Institute of Environmental Research from 2018 to 2020. The 4th KoNEHS used a sampling method to present representative results for all middle and high school students living in Korea, with an age distribution between 12 and 17 years, and 67 middle and high schools were selected as sampling institutions. Guidelines were given to the person in charge of at the sampling institution to avoid selecting a specific target. The person in charge used the guidelines to select an appropriate number of students of different ages and sexes. The 4th KoNEHS survey consists of a survey on environmental exposure, clinical tests (21 types including a general clinical examination), and evaluation of exposure levels in the body to harmful substances in the environment (33 types including heavy metals). Biological samples were collected by medical institutions (hospitals, clinics, etc.) located adjacent to educational institutions, and medical staff took bodily measurements such as blood pressure, and collected biological samples (blood and urine) for analysis. Afterwards, a field survey team visited a sample education institution, reconfirmed the identity of the participants, collected the biological samples for transport, and surveyed the questionnaire through a one-on-one interview method. Finally, if a value was missing among the variables of a study subject, the subject was excluded from the study.
Several clinical laboratory tests are useful in investigating and evaluating kidney function. Clinically, the most practical test to assess kidney function is to estimate glomerular filtration rate (eGFR) and to check for proteinuria (albuminuria).17,18 However, since the subjects of this study were not tested for urine albumin, eGFR was used as an indicator of kidney function. eGFR applied the Creatine-based Bedside Schwartz equation (2009) formula, which is useful for measuring eGFR in children, based on guidelines from the National Kidney Foundation.19 The eGFR is obtained using serum creatinine concentration and height, the formula is as follows: eGFRCr (mL/min/1.73 m2) = 0.413 × Height (cm) ÷ SCr (mg/dL). Serum creatinine was measured using the Jaffe reaction method. Serum creatinine was analyzed by an ADVIA 1800 Auto Analyzer (Siemens Medical Solutions Diagnostics, Los Angeles, CA, USA).
There are more than 14,000 PFAS known to date.20 The compounds subject to this study are PFOA, PFOS, PFHxS, PFNA, and PFDeA which are the most widely known PFAS. The 5 types of compounds were detected using a high-performance liquid chromatograph/mass spectrometer of Q-Sight Triple Quad (Perkin-Elmer, Waltham. MA, USA). As for the reporting the limit of detection (LOD) of PFAS in serum in accordance with this test method, PFOA was 0.050 μg/L, PFOS was 0.056 μg/L, PFHxS was 0.071 μg/L, PFNA was 0.019 μg/L, and PFDeA was 0.017 μg/L. Serum PFAS concentrations were measured in this way and the results are presented. We also observed changes in serum PFAS concentrations in adolescents in the United States based on the public data released by the NHANES and compared it with the results of KoNEHS cycle 4.
We included age, sex, body mass index (BMI), household income, blood pressure, diabetes, total cholesterol, and urinary cotinine, which are widely known to affect kidney function,21 as potential confounders to analyze the association between blood PFAS concentration and kidney function. The study subjects ranged from 12 to 17 years old, and age was used as an ordinal variable in statistical analysis. The BMI (kg/m2) was classified as less than 18.5 kg/m2, 18.5 kg/m2 to less than 25 kg/m2, and 25 kg/m2 or more. Household income was surveyed through a prepared questionnaire, and over the past year, the average monthly income was categorized into 7 categories: less than 1 million won (803 dollars), 1 million won (803 dollars) to less than 2 million won (1,606 dollars), 2 million won (1,606 dollars) to less than 3 million won (2,409 dollars), 3 million won (2,409 dollars) to less than 5 million won (4,014 dollars), 5 million won (4,014 dollars) to less than 7 million won (5,620 dollars), over 7 million won (5,620 dollars), and unknown. According to the clinical practice guidelines of the American Academy of Pediatrics in 2017, stage 2 hypertension is defined as a systolic blood pressure higher than 140 mmHg or a diastolic blood pressure higher than 90 mmHg.22 In this study, ‘abnormal blood pressure’ was defined as any subject with stage 2 hypertension or currently taking anti-hypertensive drugs. Blood pressure not falling into this category was considered as ‘normal.’ No subject in this study were classified as having diabetes or taking anti-diabetic drugs through a preliminary questionnaire. However, according to the Korean Diabetes Association 2021 guidelines, if hemoglobin A1c (HbA1c) was 6.5% or higher, it was treated as diabetes.23 Since exposure to tobacco smoke is thought to be a risk factor for kidney disease in adolescents, urinary cotinine was also included in the analyses.24 Urinary cotinine was detected using a gas chromatograph/mass spectrometer of Clarus 600T (Perkin-Elmer). The LOD of urinary cotinine by this test method was 0.2 μg/L. Cotinine concentrations were categorized into tertiles.25 Total cholesterol was considered as a potential covariate as a lowering cholesterol has been shown to reduce the rate of kidney function loss.26 Total cholesterol was divided into less than 170 mg/dL and more than 170 mg/dL, the starting point of being classified as borderline according to the 2017 Clinical Practice Guidelines for Dyslipidemia of Korean Children and Adolescents.27
The numbers and percentages of the general characteristics of the study subjects were investigated. In addition, the average eGFR and 95% confidence interval (CI) according to general characteristics were shown, and the average eGFR difference was statistically verified through a t-test and analysis of variance. Multivariable linear regression was used to analyze the relationship between serum PFAS concentration and kidney function, and a method of complex sample analysis with weights was applied. The method of calculating and applying the weight is presented in the original publicly available final dataset with the KoNEHS analysis guidelines.28 Since individual PFAS concentrations and the total concentrations were right-skewed, they were transformed into a natural logarithm, and then categorized into quartiles. For each PFAS and its total, the change in eGFR according to the increase in the quartile was shown, and the beta coefficient and 95% CI were presented. Multivariable linear regression was used to analyze the relationship between blood PFAS concentration and kidney function, which was analyzed by adjusting for age, sex, BMI, household income, abnormal blood pressure, diabetes, total cholesterol, and urinary cotinine. Additional stratified analyses were also performed for sex, age, BMI, urinary cotinine, total cholesterol, and abnormal blood pressure.
Statistical analyses were performed using SPSS version 26.0 (IBM Corp., Armonk, NY, USA) program and p-values of less than 0.05 were considered as statistically significant.
The Institutional Review Board (IRB) of Soonchunhyang University Cheonan Hospital approved this study (IRB No. 2022-10-016).
RESULTS
The general characteristics of the subjects of this study are summarized in Table 1. A total of 811 subjects were selected as the final subjects for this study. Exclusions included 578 infants, 736 elementary school students, 4,239 adults aged 19 years or older, and 17 subjects with missing data out of a total of 6,381 in the 4th KoNEHS (2018–2020). Of the total 811 participants, 379 (46.7%) were male and 432 (53.3%) were female. The age of the study participants was 12–17 years, which was relatively evenly distributed. The average monthly household income showed a relatively normal distribution pattern, with the largest number of people, 269 (33.2%), distributed in the range of 3 million won (2,409 dollars) to 5 million won (4,014 dollars) or less. Regarding BMI distribution, 106 participants (13.1%) were in the less than 18.5 kg/m2 group, 540 (66.6%) were in the more than 18.5 kg/m2 and less than 25 kg/m2 group, and 165 (20.3%) were in the more than 25 kg/m2 group. In the HbA1c survey to distinguish diabetes, 808 people (99.6%), the majority of the participants, were non-diabetes. When measuring the total cholesterol, the group below 170 was 598 (73.7%), more than twice as much as the group above 170. In blood pressure measurement, the number of people classified with normal blood pressure was 635 (78.3%), approximately 3 times more than the number of 176 (21.7%) classified with abnormal blood pressure.
Table 1
General characteristics and mean eGFR of the study population
Values are presented as number (%) or mean (95% confidence interval).
BMI: body mass index; eGFR: estimated glomerular filtration rate; HbA1c: hemoglobin A1c.
aThe p-value calculated by t-test or analysis of variance.
bAn exchange rate of 1,245.5 won per dollar was applied.
cAbnormal blood pressure was defined as systolic blood pressure > 140 mmHg, diastolic blood pressure > 90 mmHg, or currently taking anti-hypertensive drugs.
***p < 0.001.
The average eGFR according to the general characteristics of the study subjects is shown in Table 1. The average eGFR of women was higher than that of men, and the result was statistically significant. There was a significant difference in mean eGFR according to age, and approximately, the higher the age, the lower the mean eGFR. There was no statistically significant difference in average eGFR according to household income, concentrations of HbA1c and total cholesterol. The BMI showed a significant difference in the mean eGFR in the 3 groups, and the mean eGFR tended to decrease with increasing BMI. Finally, urinary cotinine and blood pressure also showed a significant difference in the mean eGFR according to classification. Urinary cotinine showed a significantly lower mean eGFR in the high group and blood pressure in the abnormal blood pressure group. Table 2 shows a significant difference in mean eGFR according to the quartile of each variable, and in general, the higher the quartile, the lower the mean eGFR.
Table 2
Mean eGFR according to quartile of PFAS
Values are presented as number or mean (95% confidence interval).
PFAS: perfluoroalkyl substances; PFOA: perfluorooctanoic acid; PFOS: perfluorooctansulfonate; PFHxS: perfluorohexanesulfonic acid; PFNA: perfluorononanoic acid; PFDeA: perfluorodecanoic acid’ eGFR: estimated glomerular filtration rate.
aThe p-value calculated by analysis of variance.
*p < 0.05; **p < 0.01; ***p < 0.001.
To adjust for potential confounders, multivariable linear regression results are presented in Table 3. In the case of total PFAS, which is the mixture of all 5 PFASs, which are the subjects of this study, compared to the reference value, in quartile 2, eGFR decreased by −4.04 (95% CI: −7.45, −0.59), in quartile 3, by −5.13 (95% CI: −7.98, −2.27), and the last in quartile 4, by −5.17 (95% CI: −8.61, −1.73), all statistically significant. PFHxS similarly showed significant eGFR reductions of −3.85 (95% CI: −6.78, −0.93) in quartile 2, −3.63 (95% CI: −6.61, −0.65) in quartile 3, and −5.24 (95% CI: −8.59, −1.88) in quartile 4 based on reference values. PFNA also showed significant eGFR reductions of −3.77 (95% CI: −6.49, −1.05), −3.32 (95% CI: −5.80, −0.83), and −4.20 (95% CI: −7.35, −1.04) compared to the reference value with the increase in quartile. In PFOA and PFOS, a statistically significant decrease in eGFR was shown only in quartile 3 and quartile 4 compared to the reference value. PFOA showed significant eGFR reductions by −3.96 (95% CI: −6.68, −1.23) and −4.16 (95% CI: −7.44, −0.87) in the third and fourth quartiles, respectively, while PFOS showed significant reductions by −3.39 (95% CI: −5.84, −0.94) and −3.13 (95% CI: −5.64, −0.61) respectively. Finally, in PFDeA, only quartile 4 showed a statistically significant reduction in eGFR by −3.79 (95% CI: −6.74, −0.84) based on the reference value. Table 4 in the appendix presents the change in eGFR when the natural logarithm of the serum PFAS concentration increased by 1. Total PFAS and PFOS in model 1 and total PFAS, PFOA, PFOS, and PFDeA in model 2 showed statistically significant decreases in eGFR.
Table 3
Multivariable regression of PFAS with outcome measure of kidney function
Values are presented as mean (95% confidence interval).
PFAS: perfluoroalkyl substances; PFOA: perfluorooctanoic acid; PFOS: perfluorooctansulfonate; PFHxS: perfluorohexanesulfonic acid; PFNA: perfluorononanoic acid; PFDeA: perfluorodecanoic acid; eGFR: estimated glomerular filtration rate.
aAdjusted for sex, age, household income, body mass index, urinary cotinine, hemoglobin A1c, total cholesterol, abnormal blood pressure
*p < 0.05, **p < 0.01, ***p<0.001.
Table 4
Mean change in eGFR (mL/min/1.73 m2) per 1 ln-serum PFAS using multivariable regression
Values are presented as mean (95% confidence interval).
PFAS: perfluoroalkyl substances; PFOA: perfluorooctanoic acid; PFOS: perfluorooctansulfonate; PFHxS: perfluorohexanesulfonic acid; PFNA: perfluorononanoic acid; PFDeA: perfluorodecanoic acid; eGFR: estimated glomerular filtration rate.
aAdjusted for sex and age.
bAdjusted for sex, age, household income, body mass index, urinary cotinine, hemoglobin A1c, total cholesterol and abnormal blood pressure.
*p < 0.05; **p < 0.01.
Table 5 in the appendix presents the change in eGFR when the natural logarithm of the serum PFAS concentration increased by 1 according to confounders. For each confounder, the change in the mean eGFR according to a change in serum PFAS was inconsistent and showed various patterns.
Table 5
Mean change in eGFR (mL/min/1.73 m2) per 1 ln-serum PFAS using multivariable regression according to confounders
Values are presented as mean (95% confidence interval).
PFAS: perfluoroalkyl substances; PFOA: perfluorooctanoic acid; PFOS: perfluorooctansulfonate; PFHxS: perfluorohexanesulfonic acid; PFNA: perfluorononanoic acid; PFDeA: perfluorodecanoic acid; eGFR: estimated glomerular filtration rate; BMI: body mass index.
aAdjusted for sex, age, household income, body mass index, urinary cotinine, hemoglobin A1c, total cholesterol, abnormal blood pressure
bAbnormal blood pressure was defined as systolic blood pressure > 140 mmHg, diastolic blood pressure > 90 mmHg, or currently taking anti-hypertensive drugs.
*p < 0.05; **p < 0.01.
Fig. 1 is a table comparing serum PFAS concentrations in 1999–2000 and the last 4 years based on the NHANES results. As mentioned before, the median serum PFAS concentration decreased steadily since the investigation began, and in particular, PFOS decreased by more than 85% compared to the most recent results.15
Fig. 1

Changes in serum perfluoroalkyl substances concentration of adolescents in 1999–2000 and in the last 4 years in the USA.
PFOA: perfluorooctanoic acid; PFOS: perfluorooctansulfonate; PFHxS: perfluorohexanesulfonic acid; PFNA: perfluorononanoic acid; PFDeA: perfluorodecanoic acid; NHANES: National Health and Nutrition Examination Survey.
Fig. 2 is a table comparing the survey results of KoNEHS (2018–2020) and NHANES (2017–2018). For all compounds, Korean adolescents showed blood concentrations approximately twice as high or more than American adolescents based on median values.
Fig. 2

Comparison of recent study results in Korean and USA adolescents.
PFOA: perfluorooctanoic acid; PFOS: perfluorooctansulfonate; PFHxS: perfluorohexanesulfonic acid; PFNA: perfluorononanoic acid; PFDeA: perfluorodecanoic acid; NHANES: National Health and Nutrition Examination Survey; KoNEHS: Korean National Environmental Health Survey.
DISCUSSION
Through this study representing Korean adolescents, we found that each of the 5 PFAS substances (PFOA, PFOS, PFHxS, PFNA, and PFDeA) and their sum were significantly associated with decreased kidney function. It is very interesting that statistically significant changes in kidney function were observed in quartile 2, which had relatively low concentrations of some PFAS compared to quartile 1. Our findings support other studies that have shown a negative correlation between PFAS and kidney function.29,30,31 However, since this study is a cross-sectional study, attention should be paid to interpretation, and the problem of reverse causation must be considered.
When PFAS reaches the body through various routes (dietary, inhalation, skin, etc.),32 it is distributed to diverse organs such as the liver and kidneys.33,34 Since the main excretion route of PFAS from the body are the kidneys,10 the effect of PFAS on kidney function is important. PFAS is removed from the kidneys through active secretion in the proximal tubule, which is excreted from the blood into urine, and reabsorbed from urine back into the blood, without going through separate biotransformation in the kidneys.35,36,37 In addition, many molecular biological studies have also been reported on organic anion transport proteins that mediate the renal tubular secretion or reabsorption process involved in the renal elimination process of PFAS.36,37,38 The main toxic effects of PFAS on the kidneys are renal hypertrophy and histologic changes due to increased production of ROS,10,11 which change the permeability of microvascular endothelial cells, resulting in decreased kidney function.11
There are many epidemiologic studies suggesting a negative association between PFAS and decreased kidney function.29,30,31 In particular, Watkins et al.30 and Kataria et al.31 are noteworthy. They found that an increase in serum PFAS concentrations was associated with decreased eGFR in a non-adult population. However, since all of these studies are cross-sectional studies, the problem of reverse causation remains. On this issue, Moon,39 by using casual inference in statistics, recently stated that the possibility of reverse causation might be low. Moon also performed cross-sectional studies and used not only the linear regression method used in previous studies but additional methods (the generalized additive model and regression discontinuity model). To study the possibility of reverse causation, he applied these statistical models to reversed independent and dependent variables. He found that when the eGFR decreased below 60 mL/min/1.73 m2, the concentration of each PFAS did not increase but rather decreased.
Blake et al.40 and Lin et al.41 reported that PFAS was associated with a decrease in eGFR through well-designed longitudinal studies. This study can tentatively rule out the possibility of reverse causation from the following points of view. First, because kidney function decreases with age,42 all the study subjects are adolescents with superior kidney function compared to adults. Second, the prevalence and duration of chronic diseases that can affect kidney function is very low compared to adults. Third, there were no patients with congenital or recognized kidney disease through a preliminary questionnaire.
This study has great significance as basic data in determining public health policy in the future from a long-term perspective. In the United States, a survey of blood PFAS concentrations began in 1999, and Fig. 1 shows traces in blood the results of the initial survey and the last 4 years from the NHANES. Overall, from 1999–2000 to the latest study in 2017–2018, PFOA, PFOS, and PFHxS decreased significantly, but PFNA and PFDeA showed no significant change. Since PFAS were classified as persistent organic pollutants according to the Stockholm Convention on Persistent Organic Pollutants, their use and production are restricted in Korea. However, due to the long half-life and bioaccumulation of residual PFAS in nature, exposure is unavoidable.4,5,6,43 In addition to PFOA and PFOS, which have been studied the most among PFAS, the exposure of other substitutes, for which there are no restrictions on use, should be noted.44 According to the 2021 Environmental Movement Federation investigation, as a result of investigating 20 types of cosmetics sold in the country, more than one type of PFAS was detected in 10 products, and up to 5 types, with a maximum concentration of 105.50 ng/g.45 The blood concentration of PFAS in adolescents in the KoNEHS survey conducted from 2018 to 2020 was approximately twice as high or more in all 5 PFAS based on median values compared to the 2017 to 2018 NHANES (Fig. 2). Even if kidney function is normal during adolescence, a history of kidney damage during that period is associated with an increased risk of chronic kidney disease in the long term.46 Therefore, considering the persistency, bioaccumulation, toxicity and wide distribution of PFAS in wildlife, it is easy to infer that exposure to PFAS in adolescence may have far greater long-term adverse effects than in adults.
This study has the following limitations. First, since the urine albumin concentration was excluded in this study, only eGFR was used as an index of kidney function. If the albumin-to-creatinine ratio, another index of kidney function, could be investigated, more diverse results could be obtained. Second, since the bedside Schwartz equation was originally created to estimate eGFR in children with CKD, it might be inaccurate in a healthy population, as in this study.47 Third, there were many practical limitations. Because it was an epidemiological study, guidelines for measuring blood pressure were not well applied, and many other factors were not considered when diagnosing diabetes due to the lack of diversity in clinical blood tests. In addition, the failure to consider other risk factors that may affect kidney function, such as heart (cardiovascular) disease, a family history of kidney disease, and the frequent use of medications that can damage the kidneys, is clear limitations of using secondary data. Fourth, more diverse statistical methods, such as the relative potency factor approach, could be used to analyze the relationship between serum PFAS concentration and kidney function. Finally, due to the inherent limitations of cross-sectional studies, care must be taken in interpretation, and the direction of the relationship between serum PFAS concentration and decreased kidney function is unclear.
Nevertheless, this study has the following strengths. For the first time in Korea, the relationship between PFAS, an environmentally harmful substance, and kidney function was derived from representative results of Korean adolescents. In particular, it is very noteworthy that the median serum PFAS concentration in Korean adolescents is significantly higher than that of American adolescents. Based on this, it is expected that it will be used as basic data when identifying and analyzing the health threats of PFAS and as a basis for establishing health policies.
CONCLUSIONS
The association between kidney function and PFAS is one of the major environmental concerns in recent years. In this cross-sectional study, which was conducted for the first time among Korean adolescents, it was found that there was a negative correlation between the 5 types of PFAS (PFOA, PFOS, PFHxS, PFNA, and PFDeA) and their combinations, and kidney function. Long-term, well-designed longitudinal studies and continuous follow-up are needed.
Acknowledgements
Thanks to the National Institute of Environmental Research for willingly providing data.
To many people, including Lee and reviewers, thanks them for their helpful advice.
And above all, I would like to express my greatest gratitude to my wife for her encouragement and advice.
Abbreviations
BMI
body mass index
CI
confidence interval
eGFR
estimate glomerular filtration rate
HbA1c
hemoglobin A1c
KoNEHS
Korean National Environmental Health Survey
LOD
limit of detection
NHANES
National Health and Nutrition Examination Survey
PFAS
perfluoroalkyl substances
PFDeA
perfluorodecanoic acid
PFHxS
perfluorohexanesulfonic acid
PFNA
perfluorononanoic acid
PFOA
perfluorooctanoic acid
PFOS
perfluorooctansulfonate
ROS
reactive oxidative species
-
Funding: This work was supported by the Soonchunhyang University Research Fund.
-
Competing interests: The authors declare that they have no competing interests.
-
Authors contributions:
NOTES
- 1. OECD. Toward a new comprehensive global database of per-and polyfluoroalkyl substances (PFASs): Summary report on updating the OECD 2007 list of per-and polyfluoroalkyl substances (PFASs). Ser Risk Manag 2018;39:1–24.
- 2. Sunderland EM, Hu XC, Dassuncao C, Tokranov AK, Wagner CC, Allen JG. A review of the pathways of human exposure to poly- and perfluoroalkyl substances (PFASs) and present understanding of health effects. J Expo Sci Environ Epidemiol 2019;29(2):131–147. 30470793.ArticlePubMedPMCPDF
- 3. Armitage J, Cousins IT, Buck RC, Prevedouros K, Russell MH, MacLeod M, et al. Modeling global-scale fate and transport of perfluorooctanoate emitted from direct sources. Environ Sci Technol 2006;40(22):6969–6975. 17154003.ArticlePubMed
- 4. Yeo MK, Hwang EH, Jeong GH. Distribution characteristics of perfluorinated compounds in major river water and sediment. Anal Sci Technol 2012;25(5):313–323.Article
- 5. National Institute of Environmental Research (KR). A Study on Management of Unregulated Trace Hazardous Compounds in Drinking Water. Incheon, Korea: National Institute of Environmental Research; 2020.
- 6. Son B, Lee L, Yang M, Park S, Pyo H, Lee W, et al. Distribution and risk assessment of perfluorinated compounds (PFCs) in major drinking water treatment plants, Korea. J Korean Soc Water Wastewater 2017;31(6):491–499.Article
- 7. Kirk M, Smurthwaite K, Braunig J, Trevenar S, D’Este C, Lucas R, et al. The PFAS Health Study: Systematic Literature Review. Canberra, Australia: The Australian National University; 2018.
- 8. Ferrari F, Orlando A, Ricci Z, Ronco C. Persistent pollutants: focus on perfluorinated compounds and kidney. Curr Opin Crit Care 2019;25(6):539–549. 31524719.ArticlePubMed
- 9. Stanifer JW, Stapleton HM, Souma T, Wittmer A, Zhao X, Boulware LE. Perfluorinated chemicals as emerging environmental threats to kidney health: a scoping review. Clin J Am Soc Nephrol 2018;13(10):1479–1492. 30213782.PubMedPMC
- 10. Cui L, Zhou QF, Liao CY, Fu JJ, Jiang GB. Studies on the toxicological effects of PFOA and PFOS on rats using histological observation and chemical analysis. Arch Environ Contam Toxicol 2009;56(2):338–349. 18661093.ArticlePubMedPDF
- 11. Qian Y, Ducatman A, Ward R, Leonard S, Bukowski V, Lan Guo N, et al. Perfluorooctane sulfonate (PFOS) induces reactive oxygen species (ROS) production in human microvascular endothelial cells: role in endothelial permeability. J Toxicol Environ Health A 2010;73(12):819–836. 20391123.ArticlePubMedPMC
- 12. Zhang B, He Y, Huang Y, Hong D, Yao Y, Wang L, et al. Novel and legacy poly- and perfluoroalkyl substances (PFASs) in indoor dust from urban, industrial, and e-waste dismantling areas: the emergence of PFAS alternatives in China. Environ Pollut 2020;263(Pt A):114461. 32251969.ArticlePubMed
- 13. Jain RB. Perfluoroalkyl acids and their isomers, diabetes, anemia, and albuminuria: variabilities with deteriorating kidney function. Ecotoxicol Environ Saf 2021;208:111625. 33396145.ArticlePubMed
- 14. Calafat AM, Wong LY, Kuklenyik Z, Reidy JA, Needham LL. Polyfluoroalkyl chemicals in the U.S. population: data from the National Health and Nutrition Examination Survey (NHANES) 2003-2004 and comparisons with NHANES 1999-2000. Environ Health Perspect 2007;115(11):1596–1602. 18007991.ArticlePubMedPMC
- 15. PFAS in the U.S. population. Updated 2022]. Accessed November 14, 2022]. https://www.atsdr.cdc.gov/pfas/health-effects/us-population.html .
- 16. Landrigan PJ, Goldman LR. Children’s vulnerability to toxic chemicals: a challenge and opportunity to strengthen health and environmental policy. Health Aff (Millwood) 2011;30(5):842–850. 21543423.ArticlePubMed
- 17. Renal function tests. Updated 2022]. Accessed November 14, 2022]. https://www.ncbi.nlm.nih.gov/books/NBK507821 .
- 18. Kidney Disease: Improving Global Outcomes (KDIGO) Blood Pressure Work Group. KDIGO 2021 clinical practice guideline for the management of blood pressure in chronic kidney disease. Kidney Int 2021;99(3S):S1–87. 33637192.PubMed
- 19. Staples A, LeBlond R, Watkins S, Wong C, Brandt J. Validation of the revised Schwartz estimating equation in a predominantly non-CKD population. Pediatr Nephrol 2010;25(11):2321–2326. 20652327.ArticlePubMedPDF
- 20. Comptox chemicals dashboard. Updated 2022]. Accessed November 14, 2022]. https://comptox.epa.gov/dashboard/chemical-lists/PFASSTRUCTV5 .
- 21. Kazancioğlu R. Risk factors for chronic kidney disease: an update. Kidney Int Suppl (2011) 2013;3(4):368–371. 25019021.ArticlePubMedPMC
- 22. Flynn JT, Kaelber DC, Baker-Smith CM, Blowey D, Carroll AE, Daniels SR, et al. Clinical practice guideline for screening and management of high blood pressure in children and adolescents. Pediatrics 2017;140(3):e20171904. 28827377.PubMed
- 23. Hur KY, Moon MK, Park JS, Kim SK, Lee SH, Yun JS, et al. 2021 clinical practice guidelines for diabetes mellitus of the Korean Diabetes Association. Diabetes Metab J 2021;45(4):461–481. 34352984.PubMedPMC
- 24. García-Esquinas E, Loeffler LF, Weaver VM, Fadrowski JJ, Navas-Acien A. Kidney function and tobacco smoke exposure in US adolescents. Pediatrics 2013;131(5):e1415–e1423. 23569089.ArticlePubMedPMCPDF
- 25. Lee W, Lee S, Roh J, Won JU, Yoon JH. The association between involuntary smoking exposure with urine cotinine level and blood cadmium level in general non-smoking populations. J Korean Med Sci 2017;32(4):568–575. 28244280.ArticlePubMedPMCPDF
- 26. Tonelli M, Isles C, Craven T, Tonkin A, Pfeffer MA, Shepherd J, et al. Effect of pravastatin on rate of kidney function loss in people with or at risk for coronary disease. Circulation 2005;112(2):171–178. 15998677.ArticlePubMed
- 27. Lim JS, Kim EY, Kim JH, Yoo JH, Yi KH, Chae HW, et al. 2017 clinical practice guidelines for dyslipidemia of Korean children and adolescents. Ann Pediatr Endocrinol Metab 2020;25(4):199–207. 33401878.ArticlePubMedPMCPDF
- 28. Korean National Institute of Environmental Research. Guidelines for Using Raw Materials for Korean National Environmental Health Survey (Child, Adolescent)-the Fourth Stage (2018–2020). Incheon, Korea: Korean National Institute of Environmental Research; 2022.
- 29. Shankar A, Xiao J, Ducatman A. Perfluoroalkyl chemicals and chronic kidney disease in US adults. Am J Epidemiol 2011;174(8):893–900. 21873601.ArticlePubMedPMC
- 30. Watkins DJ, Josson J, Elston B, Bartell SM, Shin HM, Vieira VM, et al. Exposure to perfluoroalkyl acids and markers of kidney function among children and adolescents living near a chemical plant. Environ Health Perspect 2013;121(5):625–630. 23482063.ArticlePubMedPMC
- 31. Kataria A, Trachtman H, Malaga-Dieguez L, Trasande L. Association between perfluoroalkyl acids and kidney function in a cross-sectional study of adolescents. Environ Health 2015;14(1):89. 26590127.ArticlePubMedPMCPDF
- 32. Poothong S, Papadopoulou E, Padilla-Sánchez JA, Thomsen C, Haug LS. Multiple pathways of human exposure to poly- and perfluoroalkyl substances (PFASs): from external exposure to human blood. Environ Int 2020;134:105244. 31711019.ArticlePubMed
- 33. Fàbrega F, Kumar V, Schuhmacher M, Domingo JL, Nadal M. PBPK modeling for PFOS and PFOA: validation with human experimental data. Toxicol Lett 2014;230(2):244–251. 24440341.ArticlePubMed
- 34. Pérez F, Nadal M, Navarro-Ortega A, Fàbrega F, Domingo JL, Barceló D, et al. Accumulation of perfluoroalkyl substances in human tissues. Environ Int 2013;59:354–362. 23892228.ArticlePubMed
- 35. Han X, Nabb DL, Russell MH, Kennedy GL, Rickard RW. Renal elimination of perfluorocarboxylates (PFCAs). Chem Res Toxicol 2012;25(1):35–46. 21985250.ArticlePubMed
- 36. Zhang Y, Beesoon S, Zhu L, Martin JW. Biomonitoring of perfluoroalkyl acids in human urine and estimates of biological half-life. Environ Sci Technol 2013;47(18):10619–10627. 23980546.ArticlePubMed
- 37. Worley RR, Yang X, Fisher J. Physiologically based pharmacokinetic modeling of human exposure to perfluorooctanoic acid suggests historical non drinking-water exposures are important for predicting current serum concentrations. Toxicol Appl Pharmacol 2017;330:9–21. 28684146.ArticlePubMedPMC
- 38. Yang CH, Glover KP, Han X. Characterization of cellular uptake of perfluorooctanoate via organic anion-transporting polypeptide 1A2, organic anion transporter 4, and urate transporter 1 for their potential roles in mediating human renal reabsorption of perfluorocarboxylates. Toxicol Sci 2010;117(2):294–302. 20639259.ArticlePubMed
- 39. Moon J. Perfluoroalkyl substances (PFASs) exposure and kidney damage: Causal interpretation using the US 2003-2018 National Health and Nutrition Examination Survey (NHANES) datasets. Environ Pollut 2021;288:117707. 34252714.ArticlePubMed
- 40. Blake BE, Pinney SM, Hines EP, Fenton SE, Ferguson KK. Associations between longitudinal serum perfluoroalkyl substance (PFAS) levels and measures of thyroid hormone, kidney function, and body mass index in the Fernald Community Cohort. Environ Pollut 2018;242(Pt A):894–904. 30373035.ArticlePubMedPMC
- 41. Lin PD, Cardenas A, Hauser R, Gold DR, Kleinman KP, Hivert MF, et al. Per- and polyfluoroalkyl substances and kidney function: follow-up results from the Diabetes Prevention Program trial. Environ Int 2021;148:106375. 33482440.ArticlePubMedPMC
- 42. Weinstein JR, Anderson S. The aging kidney: physiological changes. Adv Chronic Kidney Dis 2010;17(4):302–307. 20610357.ArticlePubMedPMC
- 43. De Silva AO, Armitage JM, Bruton TA, Dassuncao C, Heiger-Bernays W, Hu XC, et al. PFAS exposure pathways for humans and wildlife: a synthesis of current knowledge and key gaps in understanding. Environ Toxicol Chem 2021;40(3):631–657. 33201517.ArticlePubMedPMCPDF
- 44. Rahman MF, Peldszus S, Anderson WB. Behaviour and fate of perfluoroalkyl and polyfluoroalkyl substances (PFASs) in drinking water treatment: a review. Water Res 2014;50:318–340. 24216232.ArticlePubMed
- 45. Detected ‘perfluorinated compounds’ in frying pan coating materials in half of domestic cosmetics survey subjects. Updated 2021]. Accessed November 14, 2022]. http://kfem.or.kr/?p=220037 .
- 46. Calderon-Margalit R, Golan E, Twig G, Leiba A, Tzur D, Afek A, et al. History of childhood kidney disease and risk of adult end-stage renal disease. N Engl J Med 2018;378(5):428–438. 29385364.ArticlePubMed
- 47. Pottel H, Dubourg L, Goffin K, Delanaye P. Alternatives for the bedside Schwartz equation to estimate glomerular filtration rate in children. Adv Chronic Kidney Dis 2018;25(1):57–66. 29499888.ArticlePubMed
REFERENCES
REFERENCES
Figure & Data
REFERENCES
Citations
Citations to this article as recorded by 
- Effects of Eucalyptus globulus addition to softwood greaseproof paper production improved energy efficiency of greaseproof paper production
Björn Öman, Henrik Kjellgren, Helena Håkansson, Agne Swerin, Björn Sjöstrand
Nordic Pulp & Paper Research Journal.2026; 41(1): 57. CrossRef - Long-Term Per- and Polyfluoroalkyl Substances Exposure and Kidney Function in Taiwanese Adolescents and Young Adults: A 10-Year Prospective Cohort Study
Chien-Yu Lin, Hui-Ling Lee, Ta-Chen Su
Journal of Xenobiotics.2026; 16(1): 16. CrossRef - Perfluorooctanoic acid induced lung toxicity via TGF-β1/Smad pathway, crosstalk between airway hyperresponsiveness and fibrosis: withdrawal impact
Arwa A. Elsheikh, Amany Mohamed Shalaby, Mohamed Ali Alabiad, Noha Ali Abd-Almotaleb, Eman El-Sayed Khayal
Environmental Science and Pollution Research.2025; 32(9): 4989. CrossRef - Environmental disease monitoring by regional Environmental Health
Centers in Korea: a narrative review
Myung-Sook Park, Hwan-Cheol Kim, Woo Jin Kim, Yun-Chul Hong, Won-Jun Choi, Seock-Yeon Hwang, Jiho Lee, Young-Seoub Hong, Yong-Dae Kim, Seong-Chul Hong, Joo Hyun Sung, Inchul Jeong, Kwan Lee, Won-Ju Park, Hyun-Joo Bae, Seong-Yong Yoon, Cheolmin Lee, Kyoung
The Ewha Medical Journal.2025;[Epub] CrossRef - Association Between Perfluoroalkyl Substance (PFAS) Exposure and Nonalcoholic Fatty Liver Disease in Korean Adults: Results From the KoNEHS 2018–2020: A Cross‐Sectional Study
Jisuk Yun, Young‐Sun Min
American Journal of Industrial Medicine.2025; 68(7): 588. CrossRef - An insight into the environmental and human health impacts of per- and polyfluoroalkyl substances (PFAS): exploring exposure pathways and their implications
Mohammad Hadi Dehghani, Mina Aghaei, Parnia Bashardoust, Mohammad Rezvani Ghalhari, Danial Nayeri, Milad Malekpoor, Samira Sheikhi, Zhixiong Shi
Environmental Sciences Europe.2025;[Epub] CrossRef - Temporal changes in per and polyfluoroalkyl substances and their associations with type 2 diabetes
Vivian Berg, Dolley D. Charles, Sandra Huber, Therese H. Nøst, Torkjel M. Sandanger, Maria Averina, Ingvar A. Bergdahl, Mia M. Nilsen, Tom Wilsgaard, Charlotta Rylander
Scientific Reports.2025;[Epub] CrossRef - Standing at the crossroads: How does amino acids function in the crosstalk between pancreas and the kidney under exposure to per- and polyfluoroalkyl substances?
Ming Yang, Ziwen An, Xiaoqing Xing, Yayuan Mei, Haoran Li, Jiaxin Zhao, Zhenzhen Tan, Yanbing Li, Jingjing Zhao, Jiayin Zhao, Meiduo Zhao, Jing Xu, Qun Xu, Huicai Guo, Ang Li
Journal of Hazardous Materials.2025; 496: 139257. CrossRef - Serum perfluoroalkyl and polyfluoroalkyl substances and the risk of kidney function decline: Unraveling the mediating role of iron status
Yanzhen Hu, Zhenyu Wu, Yongbin Zhao, Huijun Wang, Zongyao Li, Xi Kang, Xiaofan Zhang, Tao Zhang, Chang Su, Aidong Liu, Ying Wu
Ecotoxicology and Environmental Safety.2025; 303: 118843. CrossRef - Understanding the plastic-associated endocrine-disrupting chemicals in India: Environmental contamination, health impacts and regulatory challenges
Dhananjay Tripathi, Sukhvir Singh, Kamal Uddin Ahamad
Journal of Environmental Chemical Engineering.2025; 13(5): 118453. CrossRef - Neighborhood environmental burden and chronic kidney disease in the US: A cross-sectional study
Liwen Wang, Weiye Liu, Junhui Yang, Yu Zhao, Xiuquan Hu, Xuewei Huang, Hui Liu
Public Health.2025; 248: 105927. CrossRef - Exposure characteristics of legacy PFAS, and their precursors and alternatives among children and adolescents of Korea
Heeyeon Chae, Ju Yeon Choi, Hyeri Jeon, Won-Young Kim, Na-Youn Park, Inae Lee, Hyo-Bang Moon, Youglim Kho, Kyungho Choi
International Journal of Hygiene and Environmental Health.2025; 269: 114644. CrossRef - Perfluoroalkyl substances exposure and kidney function decline in a community-based prospective cohort
Chun-Yu Chen, Chin-Chan Lee, Chiao-Yin Sun, Yih-Ting Chen, Heng-Chih Pan, Yun-An Liu, Cheng-Kai Hsu, Heng-Jung Hsu
Ecotoxicology and Environmental Safety.2025; 303: 119015. CrossRef - Reference values of per- and poly- fluoroalkyl substances concentration in serum and related factors in Korean adults: Korean National Environmental Health Survey
Yong Min Cho, Dahee Han, Jio Jeong, Mi Jeong Kim, Kyung-Hwa Choi, Woo Jin Kim, Young-Seoub Hong
Environmental Analysis Health and Toxicology.2025; 40(3): e2025021. CrossRef - Differential impact of per- and polyfluoroalkyl substances exposure on hypertension risk by kidney function and metabolic status
Yaerim Kim, Inae Lee, Jeonghwan Lee, Gowoon Lee, Jin Hyuk Paek, Seungyeup Han, Younglim Kho, Chun Soo Lim, Kyungho Choi, Jung Pyo Lee
Environment International.2025; 206: 109930. CrossRef - Association of Combined Per- and Polyfluoroalkyl Substances and Metals with Chronic Kidney Disease
Issah Haruna, Emmanuel Obeng-Gyasi
International Journal of Environmental Research and Public Health.2024; 21(4): 468. CrossRef - Leveraging Machine Learning for a Comprehensive Assessment of PFAS Nephrotoxicity
Anirudh Mazumder, Kapil Panda
Advances in Science, Technology and Engineering Systems Journal.2024; 9(3): 62. CrossRef - Clinical, histological, molecular, and toxicokinetic renal outcomes of per-/polyfluoroalkyl substances (PFAS) exposure: Systematic review and meta-analysis
Jidapa Hanvoravongchai, Methasit Laochindawat, Yusuke Kimura, Nathan Mise, Sahoko Ichihara
Chemosphere.2024; 368: 143745. CrossRef
 Cite
Cite- Figure
-
- Related articles
-
- Association between outdoor clothing use and serum perfluoroalkyl substances (PFAS): Korean National Environmental Health Survey cycle 4
- Relationship between the use of hair products and urine benzophenone-3: the Korean National Environmental Health Survey (KoNEHS) cycle 4
- Relationship between crustacean consumption and serum perfluoroalkyl substances (PFAS): the Korean National Environmental Health Survey (KoNEHS) cycle 4
- Association between serum perfluoroalkyl substances concentrations and non-alcoholic fatty liver disease among Korean adults: a cross-sectional study using the National Environmental Health Survey cycle 4
The association of perfluoroalkyl substances (PFAS) exposure and kidney function in Korean adolescents using data from Korean National Environmental Health Survey (KoNEHS) cycle 4 (2018–2020): a cross-sectional study
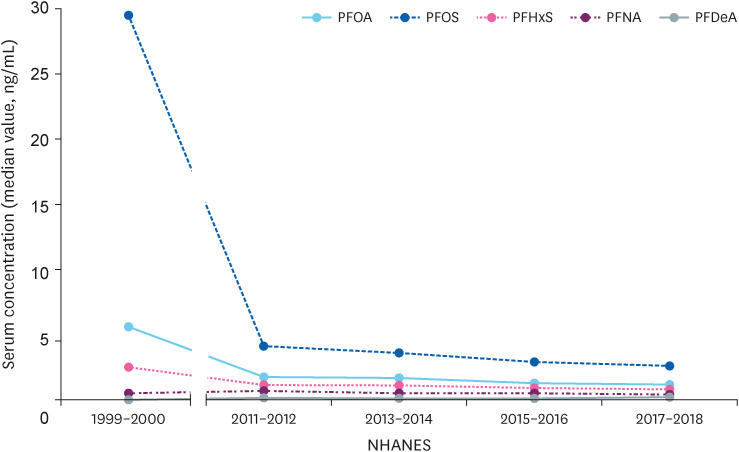
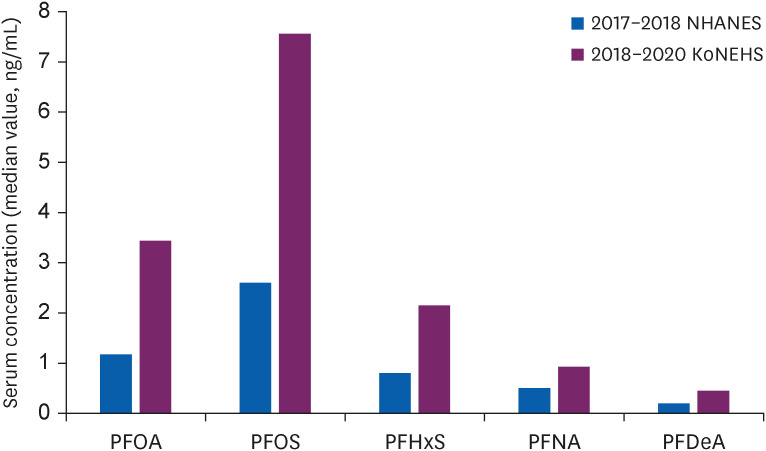
Fig. 1 Changes in serum perfluoroalkyl substances concentration of adolescents in 1999–2000 and in the last 4 years in the USA.PFOA: perfluorooctanoic acid; PFOS: perfluorooctansulfonate; PFHxS: perfluorohexanesulfonic acid; PFNA: perfluorononanoic acid; PFDeA: perfluorodecanoic acid; NHANES: National Health and Nutrition Examination Survey.
Fig. 2 Comparison of recent study results in Korean and USA adolescents.PFOA: perfluorooctanoic acid; PFOS: perfluorooctansulfonate; PFHxS: perfluorohexanesulfonic acid; PFNA: perfluorononanoic acid; PFDeA: perfluorodecanoic acid; NHANES: National Health and Nutrition Examination Survey; KoNEHS: Korean National Environmental Health Survey.
Fig. 1
Fig. 2
The association of perfluoroalkyl substances (PFAS) exposure and kidney function in Korean adolescents using data from Korean National Environmental Health Survey (KoNEHS) cycle 4 (2018–2020): a cross-sectional study
| Characteristics | Unweighted sample size (n = 811) | eGFR (mL/min/1.73 m2) | ||
|---|---|---|---|---|
| Sex | 94.67 (93.49–95.85) | < 0.001*** | ||
| Male | 379 (46.7) | 85.35 (83.94–86.76) | ||
| Female | 432 (53.3) | 102.84 (101.38–104.31) | ||
| Age (years) | < 0.001*** | |||
| 12 | 122 (15.0) | 104.82 (102.05–107.59) | ||
| 13 | 113 (13.9) | 99.21 (96.50–101.87) | ||
| 14 | 128 (15.8) | 97.03 (94.16–99.89) | ||
| 15 | 154 (19.0) | 90.74 (88.30–93.19) | ||
| 16 | 156 (19.2) | 89.17 (86.87–91.47) | ||
| 17 | 138 (17.0) | 90.38 (86.90–93.87) | ||
| Household income (million won)b | 0.253 | |||
| < 1 (803 $) | 10 (1.2) | 89.32 (77.47–101.17) | ||
| 1–2 (803–1,606 $) | 42 (5.2) | 97.93 (92.64–103.23) | ||
| 2–3 (1,606–2,409 $) | 100 (12.3) | 95.18 (91.06–99.29) | ||
| 3–5 (2,409–4,014 $) | 269 (33.2) | 95.90 (93.88–97.93) | ||
| 5–7 (4,014–5,620 $) | 196 (24.2) | 92.65 (90.39–94.92) | ||
| ≥ 7 (5,620 $) | 147 (18.1) | 93.59 (90.86–96.31) | ||
| unaware | 47 (5.8) | 96.51 (91.81–101.21) | ||
| BMI (kg/m2) | < 0.001*** | |||
| < 18.5 | 106 (13.1) | 100.82 (97.78–103.85) | ||
| 18.5–25 | 540 (66.6) | 93.98 (92.59–95.38) | ||
| ≥ 25 | 165 (20.3) | 92.96 (89.97–95.94) | ||
| HbA1c (%) | 0.533 | |||
| < 6.5 | 808 (99.6) | 94.74 (93.55–95.87) | ||
| ≥ 6.5 | 3 (0.4) | 88.50 (64.28–109.89) | ||
| Urinary cotinine (ng/mL) | < 0.001*** | |||
| < 1.93 | 270 (33.3) | 98.37 (96.20–100.53) | ||
| 1.94–3.43 | 271 (33.3) | 93.95 (91.88–96.01) | ||
| ≥ 3.44 | 270 (33.3) | 91.69 (89.84–93.5) | ||
| Total cholesterol (mg/dL) | 0.734 | |||
| < 170 | 598 (73.7) | 94.55 (93.17–95.97) | ||
| ≥ 170 | 213 (26.3) | 95.01 (92.69–97.57) | ||
| Abnormal blood pressurec | < 0.001*** | |||
| No | 635 (78.3) | 95.74 (94.54–97.13) | ||
| Yes | 176 (21.7) | 90.82 (88.09–93.58) | ||
| Serum perfluoroalkyl chemical level (μg/L) | Unweighted sample size (n = 811) | eGFR (mL/min/1.73 m2) | ||
|---|---|---|---|---|
| Total PFAS | < 0.001*** | |||
| Quartile 1 (< 11.92 μg/L) | 203 | 99.37 (96.84–101.90) | ||
| Quartile 2 (11.92 to 15.89 μg/L) | 201 | 93.65 (91.30–96.00) | ||
| Quartile 3 (15.89 to 21.94 μg/L) | 205 | 93.11 (91.01–95.22) | ||
| Quartile 4 (> 21.94 μg/L) | 202 | 92.56 (90.16–94.96) | ||
| PFOA | < 0.001*** | |||
| Quartile 1 (< 2.70 μg/L) | 203 | 98.31 (95.64–100.97) | ||
| Quartile 2 (2.70 to 3.44 μg/L) | 203 | 95.50 (93.35–97.66) | ||
| Quartile 3 (3.44 to 4.76 μg/L) | 204 | 93.21 (90.90–95.52) | ||
| Quartile 4 (> 4.76 μg/L) | 201 | 91.69 (89.41–93.96) | ||
| PFOS | 0.022* | |||
| Quartile 1 (< 5.71 μg/L) | 202 | 97.04 (94.71–99.37) | ||
| Quartile 2 (5.71 to 7.61 μg/L) | 204 | 95.96 (93.41–98.52) | ||
| Quartile 3 (7.62 to 11.08 μg/L) | 203 | 92.80 (90.65–94.95) | ||
| Quartile 4 (> 11.08 μg/L) | 202 | 92.88 (90.46–95.29) | ||
| PFHxS | < 0.001*** | |||
| Quartile 1 (< 1.42 μg/L) | 202 | 98.98 (96.45–101.51) | ||
| Quartile 2 (1.42 to 2.16 μg/L) | 204 | 94.64 (92.28–96.99) | ||
| Quartile 3 (2.16 to 3.47 μg/L) | 203 | 92.05 (89.78–94.32) | ||
| Quartile 4 (> 3.47 μg/L) | 202 | 93.04 (90.79–95.28) | ||
| PFNA | < 0.001*** | |||
| Quartile 1 (< 0.70 μg/L) | 203 | 99.63 (96.91–102.35) | ||
| Quartile 2 (0.70 to 0.93 μg/L) | 202 | 93.65 (91.51–95.79) | ||
| Quartile 3 (0.93 to 1.22 μg/L) | 204 | 94.03 (91.97–96.10) | ||
| Quartile 4 (> 1.22 μg/L) | 202 | 91.39 (88.99–93.78) | ||
| PFDeA | 0.003** | |||
| Quartile 1 (< 0.36 μg/L) | 204 | 97.54 (94.93–100.16) | ||
| Quartile 2 (0.36 to 0.45 μg/L) | 201 | 94.48 (92.36–96.60) | ||
| Quartile 3 (0.46 to 0.56 μg/L) | 203 | 95.31 (92.96–97.66) | ||
| Quartile 4 (> 0.56 μg/L) | 203 | 91.36 (89.04–93.69) | ||
| Serum perfluoroalkyl chemical level (μg/L) | Unweighted sample size (n = 811) | Multivariable adjusted change in eGFRa (mL/min/1.73 m2) | |
|---|---|---|---|
| Total PFAS | |||
| Quartile 1 (< 11.92 μg/L) | 203 | Reference | |
| Quartile 2 (11.92 to 15.89 μg/L) | 201 | −4.04 (−7.45, −0.59)** | |
| Quartile 3 (15.89 to 21.94 μg/L) | 205 | −5.13 (−7.98, −2.27)*** | |
| Quartile 4 (> 21.94 μg/L) | 202 | −5.17 (−8.61, −1.73)* | |
| PFOA | |||
| Quartile 1 (< 2.70 μg/L) | 203 | Reference | |
| Quartile 2 (2.70 to 3.44 μg/L) | 203 | −1.57 (−4.04, 0.90) | |
| Quartile 3 (3.44 to 4.76 μg/L) | 204 | −3.96 (−6.68, −1.23)** | |
| Quartile 4 (> 4.76 μg/L) | 201 | −4.16 (−7.44, −0.87)* | |
| PFOS | |||
| Quartile 1 (< 5.71 μg/L) | 202 | Reference | |
| Quartile 2 (5.71 to 7.61 μg/L) | 204 | −1.46 (−4.51, 1.59) | |
| Quartile 3 (7.62 to 11.08 μg/L) | 203 | −3.39 (−5.84, −0.94)** | |
| Quartile 4 (> 11.08 μg/L) | 202 | −3.13 (−5.64, −0.61)* | |
| PFHxS | |||
| Quartile 1 (< 1.42 μg/L) | 202 | Reference | |
| Quartile 2 (1.42 to 2.16 μg/L) | 204 | −3.85 (−6.78, −0.93)* | |
| Quartile 3 (2.16 to 3.47 μg/L) | 203 | −3.63 (−6.61, −0.65)* | |
| Quartile 4 (> 3.47 μg/L) | 202 | −5.24 (−8.59, −1.88)** | |
| PFNA | |||
| Quartile 1 (< 0.70 μg/L) | 203 | Reference | |
| Quartile 2 (0.70 to 0.93 μg/L) | 202 | −3.77 (−6.49, −1.05)** | |
| Quartile 3 (0.93 to 1.22 μg/L) | 204 | −3.32 (−5.80, −0.83)** | |
| Quartile 4 (> 1.22 μg/L) | 202 | −4.20 (−7.35, −1.04)* | |
| PFDeA | |||
| Quartile 1 (< 0.36 μg/L) | 204 | Reference | |
| Quartile 2 (0.36 to 0.45 μg/L) | 201 | −1.45 (−4.25, 1.35) | |
| Quartile 3 (0.46 to 0.56 μg/L) | 203 | −2.28 (−5.09, 0.54) | |
| Quartile 4 (> 0.56 μg/L) | 203 | −3.79 (−6.74, −0.84)* | |
| Serum perfluoroalkyl chemicals | Multivariable adjusted change in eGFR (mL/min/1.73 m2) | |
|---|---|---|
| Model 1a | Model 2b | |
| Total PFAS | −2.81 (−5.50, −0.12)* | −3.31 (−5.98, −0.64)* |
| PFOA | −2.62 (−5.40, 0.17) | −3.09 (−5.80, −0.38)* |
| PFOS | −2.24 (−3.96, −0.53)* | −2.50 (−4.20, −0.80)** |
| PFHxS | −1.20 (−3.06, 0.67) | −1.53 (−3.35, 0.29) |
| PFNA | −2.21 (−4.73, 0.31) | −2.45 (−4.91, 0.02) |
| PFDeA | −2.50 (−5.26, 0.25) | −3.05 (−5.77, −0.32)* |
| Characteristics | Multivariable adjusted change in eGFRa (mL/min/1.73 m2) | ||||||
|---|---|---|---|---|---|---|---|
| Total PFAS | PFOA | PFOS | PFHxS | PFNA | PFDeA | ||
| Sex | |||||||
| Male | −2.27 (−4.84, 0.31) | −2.45 (−5.58, 0.68) | −1.68 (−3.57, 0.20) | −1.50 (−3.76, 0.76) | −2.23 (−5.30, 0.84) | −2.57 (−5.70, 0.57) | |
| Female | −4.50 (−8.79, −0.20)* | −3.75 (−7.85, 0.35) | −3.44 (−6.31, −0.57)* | −1.60 (−3.85, 0.64) | −3.02 (−6.95, 0.92) | −3.72 (−8.37, 0.92) | |
| Age (years) | |||||||
| < 15 | −1.66 (−4.81, 1.49) | 0.38 (−2.78, 3.54) | −1.51 (−3.90, 0.88) | −1.14 (−3.63, 0.35) | 0.89 (−3.19, 4.97) | 0.82 (−3.22, 0.41) | |
| ≥ 15 | −3.79 (−7.84, 0.26) | −6.30 (−10.56, −2.04)** | −2.80 (−5.11, −0.49)* | −1.25 (−4.19, 1.70) | −4.80 (−8.17, −1.43)** | −5.76 (−9.46, −2.06)** | |
| BMI (kg/m2) | |||||||
| < 18.5 | −3.98 (−0.83, 0.32) | −2.20 (−8.18, 3.77) | −5.27 (−8.52, −2.03)** | −0.11 (−2.46, 2.25) | −4.35 (−11.16, 2.47) | −1.75 (−8,42, 4.93) | |
| 18.5–25 | −2.23 (−5.14, 0.68) | −2.19 (−4.80, 0.42) | −2.05 (−4.05, −0.05)* | −0.55 (−2.41, 1.30) | −2.22 (−5.02, 0.57) | −3.14 (−6.46, 0.19) | |
| ≥ 25 | −6.53 (−12.72, −0.34)* | −7.40 (−14.17, −0.62)* | −2.00 (−7.21, 3.21) | −6.26 (−10.00, −2.52)** | −4.63 (−10.77, 1.51) | −4.31 (−10.05, 1.43) | |
| Urinary cotinine (ng/mL) | |||||||
| < 1.93 | −3.33 (−8.50, 1.84) | −3.23 (−8.91, 2.45) | −1.63 (−5.44, 2.17) | −2.85 (−5.51, −0.19)* | −2.84 (−8.02, 2.35) | −4.34 (−10.56, 1.89) | |
| 1.94–3.43 | −3.58 (−7.97, 0.82) | −3.74 (−7.69, 0.20) | −3.06 (−6.29, 0.18) | −0.69 (−3.28, 1.90) | −4.12 (−8.36, 0.13) | −1.05 (−5.26, 3.17) | |
| ≥ 3.44 | −2.37 (−4.79, 0.04) | −1.31 (−4.65, 2.04) | −2.20 (−4.01, −0.38)* | −1.31 (−3.97, 1.34) | −0.67 (−4.02, 2.69) | −2.91 (−6.37, 0.57) | |
| Total cholesterol (mg/dL) | |||||||
| < 170 | −2.30 (−5.00, 0.39) | −3.69 (−6.55, −0.82)* | −1.43 (−3.25, 0.39) | −1.09 (−3.04, 0.86) | −3.55 (−6.31, −0.79)* | −3.66 (−6.69, −0.64)* | |
| ≥ 170 | −5.72 (−11.24, −0.21)* | −1.79 (−8.47, 4.89) | −4.51 (−8.34, −0.68)* | −3.01 (−5.78, −0.23)* | −0.59 (−6.48, 5.31) | −0.93 (−7.68, 5.82) | |
| Abnormal blood pressureb | |||||||
| No | −1.97 (−4.98, 1.04) | −2.08 (−5.06, 0.90) | −1.58 (−3.46, 0.30) | −0.87 (−2.84, 1.09) | −1.38 (−4.19, 1.42) | −1.68 (−4.93, 1.58) | |
| Yes | −6.37 (−11.21, −1.53)* | −5.57 (−11.72, 0.58) | −4.85 (−9.06, −0.65)* | −3.39 (−7.36, 0.59) | −6.42 (−13.20, 0.36) | −9.27 (−16.42, −2.11)* | |
Table 1 General characteristics and mean eGFR of the study population
Values are presented as number (%) or mean (95% confidence interval).
BMI: body mass index; eGFR: estimated glomerular filtration rate; HbA1c: hemoglobin A1c.
aThe
bAn exchange rate of 1,245.5 won per dollar was applied.
cAbnormal blood pressure was defined as systolic blood pressure > 140 mmHg, diastolic blood pressure > 90 mmHg, or currently taking anti-hypertensive drugs.
***
Table 2 Mean eGFR according to quartile of PFAS
Values are presented as number or mean (95% confidence interval).
PFAS: perfluoroalkyl substances; PFOA: perfluorooctanoic acid; PFOS: perfluorooctansulfonate; PFHxS: perfluorohexanesulfonic acid; PFNA: perfluorononanoic acid; PFDeA: perfluorodecanoic acid’ eGFR: estimated glomerular filtration rate.
aThe
*
Table 3 Multivariable regression of PFAS with outcome measure of kidney function
Values are presented as mean (95% confidence interval).
PFAS: perfluoroalkyl substances; PFOA: perfluorooctanoic acid; PFOS: perfluorooctansulfonate; PFHxS: perfluorohexanesulfonic acid; PFNA: perfluorononanoic acid; PFDeA: perfluorodecanoic acid; eGFR: estimated glomerular filtration rate.
aAdjusted for sex, age, household income, body mass index, urinary cotinine, hemoglobin A1c, total cholesterol, abnormal blood pressure
*
Table 4 Mean change in eGFR (mL/min/1.73 m2) per 1 ln-serum PFAS using multivariable regression
Values are presented as mean (95% confidence interval).
PFAS: perfluoroalkyl substances; PFOA: perfluorooctanoic acid; PFOS: perfluorooctansulfonate; PFHxS: perfluorohexanesulfonic acid; PFNA: perfluorononanoic acid; PFDeA: perfluorodecanoic acid; eGFR: estimated glomerular filtration rate.
aAdjusted for sex and age.
bAdjusted for sex, age, household income, body mass index, urinary cotinine, hemoglobin A1c, total cholesterol and abnormal blood pressure.
*
Table 5 Mean change in eGFR (mL/min/1.73 m2) per 1 ln-serum PFAS using multivariable regression according to confounders
Values are presented as mean (95% confidence interval).
PFAS: perfluoroalkyl substances; PFOA: perfluorooctanoic acid; PFOS: perfluorooctansulfonate; PFHxS: perfluorohexanesulfonic acid; PFNA: perfluorononanoic acid; PFDeA: perfluorodecanoic acid; eGFR: estimated glomerular filtration rate; BMI: body mass index.
aAdjusted for sex, age, household income, body mass index, urinary cotinine, hemoglobin A1c, total cholesterol, abnormal blood pressure
bAbnormal blood pressure was defined as systolic blood pressure > 140 mmHg, diastolic blood pressure > 90 mmHg, or currently taking anti-hypertensive drugs.
*

