
Articles
- Page Path
- HOME > Ann Occup Environ Med > Volume 35; 2023 > Article
- Original Article Relationship between shellfish consumption and urinary phthalate metabolites: Korean National Environmental Health Survey (KoNEHS) cycle 3 (2015-2017)
-
Jisoo Kang
 , Seong-yong Cho, Jinseok Kim, Seongyong Yoon, Jong-min An, Gayoung Kim, Si young Kim
 -
Annals of Occupational and Environmental Medicine 2023;35:e2.
DOI: https://doi.org/10.35371/aoem.2023.35.e2
Published online: February 6, 2023
Department of Occupational and Environmental Medicine, Soonchunhyang University Hospital, Gumi, Korea.
- Correspondence: Seong-yong Cho. Department of Occupational and Environmental Medicine, Soonchunhyang University Hospital, 179 1gongdan-ro, Gumi 39371, Korea. 97blueciel@naver.com
• Received: September 21, 2022 • Revised: December 29, 2022 • Accepted: January 2, 2023
Copyright © 2023 Korean Society of Occupational & Environmental Medicine
This is an Open Access article distributed under the terms of the Creative Commons Attribution Non-Commercial License (https://creativecommons.org/licenses/by-nc/4.0/) which permits unrestricted non-commercial use, distribution, and reproduction in any medium, provided the original work is properly cited.
Abstract
-
Background Phthalates are endocrine disrupting chemicals that are widely used in the production of items of daily life such as in polyvinylchloride plastics, insecticides, and medical devices. This study aimed to determine the association between phthalate exposure and shellfish consumption using data from the Korean National Environmental Health Survey (KoNEHS) cycle 3 (2015–2017), which is a nationally representative survey.
-
Methods In this study, we analyzed the KoNEHS cycle 3 data of 3,333 (1,526 men and 1,807 women) adults aged more than 19 years. Data related to the variables of sociodemographic factors, health-related behaviors, dietary factors, seafood consumption frequency, and urinary phthalate metabolites concentrations were collected. The concentrations of urinary phthalate metabolites of all the participants were divided into quartiles to define high and low concentration groups based on the 75th percentile concentration. A χ2 test was conducted to analyze the distribution of independent variables. To analyze the relationship between shellfish consumption and phthalate exposure, the odds ratios (ORs) were calculated using logistic regression analysis.
-
Results Total adults with shellfish consumption frequency of over once a week showed the following adjusted ORs for high concentrations of the following metabolites compared with the group that consumed shellfish once a week or less: 1.43 (95% confidence interval [CI]: 1.01–2.06) for mono-(2-ethyl-5-oxohexyl) phthalate (MEOHP), 1.43 (95% CI: 1.01–2.03) for mono-(2-ethyl-5-carboxypentyl) phthalate (MECPP), 1.57 (95% CI: 1.10–2.24) for ∑di-2-ethylhexyl phthalate (∑DEHP), 2.01 (95% CI: 1.46–2.77) for mono-carboxyoctyl phthalate (MCOP), 1.56 (95% CI: 1.11–2.18) for mono-carboxy-isononly phthalate (MCNP), and 2.57 (95% CI: 1.85–3.56) for mono (3-carboxypropyl) phthalate (MCPP).
-
Conclusions The concentrations of urinary phthalate metabolites (MEOHP, MECPP, ∑DEHP, MCOP, MCNP, and MCPP) were higher in adults with a higher frequency of shellfish consumption.
BACKGROUND
Phthalates are esters of phthalic acid (1,2-benzene dicarboxylic acid) that contain two carbon chains of different lengths.1 Phthalates are added to hard plastic materials to soften them and to allow easy processing. This process is called plasticization; phthalates account for approximately 75% of all plasticizers.2 Hence, phthalates are widely used in daily supplies, food packaging materials, cosmetics, medical devices, and toys.3 High-molecular-weight phthalates, including di-2-ethylhexyl phthalate (DEHP), di-iso-nonylphthalate (DINP), di-iso-decyl phthalate (DIDP), and di-2-propylheptyl phthalate (DPHP) are plasticizers for polyvinylchloride that are used in food packaging materials, medical devices, and construction materials. Low-molecular-weight phthalates, including dimethyl phthalate (DMP), diethyl phthalate (DEP), butyl benzyl phthalate (BzBP), di-n-butyl phthalate (DBP), and di-iso-butyl phthalate (DiBP) are mainly contained in cosmetics and drugs as additives.4 Phthalate exposure in humans may occur through various routes such as oral intake, inhalation, and skin contact, while the most frequent cause is food intake.2
Phthalates are endocrine-disrupting chemicals.4 Phthalates can act as an androgen analogue to induce changes in semen quality,5,6 causing reproductive dysfunctions such as infertility.7 As they can bind with estrogen receptors, phthalates may increase the risk of breast cancer,8,9,10 and they are also known to not only increase insulin resistance but also cause or aggravate hypertension, diabetes, hyperlipidemia, and metabolic disease.11
Phthalates that enter the human body are rapidly metabolized to be excreted via urine or feces. The metabolic process involves phase 1 (hydrolysis) and phase 2 (conjugation) reactions. Low-molecular-weight phthalates undergo phase 1 reaction; then, they are excreted without any further metabolic steps. However, high-molecular-weight phthalates are metabolized by phase 1, followed by subsequent oxidation and phase 2 reaction for excretion.12 Most phthalates are excreted via urine. Since urinary phthalate metabolites are relatively easy to collect and a single sample of urinary phthalate metabolites reflect the exposure to phthalate over several weeks or months, urinary phthalate metabolites are used as biomarkers to measure the level of exposure to phthalates of the human body.12,13,14
Given that phthalates have been detected across a wide spectrum of marine ecosystems,15 examining phthalate exposure due to shellfish consumption may be crucial. Among seafood, shellfish is the representative indicator of marine ecosystem pollution.16,17,18,19 Various ongoing studies are investigating the problem of phthalate pollution in marine ecosystems. However, no study has yet been conducted phthalate exposure due to shellfish consumption among individuals in Korea. Thus, this study aimed to determine the association between phthalate exposure and shellfish consumption in the Korea population using data from the Korean National Environmental Health Survey (KoNEHS) cycle 3 (2015–2017), which is a nationally representative survey.
METHODS
In this study, we used data of adults aged more than 19 years from the KoNEHS cycle 3. Based on Article 14 of the Environmental Health Act, the KoNEHS has been conducted every 3 years since 2009 by the National Institute of Environmental Research under the Ministry of Environment as a nationwide official inquiry. The purpose of this survey is to make national basic data for establishing environmental health policies by continuously analyzing the current status of environmental health at national and regional units and influencing factors of environmental hazards in the human's body. A total of 3,787 participants in KoNEHS cycle 3 were sampled based on the 2015 population and selected from a total of 233 sample surveys, including 191 general surveys, 9 new apartments, 13 coastal layers, and 20 heavy metal network surveys. Around 15 persons were selected in each survey area. For the collection and analysis of biological samples, 16 clinical tests and 26 environmentally harmful substances were analyzed through blood and urine tests.
Among the data of 3,787 (1,648 men and 2,139 women) individuals aged more than 19 years, 454 persons with missing values of urinary creatinine or urinary phthalate metabolites concentrations or with values outside the normal urinary creatinine range of 0.3–3.0 g/L were excluded, resulting in a final set of 3,333 (1,526 men and 1,807 women) study participants (Fig. 1).20
Fig. 1

Flow chart of the selection of study participants.
KoNEHS: Korean National Environmental Health Survey.
Urinary phthalate metabolites concentrations were analyzed using ultra performance liquid chromatograph-mass spectrometry. Clinical laboratory technologists collected spot urine samples in sterilized containers and then transferred to an opaque storage container to shield them from light. The storage container was left to stand in iced water for 20 minutes to reduce the sample temperature and then moved to the lab in an ice box. The collected samples were stored in a −20°C freezer for subsequent analyses. Mono-(2-ethyl-5-hydroxyhexyl) phthalate (MEHHP), mono-(2-ethyl-5-oxohexyl) phthalate (MEOHP), mono-(2-ethyl-5-carboxypentyl) phthalate (MECPP), mono-n-butyl phthalate (MnBP), mono-benzyl phthalate (MBzP), mono-carboxyoctyl phthalate (MCOP), mono-carboxy-isononly phthalate (MCNP), mono (3-carboxypropyl) phthalate (MCPP) were analyzed.21 The sum of MEHHP, MEOHP, and MECPP was expressed as ∑DEHP.4 The concentrations of urinary phthalate metabolites of all the participants were divided into quartiles to define high and low concentration groups based on the 75th percentile concentration.22
The frequency of shellfish consumption was categorized into 9 groups (almost never, once a month, 2–3 times a month, once a week, 2–3 times a week, 4–6 times a week, once a day, 2 times a day, 3 times a day). Group of once a week or less included almost never, once a month, 2–3 times a month, once a week, while group of over once a week included 2–3 times a week, 4–6 times a week, once a day, 2 times a day, 3 times a day.
Sociodemographic factors, health-related behaviors, and dietary factors of the study participants and types of seafood were defined as follows. Age was expressed as a mean value. Body mass index (BMI) was categorized into normal (≤ 25.0 kg/m2) and overweight (> 25.0 kg/m2). Marital status was categorized into single, married, and others (divorced/bereaved/separated). Based on smoking frequency, the subjects were categorized into non-smokers or ex-smoker (who have never smoked before or used to smoke but not currently) and current smokers. Based on the frequency of alcohol consumption, the participants were categorized into non-drinkers (who have never drunk before or used to drink but do not currently drink), moderate drinkers (who drink less alcohol than heavy drinkers), and heavy drinkers (who drink more than three times per week and more than seven glasses for men and more than 5 glasses for women at a time). Regarding dietary factors, the use of food storage containers at home in the refrigerator or freezer was divided into plastic bags or zipper bags and others, while consumption frequency of plastic pack drink was categorized into once a week or less and over once a week. Types of seafood were divided into shellfish, large fish and tuna, fish, crustaceans, seaweed, and other seafood items,20 with the consumption frequency categorized into once a week or less and over once a week.
Sociodemographic factors, health-related behaviors, dietary factors, seafood consumption frequency, and urinary phthalate metabolites concentrations were the variables examined in this study. A χ2 test was conducted to analyze the distribution of independent variables. To analyze the relationship between shellfish consumption and phthalate exposure, the odds ratios (ORs) were calculated using logistic regression analysis. For total adult, odd ratios are calculated by adjusting not only gender and age but also sociodemographic factors, health-related behaviors, dietary factors, seafood consumption frequency. For men and women, odd ratios are calculated by adjusting by sociodemographic factors, health-related behaviors, dietary factors, seafood consumption frequency. The logistic regression model was analyzed by applying the weights presented in the original dataset according to the KoNEHS analysis guideline. For statistical analysis, the IBM SPSS version 28 for Windows (IBM Corp., Armonk, NY, USA) was used. The level of significance was set at p-value < 0.05.
All participants of the KoNEHS cycle 3 (2015–2017) included in this study provided written informed consent. This study was approved by the Institutional Review Board of Soonchunhyang University Hospital (IRB No. Medicine 2022-08).
RESULTS
The study participants comprised 1,526 men (46%) and 1,807 women (54%) individuals. The median concentrations(MEHHP, MEOHP, MECPP, ∑DEHP, MnBP, MBzP, MCOP, MCNP, and MCPP) were as follows: MEHHP 18.2 µg/g Cr (men: 15.6 µg/g Cr, women: 20.8 µg/g Cr), MEOHP 13.5 µg/g Cr (men: 11.3 µg/g Cr, women: 16.1 µg/g Cr), MECPP 27.6 µg/g Cr (men: 22.8 µg/g Cr, women: 32.1 µg/g Cr), ∑DEHP 61.0 µg/g Cr (men: 51.2 µg/g Cr, women: 71.6 µg/g Cr), MnBP 31.8 µg/g Cr (men: 27.4 µg/g Cr, women: 35.1 µg/g Cr), MBzP 2.7 µg/g Cr (men: 2.4 µg/g Cr, women: 3.0 µg/g Cr), MCOP 1.1 µg/g Cr (men: 1.0 µg/g Cr, women: 1.3 µg/g Cr), MCNP 0.5 µg/g Cr (men: 0.4 µg/g Cr, women: 0.5 µg/g Cr), MCPP 1.1 µg/g Cr (men: 1.0 µg/g Cr, women: 1.3 µg/g Cr). The median concentrations of urinary phthalate metabolites were higher in women than in men. The mean age of the participants was 52.9 years (52.8 years in men and 53.0 years in women). More men than women were overweight, current smokers, and heavy drinkers. Regarding the consumption of large fish and tuna, men had a significantly higher consumption frequency of over once a week (Table 1).
Table 1
Baseline characteristics of the participants
Data were presented as median (interquartile range), mean ± standard deviation, or number (%).
MEHHP: mono-(2-ethyl-5-hydroxyhexyl) phthalate; MEOHP: mono-(2-ethyl-5-oxohexyl) phthalate; MECPP: mono-(2-ethyl-5-carboxypentyl) phthalate; ∑DEHP: ∑di-2-ethylhexyl phthalate; MnBP: mono-n-butyl phthalate; MBzP: mono-benzyl phthalate; MCOP: mono-carboxyoctyl phthalate; MCNP: mono-carboxy-isononly phthalate; MCPP: mono (3-carboxypropyl) phthalate; BMI: body mass index.
ap-value calculated by t-test; bp-value calculated by χ2 test.
The distribution of high and low urinary phthalate metabolites group according to basic characteristics and the frequencies of consumption of seafood is presented in Tables 2, 3, 4. For MEHHP, MEOHP, MECPP, ∑DEHP, MnBP, MBzP, MCNP, and MCPP, the mean age of the adult participants in this study was higher in the high concentration group of urinary phthalate metabolites than low concentration group. The group with high concentrations of urinary phthalate metabolites exhibited higher predominance of women (MEHHP, MEOHP, MECPP, ∑DEHP, MnBP, MBzP, MCOP, MCNP, and MCPP), normal BMI (MCOP, MCNP, and MCPP), non-smokers or ex-smoker (MEHHP, MEOHP, MECPP, ∑DEHP, MnBP, MBzP, MCOP, MCNP, and MCPP), a lower rate of heavy drinkers (MEHHP, MEOHP, MECPP, ∑DEHP, MnBP, MBzP, MCOP, MCNP, and MCPP) and storage of food in plastic bag or zipper bags (MEHHP, MEOHP, MECPP, and ∑DEHP) than the group with low concentration. Regarding seafood consumption, the high concentration group showed higher rates of shellfish consumption of over once a week (MCOP, MCNP, and MCPP) and large fish and tuna consumption over once a week (MCPP) and crustacean consumption over once a week (MnBP) than the low concentration group.
Table 2
Baseline characteristics of the total adults according to urinary phthalate metabolites: MEHHP, MEOHP, MECPP
Table 3
Baseline characteristics of the total adults according to urinary phthalate metabolites: ∑DEHP, MnBP, MBzP
Table 4
Baseline characteristics of the total adults according to urinary phthalate metabolites: MCOP, MCNP, MCPP
In this study, total adults that consumed shellfish over once a week showed the following adjusted ORs for significantly high concentrations of urinary phthalate metabolites compared with the group that consumed shellfish once a week or less: 1.43 (95% confidence interval [CI]: 1.01–2.06) for MEOHP, 1.43 (95% CI: 1.01–2.03) for MECPP, 1.57 (95% CI: 1.10–2.24) for ∑DEHP, 2.01 (95% CI: 1.46–2.77) for MCOP, 1.56 (95% CI: 1.11–2.18) for MCNP, and 2.57 (95% CI: 1.85–3.56) for MCPP. For men, the group that consumed shellfish over once a week, compared with the group that consumed shellfish once a week or less, showed the following adjusted ORs for high concentrations of urinary phthalate metabolites: 1.66 (95% CI: 1.01–2.71) for MEHHP, 1.91 (95% CI: 1.14–3.18) for MEOHP, 1.82 (95% CI: 1.13–2.91) for MECPP, 1.77 (95% CI: 1.09–2.87) for ∑DEHP, 1.90 (95% CI: 1.17–3.07) for MnBP, 2.27 (95% CI: 1.44–3.58) for MCOP, 1.85 (95% CI: 1.16–2.96) for MCNP, and 3.01 (95% CI: 1.91–4.74) for MCPP. For women, the adjusted ORs were not significantly high, but the unadjusted ORs were significantly high for MCOP at 1.99 (95% CI: 1.34–2.95) and for MCPP at 1.58 (95% CI: 1.05–2.37) (Table 5).
Table 5
Adjusted ORs and 95% CIs of shellfish consumption with high concentrations of urinary phthalate metabolites
OR: odds ratio; CI: confidence interval; MEHHP: mono-(2-ethyl-5-hydroxyhexyl) phthalate; MEOHP: mono-(2-ethyl-5-oxohexyl) phthalate; MECPP: mono-(2-ethyl-5-carboxypentyl) phthalate; ∑DEHP: ∑di-2-ethylhexyl phthalate; MnBP: mono-n-butyl phthalate; MBzP: mono-benzyl phthalate; MCOP: mono-carboxyoctyl phthalate; MCNP: mono-carboxy-isononly phthalate; MCPP: mono (3-carboxypropyl) phthalate.
aAdjusted model 1: adjusted for gender, age; bAdjusted model 2: adjusted for gender, age, BMI, marital status, smoking, alcohol, food storage, and consumption of plastic pack drink, large fish and tuna, fish, crustacean, seaweed, other seafood items; cAdjusted model 3: adjusted for age, BMI, marital status, smoking, alcohol, food storage, and consumption of plastic pack drink, large fish and tuna, fish, crustacean, seaweed, other seafood items.
DISCUSSION
The adult participants in this study exhibited significantly higher ORs for MEOHP, MECPP, ∑DEHP and for MCOP, MCNP, and MCPP, which are high-molecular-weight phthalate metabolites. Among them, DEHP may induce thyroid hormones abnormality and affect the development of male reproductive organs and increasing the risk of hypertension.23,24,25 In addition, MCNP and MCOP are known to aggravate allergic dermatitis or asthma and damage the liver or kidney and MCPP can induce abnormalities in male reproductive organs.26,27,28,29,30,31,32 As there is no previous study on the association between shellfish consumption and phthalate exposure in Korea, MEOHP, MECPP, ∑DEHP, MCOP, MCNP, and MCPP can serve as valuable indicators in future assessments of phthalate exposure based on shellfish consumption.
In a study involving pregnant women in Taiwan, the MnBP concentration was higher in shellfish consumption more frequently in line with the findings of this study.33 In previous studies, high concentrations of phthalates were detected in shellfish, which were mentioned to be associated with microplastics.34,35 Recently, contamination of seafood by microplastics has become of great interest. While microplastics are mainly found in the gastrointestinal tracts and gills of seafood, most people eat the flesh of seafood after the removing the gastrointestinal tracts and gills of both common fish and large fish. In contrast, in the case of shellfish, most people eat the entire shellfish, including the gastrointestinal tracts and gills.36 Therefore, the exposure to microplastics may be higher with shellfish consumption than with the other seafood consumption.37 In this study, the high concentrations of urinary phthalate metabolites were attributed to the consumption of large amounts of phthalates in microplastics via shellfish consumption.
In this study, shellfish are defined as mollusks such as clams, mussels, oysters, abalones, conch shells, and whelks. Shellfish are well-known indicators of contamination by microplastics as they are found in any part of the sea in abundance and allow easy detection and quantification of marine contaminants.16,17,18,19 Microplastics are synthetic polymeric particles measuring less than 5 mm in diameter.38 Human exposure to microplastics can occur through various routes, including oral intake, inhalation, and skin contact.39 Plastics that enter the sea degrade into microplastics in time35; the microplastics are then ingested by marine organisms,40,41 and notably, a high level of microplastics has been detected in shellfish. Hence, it is possible that human ingest microplastics via shellfish consumption.42,43,44
In a study conducted in China, microplastics were detected in 233 of 290 shellfish samples (80%).19 According to another study on microplastics in seafood sample, the number of microplastics in shellfish are highest compared to crustaceans and fish (0.1–8.6 MPs/g for crustaceans, 0–2.9 for fish, and 0–10.5 for shellfish).36 A large amount of microplastics is accumulated in shellfish as the shellfish are filter-feeders that pump only the seawater out by ciliary action of gills after the ingestion of microplastics.16,17,45 As a result, shellfish have higher a content of microplastics per weight than other types of seafood, which makes shellfish a reliable indicator of the level of contamination of seawater by microplastics.
When phthalate concentration was measured for microplastics collected in the eastern Mediterranean Sea and Red Sea, the maximum levels were 6 µg/g dw for DBP and 13 µg/g dw for DEHP.46 On analyzing the microplastics from the northern shores of China, it was found that microplastics and phthalates had a strong positive correlation.47 In Korea, the report of the Korea Institute of Ocean Science & Technology stated that the mean concentration of microplastics across 18 shores was 1,841 MPs/m3 and phthalates were detected in the analyses of those microplastics.48 Phthalates have a high octanol/water partition coefficient to indicate high hydrophobicity such that they exhibit a high level of affinity with the microplastics considering their hydrophobic surface.49,50,51 In addition, the NaCl content of seawater produces a salting-out effect that increases the strength of affinity between hydrophobic substances. Therefore, seawater can make the strong affinity between microplastics and phthalates. Hence, seawater may contain higher levels of phthalates in microplastics than other natural environments.52 According to a previous study on microplastics detected in shellfish, fish, and holothurians collected from a protected marine area in the Mediterranean Sea, the level of DEHP was the highest in shellfish and the lowest in fish flesh.53 In conclusion, compared with other seafood types, shellfish contain an abundance of microplastics as well as phthalates.
In each country, the use of phthalates is strictly regulated. The Food and Drug Administration in the U.S. restricts the use of phthalates in food packaging materials, cosmetics, and drugs.54 The regulation in Korea restricts the use of phthalates in hygiene items, packaging containers, cosmetics, and medical devices. Nevertheless, the risk of phthalate exposure through shellfish consumption is not yet clearly understood. The possibility that humans can be exposed to phthalates through shellfish consumption should not be overlooked and continuous research and monitoring are needed in this regard.
There are some limitations to this study. First, while this study focused on the frequency of shellfish consumption, detailed information such as the amount and cooking method could not be analyzed. In this study, unlike in men, no relationship was observed between shellfish consumption and urinary phthalate concentrations in women, as it is assumed that women consume less amount of shellfish than men. Second, this study could not evaluate work environments such as personal protective equipment, ventilation system, and kind of exposed chemicals, so occupational factor possibility of phthalate exposure due to occupation was not taken into account. Third, as the consumption frequency was based on the memory recall of the participants, the risk of inaccuracy cannot be ruled out. Fourth, only the concentrations of phthalate metabolites in single urine samples were analyzed such that there is a possibility of concentration variability. Hence, it is necessary to change the method of sample collection to 24-hour urine sample collection or analysis of blood concentrations.
To the best of our knowledge, not many studies have reported on the association of shellfish consumption with urinary levels of phthalate metabolites, with no such study published in Korea. Thus, despite the limitations, the significance of this study lies in its analysis of the data of a sample representing the general population in Korea to examine the association between the levels of shellfish consumption and urinary phthalate metabolites concentrations.
Based on the results of this study, the phthalate concentration in shellfish should be continuously monitored as part of efforts to prevent phthalate exposure in the general population, and plastic pollution of marine ecosystems should be proactively and urgently managed. Furthermore, as phthalates are detected in a variety of environments, additional studies should be conducted to identify the association with the pollution of environments other than marine ecosystems (e.g., food contamination in relation to soil contamination and others).
CONCLUSIONS
In this study, the association of urinary phthalate metabolites concentrations with shellfish, as a representative indicator of marine ecosystem pollution, was identified in the general population in Korea. The concentrations of urinary phthalate metabolites (MEOHP, MECPP, ∑DEHP, MCOP, MCNP, and MCPP) were high in adults who frequently consumed shellfish.
Acknowledgements
We appreciate National Institute of Environmental Research making available the raw data of Korean National Environmental Health Survey.
Abbreviations
BMI
body mass index
BzBP
butyl benzyl phthalate
CI
confidence interval
DBP
di-n-butyl phthalate
DEHP
di-2-ethylhexyl phthalate
DEP
diethyl phthalate
DiBP
di-iso-butyl phthalate
DIDP
di-iso-decyl phthalate
DINP
di-iso-nonylphthalate
DMP
dimethyl phthalate
DPHP
di-2-propylheptyl phthalate
KoNEHS
Korean National Environmental Health Survey
MBzP
mono-benzyl phthalate
MCNP
mono-carboxy-isononly phthalate
MCOP
mono-carboxyoctyl phthalate
MCPP
mono (3-carboxypropyl) phthalate
MECPP
mono-(2-ethyl-5-carboxypentyl) phthalate
MEHHP
mono-(2-ethyl-5-hydroxyhexyl) phthalate
MEOHP
mono-(2-ethyl-5-oxohexyl) phthalate
MnBP
mono-n-butyl phthalate
OR
odds ratio
-
Funding: This research was supported by the Soonchunhyang University Research Fund and Inha University Hospital’s Environmental Health Center for Training Environmental Medicine Professionals funded by the Ministry of Environment, Republic of Korea (2022).
-
Competing interests: The authors declare that they have no competing interests.
-
Author contributions:
NOTES
- 1. Campanale C, Massarelli C, Savino I, Locaputo V, Uricchio VF. A detailed review study on potential effects of microplastics and additives of concern on human health. Int J Environ Res Public Health 2020;17(4):1212. 32069998.ArticlePubMedPMC
- 2. Hong SK, Nam HS, Jung KK, Kang IH, Kim TS, Cho SE, et al. Development and validation of on-line column switching HPLC-MS/MS method for 10 phthalate metabolites in human urine. J Environ Health Sci 2010;36(6):510–517.Article
- 3. Schettler T. Human exposure to phthalates via consumer products. Int J Androl 2006;29(1):134–139. 16466533.ArticlePubMed
- 4. Choi J, Kim J, Choi G, Kim K. Relationship between dietary habits and urinary phthalate mtabolite concentrations in elementary school children. J Environ Health Sci 2018;44(5):433–443.
- 5. Duty SM, Silva MJ, Barr DB, Brock JW, Ryan L, Chen Z, et al. Phthalate exposure and human semen parameters. Epidemiology 2003;14(3):269–277. 12859026.ArticlePubMed
- 6. Yuan G, Zeng Y, Hu G, Liu Y, Wei L, Liu P, et al. Inverse association of certain seminal phthalate metabolites with semen quality may be mediated by androgen synthesis: a cross-sectional study from the South China. Environ Int 2021;151:106459. 33684682.ArticlePubMed
- 7. Wang Y, Qian H. Phthalates and their impacts on human health. Healthcare (Basel) 2021;9(5):603. 34069956.ArticlePubMedPMC
- 8. Jobling S, Reynolds T, White R, Parker MG, Sumpter JP. A variety of environmentally persistent chemicals, including some phthalate plasticizers, are weakly estrogenic. Environ Health Perspect 1995;103(6):582–587. 7556011.ArticlePubMedPMC
- 9. López-Carrillo L, Hernández-Ramírez RU, Calafat AM, Torres-Sánchez L, Galván-Portillo M, Needham LL, et al. Exposure to phthalates and breast cancer risk in northern Mexico. Environ Health Perspect 2010;118(4):539–544. 20368132.ArticlePubMedPMC
- 10. Mughees M, Chugh H, Wajid S. Mechanism of phthalate esters in the progression and development of breast cancer. Drug Chem Toxicol 2022;45(3):1021–1025. 32752895.ArticlePubMed
- 11. Lind PM, Zethelius B, Lind L. Circulating levels of phthalate metabolites are associated with prevalent diabetes in the elderly. Diabetes Care 2012;35(7):1519–1524. 22498808.ArticlePubMedPMCPDF
- 12. Kim SH, Park MJ. Phthalate exposure and childhood obesity. Ann Pediatr Endocrinol Metab 2014;19(2):69–75. 25077088.ArticlePubMedPMC
- 13. Wittassek M, Angerer J. Phthalates: metabolism and exposure. Int J Androl 2008;31(2):131–138. 18070048.ArticlePubMed
- 14. Teitelbaum SL, Britton JA, Calafat AM, Ye X, Silva MJ, Reidy JA, et al. Temporal variability in urinary concentrations of phthalate metabolites, phytoestrogens and phenols among minority children in the United States. Environ Res 2008;106(2):257–269. 17976571.ArticlePubMed
- 15. Hidalgo-Serrano M, Borrull F, Marcé RM, Pocurull E. Phthalate esters in marine ecosystems: analytical methods, occurrence and distribution. Trends Analyt Chem 2022;151:116598.Article
- 16. Li J, Lusher AL, Rotchell JM, Deudero S, Turra A, Bråte IL, et al. Using mussel as a global bioindicator of coastal microplastic pollution. Environ Pollut 2019;244:522–533. 30368156.ArticlePubMed
- 17. Li J, Qu X, Su L, Zhang W, Yang D, Kolandhasamy P, et al. Microplastics in mussels along the coastal waters of China. Environ Pollut 2016;214:177–184. 27086073.ArticlePubMed
- 18. Bartolomé L, Etxebarria N, Martínez-Arkarazo I, Raposo JC, Usobiaga A, Zuloaga O, et al. Distribution of organic microcontaminants, butyltins, and metals in mussels from the Estuary of Bilbao. Arch Environ Contam Toxicol 2010;59(2):244–254. 20101400.ArticlePubMedPDF
- 19. Ding J, Sun C, He C, Li J, Ju P, Li F. Microplastics in four bivalve species and basis for using bivalves as bioindicators of microplastic pollution. Sci Total Environ 2021;782:146830. 33838364.ArticlePubMed
- 20. Korean National Institute of Environmental Research. Guidelines for Using Raw Materials for Korean National Environmental Health Survey (Adult) - The Third Stage (‘15~‘17). Incheon: Korean National Institute of Environmental Research; 2019, 5–31.
- 21. Korean National Institute of Environmental Research. Environmental Hazardous Materials Analysis Manual (Organic compounds) in Korean National Environmental Health Survey (Adult) - The Third Stage (‘15~‘17). Incheon: Korean National Institute of Environmental Research; 2019, 36–59.
- 22. Kim Y, Park M, Nam DJ, Yang EH, Ryoo JH. Relationship between seafood consumption and bisphenol A exposure: the Second Korean National Environmental Health Survey (KoNEHS 2012-2014). Ann Occup Environ Med 2020;32(1):e10. 32411375.ArticlePubMedPMCPDF
- 23. Jia PP, Ma YB, Lu CJ, Mirza Z, Zhang W, Jia YF, et al. The effects of disturbance on Hypothalamus-Pituitary-Thyroid (HPT) axis in zebrafish larvae after exposure to DEHP. PLoS One 2016;11(5):e0155762. 27223697.ArticlePubMedPMC
- 24. Shelby MD. NTP-CERHR monograph on the potential human reproductive and developmental effects of di (2-ethylhexyl) phthalate (DEHP). NTP CERHR MON 2006;(18):v. vii-7. II-iii-xiii passim. 19407857.PubMed
- 25. Xie X, Deng T, Duan J, Ding S, Yuan J, Chen M. Comparing the effects of diethylhexyl phthalate and dibutyl phthalate exposure on hypertension in mice. Ecotoxicol Environ Saf 2019;174:75–82. 30822670.ArticlePubMed
- 26. North ML, Takaro TK, Diamond ML, Ellis AK. Effects of phthalates on the development and expression of allergic disease and asthma. Ann Allergy Asthma Immunol 2014;112(6):496–502. 24726194.ArticlePubMed
- 27. Chen Y, Li C, Song P, Yan B, Yang X, Wu Y, et al. Hepatic and renal tissue damage in Balb/c mice exposed to diisodecyl phthalate: the role of oxidative stress pathways. Food Chem Toxicol 2019;132:110600. 31228599.ArticlePubMed
- 28. Qin W, Deng T, Cui H, Zhang Q, Liu X, Yang X, et al. Exposure to diisodecyl phthalate exacerbated Th2 and Th17-mediated asthma through aggravating oxidative stress and the activation of p38 MAPK. Food Chem Toxicol 2018;114:78–87. 29448086.ArticlePubMed
- 29. Shen S, Li J, You H, Wu Z, Wu Y, Zhao Y, et al. Oral exposure to diisodecyl phthalate aggravates allergic dermatitis by oxidative stress and enhancement of thymic stromal lymphopoietin. Food Chem Toxicol 2017;99:60–69. 27871981.ArticlePubMed
- 30. Koike E, Yanagisawa R, Sadakane K, Inoue K, Ichinose T, Takano H. Effects of diisononyl phthalate on atopic dermatitis in vivo and immunologic responses in vitro. Environ Health Perspect 2010;118(4):472–478. 20064775.ArticlePubMedPMC
- 31. Ma P, Yan B, Zeng Q, Liu X, Wu Y, Jiao M, et al. Oral exposure of Kunming mice to diisononyl phthalate induces hepatic and renal tissue injury through the accumulation of ROS. Protective effect of melatonin. Food Chem Toxicol 2014;68:247–256. 24685826.ArticlePubMed
- 32. Han Z, Xue J, Li Y. Phthalate’s multiple hormonal effects and their supplementary dietary regulation scheme of health risks for children. Environ Sci Pollut Res Int 2022;29(19):29016–29032. 34993781.ArticlePubMedPDF
- 33. Tsai CK, Cheng HH, Hsu TY, Wang JY, Hung CH, Tsai CC, et al. Prenatal exposure to di-ethyl phthalate (DEP) is related to increasing neonatal IgE levels and the altering of the immune polarization of helper-T cells. Int J Environ Res Public Health 2021;18(12):6364. 34208324.ArticlePubMedPMC
- 34. Muñoz-Ortuño M, Moliner-Martínez Y, Cogollos-Costa S, Herráez-Hernández R, Campíns-Falcó P. A miniaturized method for estimating di(2-ethylhexyl) phthalate in bivalves as bioindicators. J Chromatogr A 2012;1260:169–173. 22995194.ArticlePubMed
- 35. Puy-Azurmendi E, Ortiz-Zarragoitia M, Kuster M, Martínez E, Guillamón M, Domínguez C, et al. An integrated study of endocrine disruptors in sediments and reproduction-related parameters in bivalve molluscs from the Biosphere’s Reserve of Urdaibai (Bay of Biscay). Mar Environ Res 2010;69(Suppl):S63–S66. 19913907.ArticlePubMed
- 36. Danopoulos E, Jenner LC, Twiddy M, Rotchell JM. Microplastic contamination of seafood intended for human consumption: a systematic review and meta-analysis. Environ Health Perspect 2020;128(12):126002. 33355482.ArticlePubMedPMC
- 37. Akoueson F, Sheldon LM, Danopoulos E, Morris S, Hotten J, Chapman E, et al. A preliminary analysis of microplastics in edible versus non-edible tissues from seafood samples. Environ Pollut 2020;263(Pt A):114452. 32302891.ArticlePubMed
- 38. Ivleva NP, Wiesheu AC, Niessner R. Microplastic in aquatic ecosystems. Angew Chem Int Ed Engl 2017;56(7):1720–1739. 27618688.ArticlePubMedPDF
- 39. Pironti C, Ricciardi M, Motta O, Miele Y, Proto A, Montano L. Microplastics in the environment: intake through the food web, human exposure and toxicological effects. Toxics 2021;9(9):224. 34564375.ArticlePubMedPMC
- 40. Andrady AL. Microplastics in the marine environment. Mar Pollut Bull 2011;62(8):1596–1605. 21742351.ArticlePubMed
- 41. Sharma S, Chatterjee S. Microplastic pollution, a threat to marine ecosystem and human health: a short review. Environ Sci Pollut Res Int 2017;24(27):21530–21547. 28815367.ArticlePubMedPDF
- 42. Dawson AL, Santana MF, Miller ME, Kroon FJ. Relevance and reliability of evidence for microplastic contamination in seafood: a critical review using Australian consumption patterns as a case study. Environ Pollut 2021;276:116684. 33618116.ArticlePubMed
- 43. Smith M, Love DC, Rochman CM, Neff RA. Microplastics in seafood and the implications for human health. Curr Environ Health Rep 2018;5(3):375–386. 30116998.ArticlePubMedPMCPDF
- 44. Van Cauwenberghe L, Janssen CR. Microplastics in bivalves cultured for human consumption. Environ Pollut 2014;193:65–70. 25005888.ArticlePubMed
- 45. Dwiyitno , Dsikowitzky L, Nordhaus I, Andarwulan N, Irianto HE, Lioe HN, et al. Accumulation patterns of lipophilic organic contaminants in surface sediments and in economic important mussel and fish species from Jakarta Bay, Indonesia. Mar Pollut Bull 2016;110(2):767–777. 26853592.ArticlePubMed
- 46. Vered G, Kaplan A, Avisar D, Shenkar N. Using solitary ascidians to assess microplastic and phthalate plasticizers pollution among marine biota: a case study of the Eastern Mediterranean and Red Sea. Mar Pollut Bull 2019;138:618–625. 30660313.ArticlePubMed
- 47. Liu Y, Li Z, Jalón-Rojas I, Wang XH, Fredj E, Zhang D, et al. Assessing the potential risk and relationship between microplastics and phthalates in surface seawater of a heavily human-impacted metropolitan bay in northern China. Ecotoxicol Environ Saf 2020;204:111067. 32745786.ArticlePubMed
- 48. Im JY, Lee JW, Lee DJ, Lee SM, Gil GI. . Current status and impact of microplastics in Korea. Water Future 2019;52(9):17–22.
- 49. Gao B, Wang P, Zhou H, Zhang Z, Wu F, Jin J, et al. Sorption of phthalic acid esters in two kinds of landfill leachates by the carbonaceous sorbents. Bioresour Technol 2013;136:295–301. 23567694.ArticlePubMed
- 50. Ghaffar A, Ghosh S, Li F, Dong X, Zhang D, Wu M, et al. Effect of biochar aging on surface characteristics and adsorption behavior of dialkyl phthalates. Environ Pollut 2015;206:502–509. 26281762.ArticlePubMed
- 51. Rios LM, Jones PR, Moore C, Narayan UV. Quantitation of persistent organic pollutants adsorbed on plastic debris from the Northern Pacific Gyre’s “eastern garbage patch”. J Environ Monit 2010;12(12):2226–2236. 21042605.ArticlePubMed
- 52. Liu FF, Liu GZ, Zhu ZL, Wang SC, Zhao FF. Interactions between microplastics and phthalate esters as affected by microplastics characteristics and solution chemistry. Chemosphere 2019;214:688–694. 30292051.ArticlePubMed
- 53. Rios-Fuster B, Alomar C, Paniagua González G, Garcinuño Martínez RM, Soliz Rojas DL, Fernández Hernando P, et al. Assessing microplastic ingestion and occurrence of bisphenols and phthalates in bivalves, fish and holothurians from a Mediterranean marine protected area. Environ Res 2022;214(Pt 3):114034. 35948144.ArticlePubMed
- 54. Environmental Protection Agency (EPA). Phthalates Action Plan. Washington, D.C., USA: Environmental Protection Agency; 2012.
REFERENCES
REFERENCES
Figure & Data
REFERENCES
Citations
Citations to this article as recorded by 
- Filling gaps in population estimates of phthalate exposure globally: A systematic review and meta-analysis of international biomonitoring data
Jonathan M. Acevedo, Linda G. Kahn, Kristyn A. Pierce, Vittorio Albergamo, Anna Carrasco, Robbie S.J. Manuel, Marissa Singer Rosenberg, Leonardo Trasande
International Journal of Hygiene and Environmental Health.2025; 265: 114539. CrossRef - Urinary phthalate metabolites and heart rate variability: A panel study
Ziqian Zhang, Miao Liu, Lei Zhao, Linlin Liu, Wenting Guo, Jie Yu, Huihua Yang, Xuefeng Lai, Xiaomin Zhang, Liangle Yang
Environmental Pollution.2023; 330: 121760. CrossRef - Microplastics induced inflammation and apoptosis via ferroptosis and the NF-κB pathway in carp
Tianchao Xu, Jie Cui, Ran Xu, Jingwen Cao, Meng-yao Guo
Aquatic Toxicology.2023; 262: 106659. CrossRef - Relationship between the use of plastics in refrigerator food storage and urine phthalate metabolites: the Korean National Environmental Health Survey (KoNEHS) cycle 3
Jisoo Kang, Seong-yong Cho, Seongyong Yoon
Annals of Occupational and Environmental Medicine.2023;[Epub] CrossRef
 Cite
Cite- Figure
-
- Related articles
-
- Association between heavy metal exposure and high-sensitivity C-reactive protein in the elderly: Korea National Health and Nutrition Examination Survey (KNHANES) 2016–2017
- Association between outdoor clothing use and serum perfluoroalkyl substances (PFAS): Korean National Environmental Health Survey cycle 4
- Relationship between the use of hair products and urine benzophenone-3: the Korean National Environmental Health Survey (KoNEHS) cycle 4
- Relationship between crustacean consumption and serum perfluoroalkyl substances (PFAS): the Korean National Environmental Health Survey (KoNEHS) cycle 4
- Association between serum perfluoroalkyl substances concentrations and non-alcoholic fatty liver disease among Korean adults: a cross-sectional study using the National Environmental Health Survey cycle 4
Relationship between shellfish consumption and urinary phthalate metabolites: Korean National Environmental Health Survey (KoNEHS) cycle 3 (2015-2017)
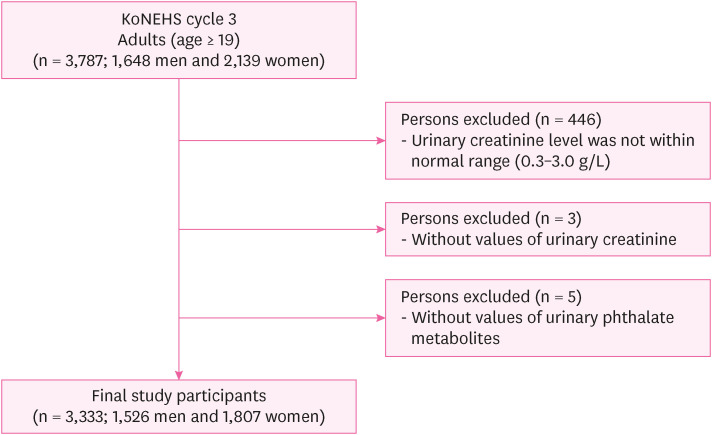
Fig. 1 Flow chart of the selection of study participants.KoNEHS: Korean National Environmental Health Survey.
Fig. 1
Relationship between shellfish consumption and urinary phthalate metabolites: Korean National Environmental Health Survey (KoNEHS) cycle 3 (2015-2017)
| Category | Total (n = 3,333) | Men (n = 1,526) | Women (n = 1,807) | ||
|---|---|---|---|---|---|
| Urinary phthalate metabolites | |||||
| MEHHP (µg/g Cr) | 18.2 (10.7–30.3) | 15.6 (9.1–25.1) | 20.8 (12.3–34.5) | 0.004 | |
| MEOHP (µg/g Cr) | 13.5 (7.8–23.6) | 11.3 (6.7–19.5) | 16.1 (9.3–27.1) | 0.143 | |
| MECPP (µg/g Cr) | 27.6 (16.4–51.8) | 22.8 (13.7–42.9) | 32.1 (19.2–61.4) | < 0.001 | |
| ∑DEHP (µg/g Cr) | 61.0 (37.7–106.8) | 51.2 (31.6–88.1) | 71.6 (43.8–122.8) | 0.002 | |
| MnBP (µg/g Cr) | 31.8 (16.8–56.7) | 27.4 (14.7–49.1) | 35.1 (19.3–62.3) | 0.132 | |
| MBzP (µg/g Cr) | 2.7 (1.4–5.4) | 2.4 (1.2–4.8) | 3.0 (1.5–6.0) | 0.003 | |
| MCOP (µg/g Cr) | 1.1 (0.6–1.9) | 1.0 (0.6–1.7) | 1.3 (0.7–2.2) | 0.001 | |
| MCNP (µg/g Cr) | 0.5 (0.2–0.8) | 0.4 (0.2–0.7) | 0.5 (0.2–1.0) | < 0.001 | |
| MCPP (µg/g Cr) | 1.1 (0.7–1.9) | 1.0 (0.6–1.6) | 1.3 (0.9–2.2) | 0.298 | |
| Age (yr) | 52.9 ± 14.8 | 52.8 ± 15.1 | 53.0 ± 14.6 | 0.687 | |
| BMI (kg/m2) | < 0.001b | ||||
| Normal | 1,919 (57.6) | 809 (53.0) | 1,110 (61.4) | ||
| Overweight | 1,414 (42.4) | 717 (47.0) | 697 (38.6) | ||
| Marital status | < 0.001 | ||||
| Single | 371 (11.1) | 223 (14.6) | 148 (8.2) | ||
| Married | 2,583 (77.5) | 1,225 (80.3) | 1,358 (75.2) | ||
| Others | 379 (11.4) | 78 (5.1) | 301 (16.7) | ||
| Smoking | < 0.001 | ||||
| None or ex-smoker | 2,777 (83.3) | 1,021 (66.9) | 1,756 (97.2) | ||
| Current smoker | 556 (16.7) | 505 (33.1) | 51 (2.8) | ||
| Alcohol | < 0.001 | ||||
| None | 673 (20.2) | 138 (9.0) | 535 (29.6) | ||
| Moderate | 2,330 (69.9) | 1,100 (72.1) | 1,230 (68.1) | ||
| Heavy | 330 (9.9) | 288 (18.9) | 42 (2.3) | ||
| Food storage | 0.339 | ||||
| Plastic bag or zipper bag | 2,946 (88.4) | 1,340 (87.8) | 1,606 (88.9) | ||
| Others | 387 (11.6) | 186 (12.2) | 201 (11.1) | ||
| Plastic pack drink | 0.140 | ||||
| ≤ Once a week | 2,450 (73.5) | 1,103 (72.3) | 1,347 (74.5) | ||
| > Once a week | 883 (26.5) | 423 (27.7) | 460 (25.5) | ||
| Shellfish | 0.591 | ||||
| ≤ Once a week | 3,135 (94.1) | 1,439 (94.3) | 1,696 (93.9) | ||
| > Once a week | 198 (5.9) | 87 (5.7) | 111 (6.1) | ||
| Large fish and tuna | 0.017 | ||||
| ≤ Once a week | 3,232 (97.0) | 1,468 (96.2) | 1,764 (97.6) | ||
| > Once a week | 101 (3.0) | 58 (3.8) | 43 (2.4) | ||
| Fish | 0.369 | ||||
| ≤ Once a week | 2,341 (70.2) | 1,060 (69.5) | 1,281 (70.9) | ||
| > Once a week | 992 (29.8) | 466 (30.5) | 526 (29.1) | ||
| Crustacean | 0.613 | ||||
| ≤ Once a week | 3,218 (96.5) | 1,476 (96.7) | 1,742 (96.4) | ||
| > Once a week | 115 (3.5) | 50 (3.3) | 65 (3.6) | ||
| Seaweed | 0.093 | ||||
| ≤ Once a week | 1,370 (41.1) | 651 (42.7) | 719 (39.8) | ||
| > Once a week | 1,963 (58.9) | 875 (57.3) | 1,088 (60.2) | ||
| Other seafood items | 0.647 | ||||
| ≤ Once a week | 3,171 (95.1) | 1,449 (95.0) | 1,722 (95.3) | ||
| > Once a week | 162 (4.9) | 77 (5.0) | 85 (4.7) | ||
| Category | MEHHP | MEOHP | MECPP | |||||||
|---|---|---|---|---|---|---|---|---|---|---|
| Low (n = 2,499) | High (n = 834) | Low (n = 2,500) | High (n = 833) | Low (n = 2,500) | High (n = 833) | |||||
| Age (yr) | 50.9 ± 14.9 | 58.8 ± 13.0 | < 0.001 | 51.3 ± 14.9 | 57.7 ± 13.7 | < 0.001 | 51.5 ± 14.8 | 57.1 ± 14.0 | < 0.001a | |
| Gender | < 0.001 | < 0.001 | < 0.001b | |||||||
| Men | 1,241 (81.3) | 285 (18.7) | 1,252 (82.0) | 274 (18.0) | 1,248 (81.8) | 278 (18.2) | ||||
| Women | 1,258 (69.6) | 549 (30.4) | 1,248 (69.1) | 559 (30.9) | 1,252 (69.3) | 555 (30.7) | ||||
| BMI | 0.458 | 0.846 | 0.961 | |||||||
| Normal | 1,448 (75.5) | 471 (24.5) | 1,437 (74.9) | 482 (25.1) | 1,440 (75.0) | 479 (25.0) | ||||
| Overweight | 1,051 (74.3) | 363 (25.7) | 1,063 (75.2) | 351 (24.8) | 1,060 (75.0) | 354 (25.0) | ||||
| Marital status | < 0.001 | < 0.001 | < 0.001 | |||||||
| Single | 324 (87.3) | 47 (12.7) | 319 (86.0) | 52 (14.0) | 307 (82.7) | 64 (17.3) | ||||
| Married | 1,953 (75.6) | 630 (24.4) | 1,939 (75.1) | 644 (24.9) | 1,956 (75.7) | 627 (24.3) | ||||
| Others | 222 (58.6) | 157 (41.4) | 242 (63.9) | 137 (36.1) | 237 (62.5) | 142 (37.5) | ||||
| Smoking | 0.001 | < 0.001 | < 0.001 | |||||||
| None or ex-smoker | 2,052 (73.9) | 725 (26.1) | 2,036 (73.3) | 741 (26.7) | 2,029 (73.1) | 748 (26.9) | ||||
| Current smoker | 447 (80.4) | 109 (19.6) | 464 (83.5) | 92 (16.5) | 471 (84.7) | 85 (15.3) | ||||
| Alcohol | < 0.001 | < 0.001 | 0.001 | |||||||
| None | 456 (67.8) | 217 (32.2) | 455 (67.6) | 218 (32.4) | 470 (69.8) | 203 (30.2) | ||||
| Moderate | 1,786 (76.7) | 544 (23.3) | 1,772 (76.1) | 558 (23.9) | 1,766 (75.8) | 564 (24.2) | ||||
| Heavy | 257 (77.9) | 73 (22.1) | 273 (82.7) | 57 (17.3) | 264 (80.0) | 66 (20.0) | ||||
| Food storage | < 0.001 | 0.005 | 0.002 | |||||||
| Plastic bag or zipper bag | 2,181 (74.0) | 765 (26.0) | 2,187 (74.2) | 759 (25.8) | 2,185 (74.2) | 761 (25.8) | ||||
| Others | 318 (82.2) | 69 (17.8) | 313 (80.9) | 74 (19.1) | 315 (81.4) | 72 (18.6) | ||||
| Plastic pack drink | 0.019 | 0.486 | 0.215 | |||||||
| ≤ Once a week | 1,811 (73.9) | 639 (26.1) | 1,830 (74.7) | 620 (25.3) | 1,824 (74.4) | 626 (25.6) | ||||
| > Once a week | 688 (77.9) | 195 (22.1) | 670 (75.9) | 213 (24.1) | 676 (76.6) | 207 (23.4) | ||||
| Shellfish | 0.442 | 0.552 | 0.051 | |||||||
| ≤ Once a week | 2,346 (74.8) | 789 (25.2) | 2,355 (75.1) | 780 (24.9) | 2,363 (75.4) | 772 (24.6) | ||||
| > Once a week | 153 (77.3) | 45 (22.7) | 145 (73.2) | 53 (26.8) | 137 (69.2) | 61 (30.8) | ||||
| Large fish and tuna | 0.143 | 0.449 | 0.221 | |||||||
| ≤ Once a week | 2,417 (74.8) | 815 (25.2) | 2,421 (74.9) | 811 (25.1) | 2,419 (74.8) | 813 (25.2) | ||||
| > Once a week | 82 (81.2) | 19 (18.8) | 79 (78.2) | 22 (21.8) | 81 (80.2) | 20 (19.8) | ||||
| Fish | 0.285 | 0.731 | 0.160 | |||||||
| ≤ Once a week | 1,743 (74.5) | 598 (25.5) | 1,752 (74.8) | 589 (25.2) | 1,772 (75.7) | 569 (24.3) | ||||
| > Once a week | 756 (76.2) | 236 (23.8) | 748 (75.4) | 244 (24.6) | 728 (73.4) | 264 (26.6) | ||||
| Crustacean | 0.543 | 0.703 | 0.871 | |||||||
| ≤ Once a week | 2,410 (74.9) | 808 (25.1) | 2,412 (75.0) | 806 (25.0) | 2,413 (75.0) | 805 (25.0) | ||||
| > Once a week | 89 (77.4) | 26 (22.6) | 88 (76.5) | 27 (23.5) | 87 (75.7) | 28 (24.3) | ||||
| Seaweed | 0.041 | 0.305 | 0.832 | |||||||
| ≤ Once a week | 1,002 (73.1) | 368 (26.9) | 1,015 (74.1) | 355 (25.9) | 1,025 (74.8) | 345 (25.2) | ||||
| > Once a week | 1,497 (76.3) | 466 (23.7) | 1,485 (75.6) | 478 (24.4) | 1,475 (75.1) | 488 (24.9) | ||||
| Other seafood items | 0.520 | 0.404 | 0.051 | |||||||
| ≤ Once a week | 2,381 (75.1) | 790 (24.9) | 2,374 (74.9) | 797 (25.1) | 2,389 (75.3) | 782 (24.7) | ||||
| > Once a week | 118 (72.8) | 44 (27.2) | 126 (77.8) | 36 (22.2) | 111 (68.5) | 51 (31.5) | ||||
| Category | ∑DEHP | MnBP | MBzP | |||||||
|---|---|---|---|---|---|---|---|---|---|---|
| Low (n = 2,499) | High (n = 834) | Low (n = 2,500) | High (n = 833) | Low (n = 2,499) | High (n = 834) | |||||
| Age (yr) | 51.3 ± 14.9 | 57.7 ± 13.5 | < 0.001 | 51.5 ± 14.9 | 57.1 ± 13.8 | < 0.001 | 51.5 ± 14.8 | 56.9 ± 14.2 | < 0.001a | |
| Gender | < 0.001 | < 0.001 | < 0.001b | |||||||
| Men | 1,248 (81.8) | 278 (18.2) | 1,214 (79.6) | 312 (20.4) | 1,201 (78.7) | 325 (21.3) | ||||
| Women | 1,251 (69.2) | 556 (30.8) | 1,286 (71.2) | 521 (28.8) | 1,298 (71.8) | 509 (28.2) | ||||
| BMI | 0.508 | 0.722 | 0.410 | |||||||
| Normal | 1,447 (75.4) | 472 (24.6) | 1,435 (74.8) | 484 (25.2) | 1,449 (75.5) | 470 (24.5) | ||||
| Overweight | 1,052 (74.4) | 362 (25.6) | 1,065 (75.3) | 349 (24.7) | 1,050 (74.3) | 364 (25.7) | ||||
| Marital status | < 0.001 | < 0.001 | 0.015 | |||||||
| Single | 319 (86.0) | 52 (14.0) | 305 (82.2) | 66 (17.8) | 293 (79.0) | 78 (21.0) | ||||
| Married | 1,946 (75.3) | 637 (24.7) | 1,937 (75.0) | 646 (25.0) | 1,941 (75.1) | 642 (24.9) | ||||
| Others | 234 (61.7) | 145 (38.3) | 258 (68.1) | 121 (31.9) | 265 (69.9) | 114 (30.1) | ||||
| Smoking | < 0.001 | < 0.001 | 0.018 | |||||||
| None or ex-smoker | 2,039 (73.4) | 738 (26.6) | 2,042 (73.5) | 735 (26.5) | 2,060 (74.2) | 717 (25.8) | ||||
| Current smoker | 460 (82.7) | 96 (17.3) | 458 (82.4) | 98 (17.6) | 439 (79.0) | 117 (21.0) | ||||
| Alcohol | < 0.001 | < 0.001 | < 0.001 | |||||||
| None | 453 (67.3) | 220 (32.7) | 473 (70.3) | 200 (29.7) | 464 (68.9) | 209 (31.1) | ||||
| Moderate | 1,780 (76.4) | 550 (23.6) | 1,756 (75.4) | 574 (24.6) | 1,770 (76.0) | 560 (24.0) | ||||
| Heavy | 266 (80.6) | 64 (19.4) | 271 (82.1) | 59 (17.9) | 265 (80.3) | 65 (19.7) | ||||
| Food storage | 0.013 | 0.972 | 0.270 | |||||||
| Plastic bag or zipper bag | 2,189 (74.3) | 757 (25.7) | 2,210 (75.0) | 736 (25.0) | 2,200 (74.7) | 746 (25.3) | ||||
| Others | 310 (80.1) | 77 (19.9) | 290 (74.9) | 97 (25.1) | 299 (77.3) | 88 (22.7) | ||||
| Plastic pack drink | 0.279 | 0.333 | 0.019 | |||||||
| ≤ Once a week | 1,825 (74.5) | 625 (25.5) | 1,827 (74.6) | 623 (25.4) | 1,811 (73.9) | 639 (26.1) | ||||
| > Once a week | 674 (76.3) | 209 (23.7) | 673 (76.2) | 210 (23.8) | 688 (77.9) | 195 (22.1) | ||||
| Shellfish | 0.451 | 0.798 | 0.678 | |||||||
| ≤ Once a week | 2,355 (75.1) | 780 (24.9) | 2,353 (75.1) | 782 (24.9) | 2,353 (75.1) | 782 (24.9) | ||||
| > Once a week | 144 (72.7) | 54 (27.3) | 147 (74.2) | 51 (25.8) | 146 (73.7) | 52 (26.3) | ||||
| Large fish and tuna | 0.143 | 0.091 | 0.090 | |||||||
| ≤ Once a week | 2,417 (74.8) | 815 (25.2) | 2,417 (74.8) | 815 (25.2) | 2,416 (74.8) | 816 (25.2) | ||||
| > Once a week | 82 (81.2) | 19 (18.8) | 83 (82.2) | 18 (17.8) | 83 (82.2) | 18 (17.8) | ||||
| Fish | 0.946 | 0.218 | 0.984 | |||||||
| ≤ Once a week | 1,756 (75.0) | 585 (25.0) | 1,770 (75.6) | 571 (24.4) | 1,755 (75.0) | 586 (25.0) | ||||
| > Once a week | 743 (74.9) | 249 (25.1) | 730 (73.6) | 262 (26.4) | 744 (75.0) | 248 (25.0) | ||||
| Crustacean | 0.961 | 0.014 | 0.789 | |||||||
| ≤ Once a week | 2,413 (75.0) | 805 (25.0) | 2,425 (75.4) | 793 (24.6) | 2,414 (75.0) | 804 (25.0) | ||||
| > Once a week | 86 (74.8) | 29 (25.2) | 75 (65.2) | 40 (34.8) | 85 (73.9) | 30 (26.1) | ||||
| Seaweed | 0.322 | < 0.001 | 0.027 | |||||||
| ≤ Once a week | 1,015 (74.1) | 355 (25.9) | 985 (71.9) | 385 (28.1) | 1,000 (73.0) | 370 (27.0) | ||||
| > Once a week | 1,484 (75.6) | 479 (24.4) | 1,515 (77.2) | 448 (22.8) | 1,499 (76.4) | 464 (23.6) | ||||
| Other seafood items | 0.931 | 0.928 | 0.511 | |||||||
| ≤ Once a week | 2,378 (75.0) | 793 (25.0) | 2,378 (75.0) | 793 (25.0) | 2,374 (74.9) | 797 (25.1) | ||||
| > Once a week | 121 (74.7) | 41 (25.3) | 122 (75.3) | 40 (24.7) | 125 (77.2) | 37 (22.8) | ||||
| Category | MCOP | MCNP | MCPP | |||||||
|---|---|---|---|---|---|---|---|---|---|---|
| Low (n = 2,499) | High (n = 834) | Low (n = 2,500) | High (n = 833) | Low (n = 2,500) | High (n = 833) | |||||
| Age (yr) | 52.8 ± 14.8 | 53.0 ± 14.9 | 0.802 | 52.4 ± 14.9 | 54.3 ± 14.7 | < 0.001 | 52.4 ± 14.9 | 54.4 ± 14.6 | < 0.001a | |
| Gender | < 0.001 | < 0.001 | < 0.001b | |||||||
| Men | 1,236 (81.0) | 290 (19.0) | 1,242 (81.4) | 284 (18.6) | 1,234 (80.9) | 292 (19.1) | ||||
| Women | 1,263 (69.9) | 544 (30.1) | 1,258 (69.6) | 549 (30.4) | 1,266 (70.1) | 541 (29.9) | ||||
| BMI | 0.008 | 0.001 | 0.007 | |||||||
| Normal | 1,406 (73.3) | 513 (26.7) | 1,400 (73.0) | 519 (27.0) | 1,406 (73.3) | 513 (26.7) | ||||
| Overweight | 1,093 (77.3) | 321 (22.7) | 1,100 (77.8) | 314 (22.2) | 1,094 (77.4) | 320 (22.6) | ||||
| Marital status | 0.166 | 0.009 | 0.027 | |||||||
| Single | 275 (74.1) | 96 (25.9) | 291 (78.4) | 80 (21.6) | 281 (75.7) | 90 (24.3) | ||||
| Married | 1,954 (75.6) | 629 (24.4) | 1,947 (75.4) | 636 (24.6) | 1,956 (75.7) | 627 (24.3) | ||||
| Others | 270 (71.2) | 109 (28.8) | 262 (69.1) | 117 (30.9) | 263 (69.4) | 116 (30.6) | ||||
| Smoking | < 0.001 | < 0.001 | < 0.001 | |||||||
| None or ex-smoker | 2,047 (73.7) | 730 (26.3) | 2,052 (73.9) | 725 (26.1) | 2,049 (73.8) | 728 (26.2) | ||||
| Current smoker | 452 (81.3) | 104 (18.7) | 448 (80.6) | 108 (19.4) | 451 (81.1) | 105 (18.9) | ||||
| Alcohol | 0.007 | < 0.001 | < 0.001 | |||||||
| None | 478 (71.0) | 195 (29.0) | 468 (69.5) | 205 (30.5) | 474 (70.4) | 199 (29.6) | ||||
| Moderate | 1,758 (75.5) | 572 (24.5) | 1,755 (75.3) | 575 (24.7) | 1,750 (75.1) | 580 (24.9) | ||||
| Heavy | 263 (79.7) | 67 (20.3) | 277 (83.9) | 53 (16.1) | 276 (83.6) | 54 (16.4) | ||||
| Food storage | 0.064 | 0.181 | 0.335 | |||||||
| Plastic bag or zipper bag | 2,194 (74.5) | 752 (25.5) | 2,199 (74.6) | 747 (25.4) | 2,202 (74.7) | 744 (25.3) | ||||
| Others | 305 (78.8) | 82 (21.2) | 301 (77.8) | 86 (22.2) | 298 (77.0) | 89 (23.0) | ||||
| Plastic pack drink | 0.860 | 0.290 | 0.380 | |||||||
| ≤ Once a week | 1,835 (74.9) | 615 (25.1) | 1,826 (74.5) | 624 (25.5) | 1,828 (74.6) | 622 (25.4) | ||||
| > Once a week | 664 (75.2) | 219 (24.8) | 674 (76.3) | 209 (23.7) | 672 (76.1) | 211 (23.9) | ||||
| Shellfish | 0.002 | 0.034 | < 0.001 | |||||||
| ≤ Once a week | 2,369 (75.6) | 766 (24.4) | 2,364 (75.4) | 771 (24.6) | 2,376 (75.8) | 759 (24.2) | ||||
| > Once a week | 130 (65.7) | 68 (34.3) | 136 (68.7) | 62 (31.3) | 124 (62.6) | 74 (37.4) | ||||
| Large fish and tuna | 0.182 | 0.322 | 0.041 | |||||||
| ≤ Once a week | 2,429 (75.2) | 803 (24.8) | 2,420 (74.9) | 812 (25.1) | 2,433 (75.3) | 799 (24.7) | ||||
| > Once a week | 70 (69.3) | 31 (30.7) | 80 (79.2) | 21 (20.8) | 67 (66.3) | 34 (33.7) | ||||
| Fish | 0.392 | 0.480 | 0.935 | |||||||
| ≤ Once a week | 1,765 (75.4) | 576 (24.6) | 1,764 (75.4) | 577 (24.6) | 1,755 (75.0) | 586 (25.0) | ||||
| > Once a week | 734 (74.0) | 258 (26.0) | 736 (74.2) | 256 (25.8) | 745 (75.1) | 247 (24.9) | ||||
| Crustacean | 0.789 | 0.351 | 0.351 | |||||||
| ≤ Once a week | 2,414 (75.0) | 804 (25.0) | 2,418 (75.1) | 800 (24.9) | 2,418 (75.1) | 800 (24.9) | ||||
| > Once a week | 85 (73.9) | 30 (26.1) | 82 (71.3) | 33 (28.7) | 82 (71.3) | 33 (28.7) | ||||
| Seaweed | 0.757 | 0.910 | 0.770 | |||||||
| ≤ Once a week | 1,031 (75.3) | 339 (24.7) | 1,029 (75.1) | 341 (24.9) | 1,024 (74.7) | 346 (25.3) | ||||
| > Once a week | 1,468 (74.8) | 495 (25.2) | 1,471 (74.9) | 492 (25.1) | 1,476 (75.2) | 487 (24.8) | ||||
| Other seafood items | 0.229 | 0.513 | 0.226 | |||||||
| ≤ Once a week | 2,384 (75.2) | 787 (24.8) | 2,382 (75.1) | 789 (24.9) | 2,385 (75.2) | 786 (24.8) | ||||
| > Once a week | 115 (71.0) | 47 (29.0) | 118 (72.8) | 44 (27.2) | 115 (71.0) | 47 (29.0) | ||||
| Category | Total | Men | Women | |||||||||||
|---|---|---|---|---|---|---|---|---|---|---|---|---|---|---|
| Unadjusted | Adjusted model 1a | Adjusted model 2b | Unadjusted | Adjusted model 3c | Unadjusted | Adjusted model 3c | ||||||||
| ≤ Once a week | > Once a week | ≤ Once a week | > Once a week | ≤ Once a week | > Once a week | ≤ Once a week | > Once a week | ≤ Once a week | > Once a week | ≤ Once a week | > Once a week | ≤ Once a week | > Once a week | |
| MEHHP | 1 | 1.21 (0.87–1.67) | 1 | 1.18 (0.84–1.65) | 1 | 1.19 (0.82–1.73) | 1 | 1.52 (0.98–2.35) | 1 | 1.66 (1.01–2.71) | 1 | 1.12 (0.71–1.77) | 1 | 1.03 (0.60–1.77) |
| MEOHP | 1 | 1.32 (0.96–1.81) | 1 | 1.29 (0.93–1.79) | 1 | 1.43 (1.01–2.06) | 1 | 1.31 (0.83–2.05) | 1 | 1.91 (1.14–3.18) | 1 | 1.21 (0.77–1.88) | 1 | 1.16 (0.69–1.92) |
| MECPP | 1 | 1.49 (1.10–2.01) | 1 | 1.46 (1.07–2.00) | 1 | 1.43 (1.01–2.03) | 1 | 1.67 (1.09–2.54) | 1 | 1.82 (1.13–2.91) | 1 | 1.32 (0.86–2.03) | 1 | 1.27 (0.77–2.08) |
| ∑DEHP | 1 | 1.44 (1.06–1.96) | 1 | 1.42 (1.03–1.95) | 1 | 1.57 (1.10–2.24) | 1 | 1.51 (0.98–2.32) | 1 | 1.77 (1.09–2.87) | 1 | 1.13 (0.72–1.77) | 1 | 1.02 (0.61–1.72) |
| MnBP | 1 | 1.10 (0.80–1.53) | 1 | 1.07 (0.77–1.49) | 1 | 1.08 (0.74–1.56) | 1 | 1.83 (1.20–2.79) | 1 | 1.90 (1.17–3.07) | 1 | 0.66 (0.40–1.09) | 1 | 0.62 (0.35–1.11) |
| MBzP | 1 | 0.89 (0.63–1.27) | 1 | 0.87 (0.61–1.24) | 1 | 0.84 (0.57–1.25) | 1 | 0.93 (0.56–1.53) | 1 | 0.94 (0.54–1.63) | 1 | 1.01 (0.63–1.60) | 1 | 0.92 (0.53–1.58) |
| MCOP | 1 | 2.05 (1.54–2.71) | 1 | 2.03 (1.52–2.70) | 1 | 2.01 (1.46–2.77) | 1 | 1.84 (1.23–2.76) | 1 | 2.27 (1.44–3.58) | 1 | 1.99 (1.34–2.95) | 1 | 1.55 (0.98–2.46) |
| MCNP | 1 | 1.52 (1.13–2.04) | 1 | 1.49 (1.11–2.02) | 1 | 1.56 (1.11–2.18) | 1 | 1.49 (0.98–2.28) | 1 | 1.85 (1.16–2.96) | 1 | 1.34 (0.88–2.03) | 1 | 1.27 (0.78–2.08) |
| MCPP | 1 | 2.23 (1.68–2.96) | 1 | 2.21 (1.66–2.94) | 1 | 2.57 (1.85–3.56) | 1 | 2.55 (1.71–3.80) | 1 | 3.01 (1.91–4.74) | 1 | 1.58 (1.05–2.37) | 1 | 1.51 (0.93–2.45) |
Table 1 Baseline characteristics of the participants
Data were presented as median (interquartile range), mean ± standard deviation, or number (%).
MEHHP: mono-(2-ethyl-5-hydroxyhexyl) phthalate; MEOHP: mono-(2-ethyl-5-oxohexyl) phthalate; MECPP: mono-(2-ethyl-5-carboxypentyl) phthalate; ∑DEHP: ∑di-2-ethylhexyl phthalate; MnBP: mono-n-butyl phthalate; MBzP: mono-benzyl phthalate; MCOP: mono-carboxyoctyl phthalate; MCNP: mono-carboxy-isononly phthalate; MCPP: mono (3-carboxypropyl) phthalate; BMI: body mass index.
a
Table 2 Baseline characteristics of the total adults according to urinary phthalate metabolites: MEHHP, MEOHP, MECPP
Data were presented as mean ± standard deviation or number (%).
MEHHP: mono-(2-ethyl-5-hydroxyhexyl) phthalate; MEOHP: mono-(2-ethyl-5-oxohexyl) phthalate; MECPP: mono-(2-ethyl-5-carboxypentyl) phthalate; BMI: body mass index.
a
Table 3 Baseline characteristics of the total adults according to urinary phthalate metabolites: ∑DEHP, MnBP, MBzP
Data were presented as mean ± standard deviation or number (%).
∑DEHP: ∑di-2-ethylhexyl phthalate; MnBP: mono-n-butyl phthalate; MBzP: mono-benzyl phthalate; BMI: body mass index.
a
Table 4 Baseline characteristics of the total adults according to urinary phthalate metabolites: MCOP, MCNP, MCPP
Data were presented as mean ± standard deviation or number (%).
MCOP: mono-carboxyoctyl phthalate; MCNP: mono-carboxy-isononly phthalate; MCPP: mono (3-carboxypropyl) phthalate; BMI: body mass index.
a
Table 5 Adjusted ORs and 95% CIs of shellfish consumption with high concentrations of urinary phthalate metabolites
OR: odds ratio; CI: confidence interval; MEHHP: mono-(2-ethyl-5-hydroxyhexyl) phthalate; MEOHP: mono-(2-ethyl-5-oxohexyl) phthalate; MECPP: mono-(2-ethyl-5-carboxypentyl) phthalate; ∑DEHP: ∑di-2-ethylhexyl phthalate; MnBP: mono-n-butyl phthalate; MBzP: mono-benzyl phthalate; MCOP: mono-carboxyoctyl phthalate; MCNP: mono-carboxy-isononly phthalate; MCPP: mono (3-carboxypropyl) phthalate.
aAdjusted model 1: adjusted for gender, age; bAdjusted model 2: adjusted for gender, age, BMI, marital status, smoking, alcohol, food storage, and consumption of plastic pack drink, large fish and tuna, fish, crustacean, seaweed, other seafood items; cAdjusted model 3: adjusted for age, BMI, marital status, smoking, alcohol, food storage, and consumption of plastic pack drink, large fish and tuna, fish, crustacean, seaweed, other seafood items.

