
Articles
- Page Path
- HOME > Ann Occup Environ Med > Volume 35; 2023 > Article
- Original Article The relationship between visual display terminal usage at work and symptoms related to computer vision syndrome
-
Soonsu Shin1
 , Eun Hye Yang1, Hyo Choon Lee1, Seong Ho Moon1, Jae-Hong Ryoo2
 -
Annals of Occupational and Environmental Medicine 2023;35:e1.
DOI: https://doi.org/10.35371/aoem.2023.35.e1
Published online: January 9, 2023
1Department of Occupational and Environmental Medicine, Kyung Hee University Hospital, Seoul, Korea.
2Department of Occupational and Environmental Medicine, School of Medicine, Kyung Hee University, Seoul, Korea.
- Correspondence: Jae-Hong Ryoo. Departments of Occupational and Environmental Medicine, School of Medicine, Kyung Hee University, 23 Kyungheedae-ro, Dongdaemun-gu, Seoul 02447, Korea. armani131@naver.com
• Received: June 20, 2022 • Revised: October 4, 2022 • Accepted: December 7, 2022
Copyright © 2023 Korean Society of Occupational & Environmental Medicine
This is an Open Access article distributed under the terms of the Creative Commons Attribution Non-Commercial License (https://creativecommons.org/licenses/by-nc/4.0/) which permits unrestricted non-commercial use, distribution, and reproduction in any medium, provided the original work is properly cited.
Abstract
-
Background Although it is well known that the usage of visual display terminal (VDT) at the workplace causes computer vision syndrome (CVS), previous studies mainly focused on computer use and the health of white-collar workers. In this study, we explored the relationship between the usage of VDT including various devices, and symptoms related to CVS in a large population including pink-collar workers and blue-collar workers.
-
Methods 21,304 wage workers over the age of 20 years were analyzed from the 6th Korean Working Conditions Survey. To investigate the association between VDT use at work and symptoms related to CVS among wage workers, odds ratios (ORs) and 95% confidence interval (CI) were calculated by multivariate logistic regression models.
-
Results In the group with the highest VDT usage at work, the OR of headache/eyestrain was 2.16 (95% CI: 1.86–2.52). The OR of suspected CVS patients was significantly increased in the highest group of usage of VDT at work (OR: 1.69; 95% CI, 1.39–2.06). Compare with the reference group, the OR for headache/eyestrain in the highest group of VDT usage was 2.81 (95% CI: 2.13–3.70) in white-collar workers, 1.78 (95% CI: 1.32–2.40) in pink-collar workers, and 1.59 (95% CI: 1.18–2.15) in blue-collar workers.
-
Conclusions We observed a relationship in which the use of VDT in the workplace increases the risk of headache/eyestrain regardless of occupational classification. Our findings emphasize the importance of paying attention to the health of VDT workers and making plans to improve their working conditions.
BACKGROUND
Visual display terminals (VDT) have become essential components of life as science and technology have advanced. The advent of personal computers revolutionized the workplace 40 years ago, and today, a variety of electronic gadgets, such as tablets and smartphones, are infiltrating various workplaces.1,2 According to the 6th European Working Conditions Survey, more than half of workers in Europe use VDT at work, and 37% of workers use VDT for more than 75% of their work hours.3 In Korea, 65.8% of workers use computers at work, and 40.4% use computers for more than 80% of their work hours.4
Computer vision syndrome (CVS) is a syndrome characterized by eye-related symptoms in users who use VDT for a long time.5 CVS is common in individuals who work with VDT, and its prevalence is reported to vary from 18% to 80%.6,7 Symptoms of CVS are divided into 2 categories: ocular symptoms, such as eyestrain, blurry vision, asthenopia, and dry eyes; and extraocular symptoms, such as musculoskeletal pain of the upper extremity.8 Headache was included in this categorization as an ocular symptom because it is closely related to eye strain.2 Previous studies have indicated that eyestrain is frequently accompanied or preceded by headache.9,10 According to a study that determined various causes of asthenopia, the same stimulus provoked headaches and eyestrain.11 Eyestrain and headache can be triggered by spasms of muscles around the orbit, and impairments in accommodation and convergence can also contribute to their occurrence.12,13
The health effects of VDT usage at work have been thoroughly investigated. Workers using VDT frequently complain of eye symptoms.14,15 Moreover, working with VDT for an hour result in alterations in accommodative function and ocular convergence.16,17 Many studies have recognized VDT usage at work as a risk factor for musculoskeletal pain in the neck, shoulders, elbows, and wrists.15 The risk of developing CVS increases proportionally to the duration of VDT exposure.18,19
However, previous studies have mainly focused on office workers who spend considerable time with computers in the workplace.15,19,20 Most epidemiological studies have focused on small populations with specific occupations, such as healthcare workers and call center operators.14,21,22 There is a scarcity of research on the relationship between VDT usage at work and health problems in pink-collar workers and blue-collar workers. In previous research, the usage of smartphones and tablets was not considered and only the impacts of computer use on workers' health were examined.14,15,16,17,19,20,21 This is because earlier research was done between the 1980s and the 2000s before smartphones and tablets were invented.14,15,16,17,20 As technology has progressed and the workplace environment has evolved, the effects of the use of VDT including smartphones and tablets on workers’ health need to be investigated.8 We used the definition of VDT which includes smartphones and tablets in this study.
We aimed to investigate the relationship between VDT use at work and health problems in a large population. In addition, the participants were classified into three groups: white-collar, pink-collar, and blue-collar, and then the health effect of the use of VDT was evaluated. To the best of our knowledge, this is the first study to use the extended concept of VDT to explore the health effects in a large population.
METHODS
This study was based on cross-sectional data from the 6th Korean Working Conditions Survey (KWCS) conducted in 2020. The KWCS has been conducted every 3 years since 2006 by the Occupational Safety and Health Research Institute in Korea. The KWCS uses a complex survey design that stratifies respondents by house type, residential location, age, sex, and socioeconomic status. The 6th KWCS was performed from October 2020 to April 2021, and one-on-one interviews and non-face-to-face online surveys were conducted at the same time because of the spread of coronavirus disease 2019. A total of 50,538 workers over 15 years of age participated in the 6th KWCS.
First, 32,916 wage workers over the age of 20 years were selected from the 50,538 participants in the 6th KWCS after self-employed individuals and unpaid family workers were excluded. After excluding respondents with missing data regarding health problems or questions of other covariates, 21,304 participants were analyzed in this study (Fig. 1).
Fig. 1

Diagram showing the process of selecting study subjects.
KWCS: Korean Working Conditions Survey.
Symptoms related to CVS were reported using a self-reported questionnaire included in the 6th KWCS. The presence of headache or eyestrain was determined by answering yes or no to the question “Have you had headache or eyestrain in the last 12 months?” The presence of upper extremity pain was determined by answering yes or no to the question “Have you had musculoskeletal pain of the neck, shoulder, elbow, arm, wrist, or hand in the last 12 months?” Those who answered yes to both of the above questions were defined as patients with suspected CVS.
A survey was also conducted on the use of VDT in the workplace. Participants in the 6th KWCS answered by a seven-point scale (all working hours, almost all working hours, approximately 75% of working hours, approximately 50% of working hours, approximately 25% of working hours, rarely, never) to the question “How often do you use your computer, laptop, tablet, or smartphone during work hours?”. No participant answered this question with “never.” These responses were categorized into three categories: low (“rarely”), moderate (“approximately 25% of working hours” or “approximately 50% of working hours”), and high (“approximately 75% of working hours” or more frequently).
Potential confounding variables included sex, age (20–29, 30–39, 40–49, 50–59, and ≥ 60 years), education level (graduation from elementary school or lower, graduation from middle school or lower, graduation from high school or lower, admission to university or higher), and household monthly income (quartiles). The occupations of the study population were classified into 11 types based on the Korean Standard Classification of Occupations in the 6th KWCS. We classified participants’ jobs into three categories: white collar, pink collar, and blue collar. Managers, professionals, researchers, and office workers were designated as white-collar workers; employees in the service and sales industries were referred to as pink-collar workers; farmers, fishermen, workers in the forestry and livestock industry, artisans, technical workers, hardware operators, and manufacturing workers, and unskilled laborers were designated as blue-collar workers. Other covariates related to occupational characteristics included shift work (yes or no), weekly working hours (≤ 40 hours per week or > 40 hours per week), and work duration (< 5 years or ≥ 5 years).
In additional analyses, ergonomic factors were defined by survey questions in the 6th KWCS. Participants of the 6th KWCS could answer on a seven-point scale (all working hours, almost all working hours, approximately 75% of working hours, approximately 50% of working hours, approximately 25% of working hours, rarely, never) to the question of painful posture, heavy lift, standing posture, sitting posture, and repetitive hand or arm movements. These responses were categorized into three categories: low (“never” or “rarely”), moderate (“approximately 25% of working hours” or “approximately 50% of working hours”), and high (“approximately 75% of working hours” or more frequently).
Confounding factors were selected based on prior research. Age over 30 was identified as a risk factor for VDT-related dry eye syndrome.23 In the same study, it was confirmed that VDT-related dry eye syndrome is more prevalent in women more than in men.23 There have been reports that the higher the income, the lower the risk of symptoms of CVS.19 Working hours and duration of work were positively associated with significant presence of CVS.8,24 The direct relationship between shift work and CVS has not been revealed, but shift work is known to be the cause of the headache and dry eye syndrome.25,26
To compare the differences in baseline characteristics according to VDT usage at work, we used the Rao–Scott chi-squared test. The Rao–Scott chi-squared test enables to compare differences between groups by considering the weights given in the complex sample survey.27 Odds ratios (ORs) and 95% confidence intervals (95% CIs) for related symptoms of CVS with respect to VDT usage at work were determined using multivariate logistic regression models adjusted for age, sex, occupational classification, household monthly income, weekly working hours, duration of work, and shift work. Potential covariates were selected for the adjusted model based on prior research, and education level was excluded using backward stepwise selection. IBM SPSS (version 19 for Windows; IBM Corp., Armonk, NY, USA) was used to perform all weighted statistical analyses. Statistical significance was defined as p < 0.05.
Multicollinearity among covariates is problematic when performing multivariate logistic regression analysis. To consider the multicollinearity, Spearman's rank correlation coefficient rho and the variance inflation factor (VIF) were calculated to test multicollinearity. The thresholds for collinearity were set at correlation coefficient rho < 0.5 and VIF < 10.
The Institutional Review Board (IRB) of Kyung Hee University Hospital issued ethics approval for the present study (No. KHUH 2022-05-022). Since the researchers analyzed the database retrospectively, the IRB waived the informed consent requirement.
RESULTS
Table 1 shows the general characteristics of the study participants according to VDT usage at work. This study included 10,323 men and 10,981 women. There were significant differences in age, occupational classification, household monthly income, weekly working hours, duration of work, and shift work between the three groups. With regard to sex, however, no differences were observed among the three groups. In the group with high VDT usage at work, the distribution of those in their 50s and 60s was lower, the proportion of those admitted to university or higher was higher, and the proportion of white-collar workers was higher.
Table 1
Baseline characteristics of study population (n = 21,304)
Logistic regression analysis was performed to estimate the association between VDT use at work and the related symptoms of CVS (Table 2). In the group with the highest VDT usage at work, the adjusted odds ratio of headache/eyestrain was 2.16 (95% CI: 1.86–2.52). The use of VDT at work has been shown to lower the risk of upper extremity pain. The OR between VDT exposure and upper extremity pain was 0.68 (95% CI: 0.59–0.78) in the moderate VDT use group and 0.85 (95% CI: 0.75–0.97) in the highest VDT use group. Compared with the reference group, the odds ratio of suspected patients with CVS was significantly higher in the group with highest the VDT use at work (OR: 1.69; 95% CI: 1.39–2.06).
Table 2
Multiple logistic regression results for symptoms related to CVS according to VDT usage at work (n = 21,304)
The model was adjusted for age, sex, household monthly income, occupational classification, weekly working hours, shift work, and work duration.
CVS: computer vision syndrome; VDT: visual display terminal; OR: odds ratio; CI: confidence interval.
Statistically significant values after adjusting for all covariates are shown in boldface.
Similar results and tendencies were observed in the subgroup analysis after stratification by occupational classification. The adjusted odds ratio for headache/eyestrain in the highest group compared to the reference group was 2.81 (95% CI: 2.13–3.70) in white-collar workers, 1.78 (95% CI: 1.32–2.40) in pink-collar workers, and 1.59 (95% CI: 1.18–2.15) in blue-collar workers (Table 3). In addition, the use of VDT in the workplace was found to reduce the risk of upper extremity pain in all occupational classifications (Table 3). The odds ratio for suspected patients of CVS in the highest VDT usage group compared to the lowest VDT usage group was 1.86 (95% CI: 1.32–2.62) in white-collar workers and 1.50 (95% CI: 1.02–2.22) in pink-collar workers.
Table 3
Multiple logistic regression results for symptoms related to CVS according to VDT usage at work after stratification by occupational classification (n = 21,304)
The model was adjusted for age, sex, household monthly income, weekly working hours, shift work, and work duration.
CVS: computer vision syndrome; VDT: visual display terminal; OR: odds ratio; CI: confidence interval.
Statistically significant values after adjusting for all covariates are shown in boldface.
In the fully adjusted model, age, sex, weekly working hours, and work duration were associated with an increased risk of suspected patients of CVS (Supplementary Table 1). After stratification by sex, as the use of VDT increased, the adjusted odds ratio of headache/eyestrain increased, the adjusted odds ratio of upper extremity pain decreased, and the adjusted odds ratio of suspected patients with CVS increased, regardless of sex (Supplementary Table 2). According to a correlation matrix among covariates in Supplementary Table 3, the correlation coefficient ranged from −0.38 to 0.42 and VIF ranged from 1.04 to 1.60. Consequently, we determined that multicollinearity was low.
DISCUSSION
The present study showed that VDT usage at work was associated with an increased risk of headache/eyestrain. Additionally, the use of VDT increased the risk of suspected CVS patients in white-collar workers and pink-collar workers. This result is in line with many previous studies that show that using VDT at work increases the risk of CVS.14,19,22,28 However, VDT usage at work was not significantly associated with suspected CVS patients in blue-collar workers.
We observed that the use of VDT in the workplace increased the risk of headache/eyestrain in all occupational classifications. The ocular symptoms of CVS originate from differences between electronic screens and papers. Images on electronic screens are made up of pixels and rasters, which are generated by electric waves that impact the screen’s phosphor-coated rear surface.29 The pixels are bright at the center and become less bright at the rim. As a result, human eyes are unable to maintain a focus on pixel characters for a long time.30 Therefore, researchers have reported that when viewing electronic screens, work errors increase and eye symptoms worsen compared to those when viewing paper.31,32 There have also been previous studies on changes in accommodative and vergence functions after using VDT.1,33 Focusing on the monitor for a long time reduces the rate of blinking and increases corneal exposure, which causes symptoms of CVS, such as the dry eye.32,34
Headache is a common symptom of CVS. Mechanisms have been postulated to explain the appearance of headaches in CVS. Two hours of computer use increases the muscle load and blood flow of the orbicularis oculi, resulting in eyestrain.35 In addition, some researchers have suggested that eyestrain and headache can be induced by certain streak and flicker patterns on displays.1,28 Eye strain and headache usually appear simultaneously and are exacerbated by impaired vision and dry eye.9 As a result, it is difficult to distinguish between headache and eyestrain in ophthalmology.11
In this study, VDT use at work had a protective effect against upper extremity pain. These findings are completely contradictory to the results of previous studies that found that using VDT causes musculoskeletal pain in the upper extremity. These results would have been shown because pink-collar workers and blue-collar workers who frequently use VDT at work in a relatively comfortable posture and better working environment. The VDT workstation is designed to let workers use their hands to operate the device while looking at the monitor in a sedentary position. However, all the variables of postures and heavy lifting were not considered covariates in the analyses because they interacted with VDT use at work (p for interaction < 0.25, considered statistically significant).
Additional analyses were conducted on how ergonomic factors affect upper extremity pain in white-collar workers (Supplementary Table 4). Painful posture and heavy lifting work increased the risk of upper extremity pain. In previous studies on workers in the same working environment and posture, the extensive use of VDT increased the risk of upper extremity pain.8,36 The group with the frequently repeated movement of the hand or arm had a significantly higher odds ratio of upper extremity pain. These findings indicate that frequent use of keyboards and mouse can increase the risk of upper extremity pain.
To our knowledge, this study is the first to investigate the effect of VDT use on human health in large population groups with various occupations. Unlike previous studies that defined VDT use only as computer use, we conducted research by including devices such as tablets, smartphones, and laptops, in the concept of VDT. This effort is thought to be appropriate for the era of the Fourth Industrial Revolution as VDT are becoming more widespread in the workplace. Furthermore, we conducted stratified subgroup analyses based on occupational classifications and sex, which could be a strength of this study.
However, this study had some limitations. First, we were unable to investigate the use of VDT outside the workplace. Since the KWCS is a survey of the working environment, there is a lack of questions about daily life. The use of smartphones and laptops in daily life can greatly influence headaches and eyestrain. Second, we did not consider the underlying diseases and conditions affecting the symptoms of CVS, such as wearing contact lenses. Some studies have shown that slight uncorrected astigmatism increases the risk of CVS symptoms.37,38 In addition, it has been suggested that patients with Sjögren’s syndrome are vulnerable to CVS.32 Wearing contact lenses is a well-known risk factor for CVS.32 The placement of a contact lens on the cornea has been demonstrated to significantly alter the blink rate.39 Tauste et al. reported that wearing contact lenses increases the risk of CVS when working on computers.40 Third, as mentioned above, the variables of ergonomic risk factors were not considered as confounding factors in the adjusted model. Fourth, a self-report survey of health problems and VDT usage at work could be inaccurate. Fifth, selection bias could not be eliminated in this study. The 21,304 subjects in this study were 64.7% of the 32,916 subjects analyzed. 35.3% were excluded from the analysis according to the non-response of the variable, which may have led to a non-response bias. A response rate of more than 60% is acceptable in studies that use surveys, and a rate of more than 80% is considered to be excellent.41 The sociodemographic differences were observed between the participants and non-respondents (Supplementary Table 5). It was confirmed that the non-responders had a lower socioeconomic level than the study participants. Therefore, there was a possibility that the results of this study might have been biased. Finally, causal relationships could not be determined, because this study is a cross-sectional study.
CONCLUSIONS
This study reaffirmed the strong relationship between headache/eyestrain and VDT use at work. A positive association between the use of VDT at work and headache/eyestrain was observed even in blue-collar workers. The Ministry of Employment and Labor of the Republic of Korea has distributed guidelines for work management for workers handling VDT, but there is a lack of supervision and education at the workplace. Our findings highlight the need to pay attention to the health of VDT workers and plan for a better working environment.
ACKNOWLEDGEMENTS
The authors would like to express their gratitude to the participants and researchers of Korean Working Conditions Survey (KWCS).
Abbreviations
CI
confidence interval
CVS
computer vision syndrome
KSWC
Korean Working Conditions Survey
OR
odds ratio
VDT
visual display terminal
VIF
variance inflation factor
-
Funding: This study was supported by the National Research Foundation of Korea in 2020 (grant number: 2020R1G1A1102257). The funding organization had no role in the design or performance of this study.
-
Competing interests: The authors declare that they have no competing interests.
-
Author Contributions:
Conceptualization: Shin S.
Data curation: Ryoo JH.
Formal analysis: Shin S, Yang EH, Lee HC, Moon SH.
Funding acquisition: Ryoo JH.
Methodology: Shin S, Yang EH, Ryoo JH.
Supervision: Ryoo JH.
Visualization: Lee HC, Moon SH.
Writing - original draft: Shin S, Ryoo JH.
Writing - review & editing: Shin S, Ryoo JH.
NOTES
SUPPLEMENTARY MATERIALS
Supplementary Table 1
Multiple logistic regression results for symptoms related to CVS according to VDT usage at work after stratification by sex (n = 21,304)
Supplementary Table 2
Multiple logistic regression results for symptoms related to CVS according to variables (n = 21,304)
Supplementary Table 4
Odds ratios for upper extremity pain by ergonomic risk factors in white-collar workers (n = 12,602)
Supplementary Table 5
Comparison of characteristics between study subjects and non-respondents
- 1. Blehm C, Vishnu S, Khattak A, Mitra S, Yee RW. Computer vision syndrome: a review. Surv Ophthalmol 2005;50(3):253–262. 15850814.ArticlePubMed
- 2. Gowrisankaran S, Sheedy JE. Computer vision syndrome: a review. Work 2015;52(2):303–314. 26519133.ArticlePubMed
- 3. Eurofound. Sixth European Working Conditions Survey. Updated 2017]. Accessed June 14, 2022]. https://www.eurofound.europa.eu/sites/default/files/ef_publication/field_ef_document/ef1634en.pdf .
- 4. Ministry of Science and ICT, National Information Society Agency. Survey on the internet usage. Updated 2022]. Accessed June 14, 2022]. https://www.nia.or.kr/site/nia_kor/ex/bbs/View.do?cbIdx=99870&bcIdx=24378&parentSeq=24378 .
- 5. American Optometric Association. Computer vision syndrome. Updated 2022]. Accessed June 14, 2022]. https://www.aoa.org/healthy-eyes/eye-and-vision-conditions/computer-vision-syndrome?sso=y .
- 6. Fenga C, Aragona P, Cacciola A, Spinella R, Di Nola C, Ferreri F, et al. Meibomian gland dysfunction and ocular discomfort in video display terminal workers. Eye (Lond) 2008;22(1):91–95. 17962818.ArticlePubMedPDF
- 7. Ye Z, Honda S, Abe Y, Kusano Y, Takamura N, Imamura Y, et al. Influence of work duration or physical symptoms on mental health among Japanese visual display terminal users. Ind Health 2007;45(2):328–333. 17485878.ArticlePubMed
- 8. Parihar JK, Jain VK, Chaturvedi P, Kaushik J, Jain G, Parihar AK. Computer and visual display terminals (VDT) vision syndrome (CVDTS). Med J Armed Forces India 2016;72(3):270–276. 27546968.ArticlePubMedPMC
- 9. Vincent AJ, Spierings EL, Messinger HB. A controlled study of visual symptoms and eye strain factors in chronic headache. Headache 1989;29(8):523–527. 2793458.ArticlePubMed
- 10. Harle DE, Evans BJ. The optometric correlates of migraine. Ophthalmic Physiol Opt 2004;24(5):369–383. 15315651.ArticlePubMed
- 11. Sheedy JE, Hayes JN, Engle J. Is all asthenopia the same? Optom Vis Sci 2003;80(11):732–739. 14627938.ArticlePubMedPDF
- 12. Carruthers A, Langtry JA, Carruthers J, Robinson G. Improvement of tension-type headache when treating wrinkles with botulinum toxin A injections. Headache 1999;39(9):662–665. 11279962.ArticlePubMed
- 13. Granet DB, Gomi CF, Ventura R, Miller-Scholte A. The relationship between convergence insufficiency and ADHD. Strabismus 2005;13(4):163–168. 16361187.ArticlePubMed
- 14. Gunnarsson E, Söderberg I. Eye strain resulting from VDT work at the Swedish telecommunications administration. Appl Ergon 1983;14(1):61–69. 15676465.ArticlePubMed
- 15. Iwakiri K, Mori I, Sotoyama M, Horiguchi K, Ochiai T, Jonai H, et al. Survey on visual and musculoskeletal symptoms in VDT workers. Sangyo Eiseigaku Zasshi 2004;46(6):201–212. 15656081.ArticlePubMed
- 16. Kurimoto S, Iwasaki T, Nomura T, Noro K, Yamamoto S. Influence of VDT work on eye accommodation. J UOEH 1983;5(1):101–110.Article
- 17. Qu XM, Chu RY, Wang L, Yao PJ, Liu JR. Effects of short-term VDT usage on visual functions. Zhonghua Yan Ke Za Zhi 2005;41(11):986–989. 16318749.PubMed
- 18. Rahman ZA, Sanip S. Computer user: demographic and computer related factors that predispose user to get computer vision syndrome. Int J Bus Humanit Technol 2011;1(2):84–91.
- 19. Dessie A, Adane F, Nega A, Wami SD, Chercos DH. Computer vision syndrome and associated factors among computer users in Debre Tabor Town, Northwest Ethiopia. J Environ Public Health 2018;2018:4107590. 30305823.ArticlePubMedPMCPDF
- 20. Nakazawa T, Okubo Y, Suwazono Y, Kobayashi E, Komine S, Kato N, et al. Association between duration of daily VDT use and subjective symptoms. Am J Ind Med 2002;42(5):421–426. 12382255.ArticlePubMed
- 21. Sa EC, Ferreira Junior M, Rocha LE. Risk factors for computer visual syndrome (CVS) among operators of two call centers in São Paulo, Brazil. Work 2012;41(Suppl 1):3568–3574. 22317263.ArticlePubMedPDF
- 22. Artime-Ríos E, Suárez-Sánchez A, Sánchez-Lasheras F, Seguí-Crespo M. Computer vision syndrome in healthcare workers using video display terminals: an exploration of the risk factors. J Adv Nurs 2022;78(7):2095–2110. 35112736.ArticlePubMedPDF
- 23. Uchino M, Yokoi N, Uchino Y, Dogru M, Kawashima M, Komuro A, et al. Prevalence of dry eye disease and its risk factors in visual display terminal users: the Osaka study. Am J Ophthalmol 2013;156(4):759–766. 23891330.ArticlePubMed
- 24. Ranasinghe P, Wathurapatha WS, Perera YS, Lamabadusuriya DA, Kulatunga S, Jayawardana N, et al. Computer vision syndrome among computer office workers in a developing country: an evaluation of prevalence and risk factors. BMC Res Notes 2016;9(1):150. 26956624.ArticlePubMedPMC
- 25. Leso V, Gervetti P, Mauro S, Macrini MC, Ercolano ML, Iavicoli I. Shift work and migraine: a systematic review. J Occup Health 2020;62(1):e12116. 32515906.ArticlePubMedPMCPDF
- 26. Makateb A, Torabifard H. Dry eye signs and symptoms in night-time workers. J Curr Ophthalmol 2017;29(4):270–273. 29270473.ArticlePubMedPMC
- 27. Rao JN, Scott AJ. The analysis of categorical data from complex sample surveys: chi-squared tests for goodness of fit and independence in two-way tables. J Am Stat Assoc 1981;76(374):221–230.Article
- 28. Travers PH, Stanton BA. Office workers and video display terminals: physical, psychological and ergonomic factors. AAOHN J 2002;50(11):489–493. 12465203.ArticlePubMedPDF
- 29. Lee DS, Ko YH, Shen IH, Chao CY. Effect of light source, ambient illumination, character size and interline spacing on visual performance and visual fatigue with electronic paper displays. Displays 2011;32(1):1–7.Article
- 30. Alemayehu AM. Pathophysiologic mechanisms of computer vision syndrome and its prevention: review. World J Ophthal Vis Res 2019;2(5):000547.Article
- 31. Chu C, Rosenfield M, Portello JK, Benzoni JA, Collier JD. A comparison of symptoms after viewing text on a computer screen and hardcopy. Ophthalmic Physiol Opt 2011;31(1):29–32. 21197801.ArticlePubMed
- 32. Rosenfield M. Computer vision syndrome: a review of ocular causes and potential treatments. Ophthalmic Physiol Opt 2011;31(5):502–515. 21480937.ArticlePubMed
- 33. Gur S, Ron S, Heicklen-Klein A. Objective evaluation of visual fatigue in VDU workers. Occup Med (Lond) 1994;44(4):201–204. 7949062.ArticlePubMed
- 34. Tsubota K, Nakamori K. Dry eyes and video display terminals. N Engl J Med 1993;328(8):584.Article
- 35. Thorud HM, Helland M, Aarås A, Kvikstad TM, Lindberg LG, Horgen G. Eye-related pain induced by visually demanding computer work. Optom Vis Sci 2012;89(4):E452–E464. 22366711.ArticlePubMedPDF
- 36. Hales TR, Sauter SL, Peterson MR, Fine LJ, Putz-Anderson V, Schleifer LR, et al. Musculoskeletal disorders among visual display terminal users in a telecommunications company. Ergonomics 1994;37(10):1603–1621. 7957018.ArticlePubMed
- 37. Wiggins NP, Daum KM. Visual discomfort and astigmatic refractive errors in VDT use. J Am Optom Assoc 1991;62(9):680–684. 1815002.PubMed
- 38. Wiggins NP, Daum KM, Snyder CA. Effects of residual astigmatism in contact lens wear on visual discomfort in VDT use. J Am Optom Assoc 1992;63(3):177–181. 1583277.PubMed
- 39. García-Montero M, Rico-Del-Viejo L, Martínez-Alberquilla I, Hernández-Verdejo JL, Lorente-Velázquez A, Madrid-Costa D. Effects of blink rate on tear film optical quality dynamics with different soft contact lenses. J Ophthalmol 2019;2019:4921538. 31360543.PubMedPMC
- 40. Tauste A, Ronda E, Molina MJ, Seguí M. Effect of contact lens use on Computer Vision Syndrome. Ophthalmic Physiol Opt 2016;36(2):112–119. 26743161.ArticlePubMed
- 41. Fincham JE. Response rates and responsiveness for surveys, standards, and the journal. Am J Pharm Educ 2008;72(2):43. 18483608.ArticlePubMedPMC
REFERENCES
REFERENCES
Figure & Data
REFERENCES
Citations
Citations to this article as recorded by 
- Effect of indoor ambient luminance distribution on smartphone display luminance and occupant visual comfort through visual field luminance sensitivity model
Bo Wang, Kepan Xu, Hao Wang, Xinzhe Yang, Yifan Xu, Dongyan Wen, Yuan Chen, Ayin Yan, Xinshuo Zhang, Ying He
Building and Environment.2026; 288: 113919. CrossRef - Occupational exposure to video display terminals: a systematic review of ocular and visual health effects and associated risk factors
Eva Artime-Ríos, Mar Seguí-Crespo, Begoña Doménech-Amigot, Mar Sánchez-Brau, Ana Suárez-Sánchez, José María Ramada-Rodilla
Journal of Occupational Health.2026;[Epub] CrossRef - Digital eye strain among Indian university students in the post-COVID era: a cross-sectional study
Swati Kumari, Yamini Michelle Maran, Kshitij A. Krishnan, Mahalakshmi Raja, Gayatri S., Vinishaa Paraman
Frontiers in Public Health.2026;[Epub] CrossRef - Objective Assessment of Visual Workload in Video Display Terminal Workers Using a Non-Invasive Monitoring System
Edoardo Marelli, Davide Ruongo, Giacomo Beschi, Nicolò Valsecchi, Vito Romano, Francesco Semeraro, Simone Dalola, Emma Sala, Cesare Tomasi, Vittorio Ferrari, Marco Ferrari, Giuseppe De Palma
La Medicina del Lavoro.2026; 117(3): 18795. CrossRef - Computer vision syndrome: a comprehensive literature review
Fares Kahal, Ahmad Al Darra, André Torbey
Future Science OA.2025;[Epub] CrossRef - Impact of video display terminal use on ophthalmic symptoms and mental health in adolescents
Liping Zhang, Chunxia Peng, Li Li
Journal of American Association for Pediatric Ophthalmology and Strabismus.2025; 29(4): 104270. CrossRef - Job specifics of IT specialists and approaches to disease prevention
Liliya M. Fatkhutdinova, Adelya R. Mukhutdinova, Nail K. Amirov
Kazan medical journal.2025; 106(6): 1010. CrossRef - Association Between Work Intensity and Eye Fatigue among Workers
Wan-Kee Kim
The Korean Journal of Vision Science.2025; 27(4): 345. CrossRef - Evaluation of PVD exposure and its influence on visual fatigue in the administrative staff of a public hospital in Riobamba - Ecuador in 2023
Abigail Torres, Santiago Salazar
Salud, Ciencia y Tecnología.2024; 4: 1049. CrossRef - Effects of Low-Intensity Wearable Ultrasound Technology on Pain, Muscle Tone, and Body Temperature in Women: Randomized Control Trials
SungYeon Oh, Jaeho Yu
The Journal of Korean Physical Therapy.2024; 36(3): 85. CrossRef - Digital Eye Strain: Updated Perspectives
Andrew Pucker, Aaron Kerr, Jennifer Sanderson, Chris Lievens
Clinical Optometry.2024; Volume 16: 233. CrossRef - A pilot study of the impact of repeated blink refrainment on ocular surface temperature and the interblink period
Wing Li, Andrew D. Graham, Meng C. Lin
Optometry and Vision Science.2024; 101(11): 652. CrossRef - Objective Assessment of Active Display Screen Fixation Among Office Workers Using an Innovative Nonwearable Acquisition System: A Pilot Study
Edoardo Marelli, Davide Ruongo, Simone Dalola, Emma Sala, Cesare Tomasi, Vittorio Ferrari, Marco Ferrari, Giuseppe De Palma
Applied Sciences.2024; 14(23): 11307. CrossRef - Association between receiving work communications outside of work hours via telecommunication devices and work-related headaches and eyestrain: a cross-sectional analysis of the 6th Korean Working Conditions Survey
Yoon-Soo Jang, Jae-Han Lee, Na-Rae Lee, Dong-Woo Kim, June-Hee Lee, Kyung-Jae Lee
Annals of Occupational and Environmental Medicine.2023;[Epub] CrossRef
 Cite
CiteThe relationship between visual display terminal usage at work and symptoms related to computer vision syndrome
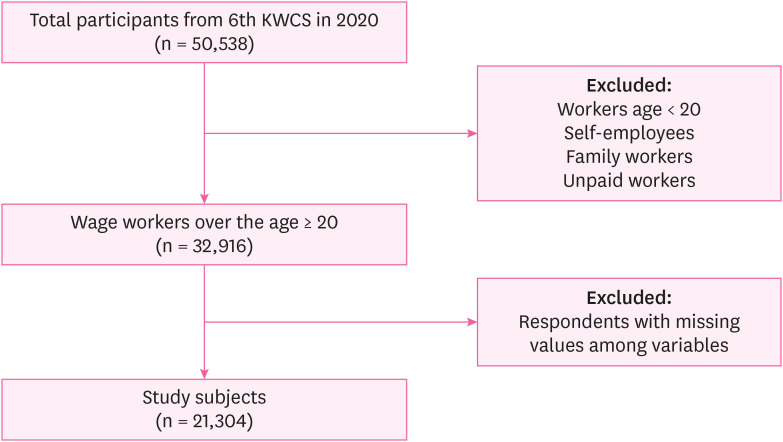
Fig. 1 Diagram showing the process of selecting study subjects.KWCS: Korean Working Conditions Survey.
Fig. 1
The relationship between visual display terminal usage at work and symptoms related to computer vision syndrome
| Characteristics | Total | VDT usage at work | ||||
|---|---|---|---|---|---|---|
| Low (n = 5,063) | Moderate (n = 5,368) | High (n = 10,873) | ||||
| Age (year) | < 0.001 | |||||
| 20–29 | 3,160 (14.8) | 709 (14.0) | 750 (14.0) | 1,701 (15.6) | ||
| 30–39 | 5,650 (26.5) | 767 (15.2) | 1,361 (25.4) | 3,522 (32.4) | ||
| 40–49 | 5,889 (27.6) | 1,012 (20.0) | 1,603 (29.9) | 3,274 (30.1) | ||
| 50–59 | 4,632 (21.7) | 1,442 (28.5) | 1,221 (22.8) | 1,969 (18.1) | ||
| > 59 | 1,973 (9.3) | 1,133 (22.4) | 433 (8.1) | 407 (3.7) | ||
| Sex | 0.75 | |||||
| Men | 10,323 (48.5) | 2,436 (48.1) | 2,642 (49.2) | 5,245 (48.2) | ||
| Women | 10,981 (51.5) | 2,627 (51.9) | 2,726 (50.8) | 5,628 (51.8) | ||
| Occupational classification | < 0.01 | |||||
| White-collar | 12,602 (59.2) | 819 (16.2) | 3,134 (58.4) | 8,649 (79.6) | ||
| Pink-collar | 4,445 (20.9) | 1,683 (33.2) | 1,238 (23.1) | 1,524 (14.0) | ||
| Blue-collar | 4,257 (20.0) | 2,561 (50.6) | 996 (18.6) | 700 (6.4) | ||
| Education level | < 0.01 | |||||
| Elementary school | 281 (1.3) | 247 (4.9) | 22 (0.4) | 12 (0.1) | ||
| Middle school | 504 (2.4) | 407 (8.0) | 64 (1.2) | 33 (0.3) | ||
| High school | 5,893 (27.7) | 2,641 (52.2) | 1,411 (26.3) | 1,841 (16.9) | ||
| University or higher | 14,626 (68.7) | 1,768 (34.9) | 3,871 (72.1) | 8,987 (92.7) | ||
| Household monthly incomea (million won) | < 0.01 | |||||
| ≤ 2 | 4,669 (21.9) | 2,110 (41.7) | 1,104 (20.6) | 1,455 (13.4) | ||
| 2–2.5 | 6,313 (29.6) | 1,545 (30.5) | 1,649 (30.7) | 3,119 (28.7) | ||
| 2.5–3.5 | 5,965 (28.0) | 986 (19.5) | 1,559 (29.0) | 3,420 (31.5) | ||
| > 3.5 | 4,357 (20.5) | 422 (8.3) | 1,056 (19.7) | 2,879 (26.5) | ||
| Weekly working hours | < 0.01 | |||||
| ≤ 40 | 15,361 (72.1) | 3,262 (64.4) | 3,823 (71.2) | 8,276 (76.1) | ||
| > 40 | 5,943 (27.9) | 1,801 (35.6) | 1,545 (28.8) | 2,597 (23.9) | ||
| Work duration (year) | < 0.01 | |||||
| ≤ 4 | 10,830 (50.8) | 3,204 (63.3) | 2,718 (50.6) | 4,908 (45.1) | ||
| > 4 | 10,474 (49.2) | 1,859 (36.7) | 2,650 (49.4) | 5,965 (54.9) | ||
| Shift work | < 0.01 | |||||
| No | 19,358 (90.9) | 4,320 (85.3) | 4,735 (88.2) | 10,303 (94.8) | ||
| Yes | 1,946 (9.1) | 743 (14.7) | 633 (11.8) | 570 (5.2) | ||
| Related symptoms of CVS | Model | VDT usage at work | ||
|---|---|---|---|---|
| Low | Moderate | High | ||
| OR (95% CI) | OR (95% CI) | OR (95% CI) | ||
| Headache/eyestrain | Crude | Reference | 1.20 (1.03–1.41) | 2.52 (2.21–2.87) |
| Adjusted | Reference | 1.06 (0.90–1.26) | 2.16 (1.86–2.52) | |
| Upper extremity pain | Crude | Reference | 0.52 (0.46–0.59) | 0.56 (0.50–0.62) |
| Adjusted | Reference | 0.68 (0.59–0.78) | 0.85 (0.75–0.97) | |
| Suspected patients with CVS | Crude | Reference | 0.92 (0.76–1.12) | 1.61 (1.38–1.88) |
| Adjusted | Reference | 0.94 (0.76–1.18) | 1.69 (1.39–2.06) | |
| Related symptoms of CVS | Model | VDT usage at work | ||||||||
|---|---|---|---|---|---|---|---|---|---|---|
| White-collar (n = 12,602) | Pink-collar (n = 4,445) | Blue-collar (n = 4,257) | ||||||||
| Low | Moderate | High | Low | Moderate | High | Low | Moderate | High | ||
| OR | OR (95% CI) | OR (95% CI) | OR | OR (95% CI) | OR (95% CI) | OR | OR (95% CI) | OR (95% CI) | ||
| Headache/eyestrain | Crude | Ref. | 1.27 (0.94–1.72) | 2.77 (2.10–3.65) | Ref. | 1.15 (0.81–1.62) | 1.97 (1.50–2.59) | Ref. | 1.18 (0.90–1.54) | 1.50 (1.13–1.99) |
| Adjusted | Ref. | 1.27 (0.94–1.72) | 2.81 (2.13–3.70) | Ref. | 1.04 (0.73–1.47) | 1.78 (1.32–2.40) | Ref. | 1.14 (0.85–1.52) | 1.59 (1.18–2.15) | |
| Upper extremity pain | Crude | Ref. | 0.69 (0.54–0.88) | 0.92 (0.73–1.15) | Ref. | 0.41 (0.32–0.53) | 0.50 (0.40–0.62) | Ref. | 0.87 (0.70–1.07) | 0.65 (0.51–0.83) |
| Adjusted | Ref. | 0.70 (0.54–0.90) | 1.00 (0.80–1.27) | Ref. | 0.46 (0.36–0.60) | 0.59 (0.46–0.76) | Ref. | 0.94 (0.75–1.18) | 0.74 (0.58–0.96) | |
| Suspected patients with CVS | Crude | Ref. | 0.89 (0.60–1.30) | 1.75 (1.25–2.46) | Ref. | 0.81 (0.51–1.28) | 1.42 (1.00–2.01) | Ref. | 1.22 (0.90–1.66) | 1.24 (0.90–1.71) |
| Adjusted | Ref. | 0.89 (0.61–1.31) | 1.86 (1.32–2.62) | Ref. | 0.84 (0.53–1.33) | 1.50 (1.02–2.22) | Ref. | 1.20 (0.83–1.62) | 1.25 (0.88–1.79) | |
Table 1 Baseline characteristics of study population (n = 21,304)
The values are presented as number (%)
VDT: visual display terminal.
a2 million won = 1,597 US dollars, 2.5 million won = 1,996 US dollars, 3.5 million won = US 2,795 dollars.
Table 2 Multiple logistic regression results for symptoms related to CVS according to VDT usage at work (n = 21,304)
The model was adjusted for age, sex, household monthly income, occupational classification, weekly working hours, shift work, and work duration.
CVS: computer vision syndrome; VDT: visual display terminal; OR: odds ratio; CI: confidence interval.
Statistically significant values after adjusting for all covariates are shown in boldface.
Table 3 Multiple logistic regression results for symptoms related to CVS according to VDT usage at work after stratification by occupational classification (n = 21,304)
The model was adjusted for age, sex, household monthly income, weekly working hours, shift work, and work duration.
CVS: computer vision syndrome; VDT: visual display terminal; OR: odds ratio; CI: confidence interval.
Statistically significant values after adjusting for all covariates are shown in boldface.

