
Articles
- Page Path
- HOME > Ann Occup Environ Med > Volume 36; 2024 > Article
- Original Article The impact of long working hours on daily sodium intake
-
Kyungho Ju1,2
 , Yangwoo Kim2,3, Seung Hee Woo1,2, Juhyeong Kim1,2, Inah Kim1,2, Jaechul Song1,2, Soo-Jin Lee1,2, Jeehee Min1,2
 -
Annals of Occupational and Environmental Medicine 2024;36:e9.
DOI: https://doi.org/10.35371/aoem.2024.36.e9
Published online: April 1, 2024
1Department of Occupational and Environmental Medicine, Hanyang University Hospital, Seoul, Korea.
2Department of Occupational and Environmental Medicine, Hanyang University College of Medicine, Seoul, Korea.
3Department of Occupational and Environmental Medicine, Hanyang University Guri Hospital, Guri, Korea.
- Correspondence: Jeehee Min. Department of Occupational and Environmental Medicine, Hanyang University Hospital, 222-1 Wangsimni-ro, Seongdong-gu, Seoul 04763, Korea. jhmin.oem@gmail.com
• Received: December 14, 2023 • Revised: February 21, 2024 • Accepted: March 11, 2024
Copyright © 2024 Korean Society of Occupational & Environmental Medicine
This is an Open Access article distributed under the terms of the Creative Commons Attribution Non-Commercial License (https://creativecommons.org/licenses/by-nc/4.0/) which permits unrestricted non-commercial use, distribution, and reproduction in any medium, provided the original work is properly cited.
Abstract
-
Background Long working hours are associated with an increased risk of cardiovascular disease, yet the underlying mechanism(s) remain unclear. The study examines how occupational factors like working hours, shift work, and employment status correlate with dietary choices and sodium intake, impacting hypertension risk.
-
Methods This study used data from the Korea National Health and Nutrition Examination Survey conducted between 2013 and 2020. The dataset included 8,471 respondents, all of whom were wage workers aged 20 or older and reported working at least 36 hours per week. Individuals who have been previously diagnosed with or are currently diagnosed with hypertension, diabetes, or dyslipidemia were excluded. The average daily sodium intake was assessed via a 24-hour dietary recall method. Average weekly working hours were categorized into 3 groups: 36–40 hours, 41–52 hours, and over 52 hours. Multiple logistic regression models were used.
-
Results Study findings revealed that 83.7% of participants exceeded the recommended daily sodium intake of 2 g set by the World Health Organization. After adjusting for confounding factors, a positive correlation was observed between average working hours and daily sodium intake. Among males, statistical significance was found in the group with average weekly working hours of 41–52 hours (prevalence ratio [PR]: 1.17; 95% confidence interval [CI]: 1.05–1.30) and the group exceeding 52 hours (PR: 1.22; 95% CI: 1.09–1.38) when comparing the fourth quartile of daily sodium intake to the combined quartiles of Q1, Q2, and Q3. Among females, no significance was noted.
-
Conclusions Long working hours were associated with increased sodium intake, primarily among male workers. This connection is likely attributed to having less time for home-cooked meals, resulting in higher fast food consumption and dining out. A workplace intervention promoting healthy eating and reducing stress is essential to lower sodium consumption and mitigate hypertension risk.
BACKGROUND
According to data from the Organization for Economic Cooperation and Development (OECD), Korea recorded an annual working hour figure of 1,910 hours in 2021, ranking it fifth among OECD member countries. This figure exceeds the OECD average of 1,716 hours by approximately 200 hours.1 The Economic Trend Report of the Korea Budget Office in April 2023 also underscores the issue of long working hours in Korea and recommends a reduction of the average weekly working hours by 3.8 hours to align with the OECD average.2 In May 2021, the World Health Organization (WHO) and the International Labor Organization reported that extended working hours have detrimental effects on health.3
Systematic literature reviews and meta-analyses have demonstrated that an average work longer than 55 hours increases the risk of stroke by 35% and the likelihood of mortality due to ischemic heart disease by 17%.4,5 Moreover, prolonged work hours are an independent risk factor for hypertension and diabetes.6,7
Despite such findings, the precise biological mechanisms underlying the association between long working hours and cardiovascular disease remain elusive. The Whitehall II study did not establish a definitive correlation between extended working hours and cardiometabolic factors.8 Similarly, the U.S. Multi-Ethnic Study of Atherosclerosis did not reveal a significant link between long-term employment and endothelial dysfunction.9 Although some studies have suggested a potential connection between prolonged work hours and atrial fibrillation,8 the definitive mechanisms are yet to be identified.
While the biological pathways linking long working hours to chronic diseases and cardiovascular mortality remain uncertain, psychosocial and behavioral mechanisms have received greater attention.10 Extended working hours and shift work impose psychological stress on workers, which adversely affects their lifestyles.11 Notably, these factors impact dietary habits, leading to increased consumption of nutritionally poor, processed foods.12
Long working hours lead to insufficient time for meal preparation, resulting in consumption of nutritionally imbalanced food.13 The relationship between occupational factors and imbalanced nutrient intake has been widely confirmed in previous studies, especially the impact on shift workers, who tend to have irregular meal patterns and adhere to unhealthy diets characterized by elevated saturated fat and simple sugar content.14 Furthermore, among male shift workers engaged in night shifts, there is an increase in the intake of fatty acids, sodium, and micronutrients.15 Also, during high-workload periods, the intake of saturated fats and sugars by workers increases.16
Regarding long working hours, previous studies have investigated the link between long working hours and insufficient dietary fiber intake.17 However, according to a study that investigated the relationship between occupational factors and calorie and nutrient intake in Korea, there was no significant difference in sodium intake based on long working hours and shift work.18 Likewise, research on the relationship between shift work and sodium intake remains insufficient. Despite the significant impact of long working hours on worker health, increasing the risk of cardiovascular disease,5,19 there is a dearth of research on the correlations between long working hours and workers’ dietary habits. Therefore, the present study aimed to examine the potential association between occupational factors of average weekly working hours, shift work, and employment status and changes in eating habits, particularly excessive sodium intake, which is a risk factor for hypertension.
METHODS
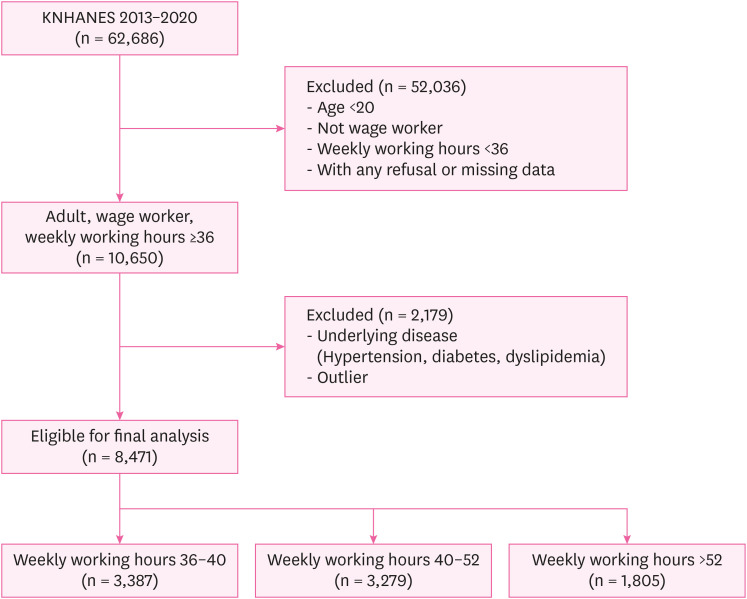
This study utilized data from the Korea National Health and Nutrition Examination Survey (KNHANES), a nationwide survey conducted annually to assess health levels, health-related behaviors, and food and nutrition intake among approximately 10,000 Koreans. A probability sample of 25 households in 192 regions is selected each year, and individuals aged one year or older within these households are surveyed. Demographic and economic activity data from the health survey, as well as daily sodium intake from the nutrition survey, were extracted for analysis. The study included a total of 62,686 respondents. To focus on wage workers with sufficient working hours, individuals classified as “short-time workers” with average weekly working hours less than 36 hours were excluded.20 Also, individuals who have been previously diagnosed with or are currently diagnosed with hypertension, diabetes, or dyslipidemia, may experience changes in dietary habits, so they were excluded from the analysis in this study.21 As a result, the study was limited to wage workers aged 20 or older with an average work week of 36 hours or more, leading to a final sample size of 8,471 respondents (Fig. 1).
The health survey data from KNHANES provided various demographic variables for analysis: gender, age, household income, education level, body mass index (BMI), and smoking and drinking status. Drinkers are defined as someone who consumes alcohol 2 or more times a week and drinks 5 or more glasses at a time. Household income was categorized as low, mid-low, mid-high, or high, while education level was classified as elementary, middle school, high school, or university. Occupational factors were classified as manual workers or non-manual workers based on job classification; full-time employment, temporary job, or day labor based on employment status; and as shift work or non-shift work based on shift timing.22
The nutrition survey conducted by KNHANES involved trained nutritionists visiting individual households to conduct interviews on eating habits, food frequency, food types, and portion sizes. The survey employed the 24-hour recall method, and individual food and nutrient intakes were calculated accordingly. By retrospectively assessing food intake, it was possible to calculate the daily intake of each nutrient by determining the nutrient content of each food item. In KNHANES, data obtained through 24-hour recall method is utilized to provide processed data on the total intake of nutrients consumed by individuals in a day. In this study, we calculated daily sodium intake using this processed data. Considering that the lethal dose of sodium is approximately 0.5–1 g per kg, the upper limit for daily sodium intake was set at 30 g.23 After removing outliers, the average daily sodium intake was classified into quartiles and used for analysis.24 Participants who exceeded the sodium intake of 30 g were 2 individuals, with intakes of 37.2 g and 56.5 g, respectively.
Since the revision of the Korean Labor Standards Act on July 1, 2018, implementation of a maximum 52-hour work week has been enforced. This regulation limits the total working hours per week to 52 hours, consisting of 40 hours of legal work and 12 hours of extended work. Some occupations are exempted from this regulation, including public officials and workers in transportation, the medical industry, agriculture, livestock, and fisheries. In this study, average working hours per week exceeding 52 hours were classified as overwork in accordance with the law. Information on average working hours per week was collected using the following question: “How many hours do you typically work per week, including overtime and night work (excluding mealtimes)?” Average weekly working hours were categorized as follows: ≥ 36 hours and ≤ 40 hours, > 40 hours and ≤ 52 hours, and > 52 hours.
Previous studies have indicated a positive correlation between the frequency of eating out and sodium intake.25 Considering the potential impact of both working hours and frequency of eating out on daily sodium intake, the frequency of eating out was included as an independent variable in this study. The following question from the diet survey section of the KNHANES was utilized, “On average, how often do you eat out, excluding home-cooked meals provided by religious groups and including free meals (including delivery food, packaged food)?” The frequency of eating out was classified into 3 groups: “less than once a week,” “once to 6 times a week,” and “more than once a day.”
Given that KNHANES data follow a complex sample design, statistical analysis was conducted by applying sample weights. KNHANES provides weights for data analysis, with “wt_itvex” serving as the basic weight for the health survey, “wt_ntr” used for average daily sodium intake from the nutrition survey, and “wt_tot” employed for analyzing the relationship between health surveys and nutrition surveys. The χ2 test was used to assess differences between groups for demographic variables based on average working hours per week. Additionally, analysis of variance tests were performed to determine if there were differences in sodium intake across average working hour categories, while χ2 tests were used to examine differences in sodium intake quartile based on average working hours per week. Regression analysis of sodium intake quartiles is not feasible due to non-satisfaction of the rare disease assumption; therefore, it is not possible to estimate the odds ratio as a relative risk. This study instead analyzed the prevalence ratio (PR) using a log-binomial regression model to provide unbiased PR estimates.26
Logistic regression analyses were conducted to identify significant differences between groups, calculating PRs and 95% confidence intervals (CIs). Univariate logistic regression was employed to compare the reference group (average weekly working hours of 36–40 hours) with groups working 41–52 hours and 53 hours or more per week. Demographic variable-adjusted logistic regression analyses were conducted to examine the relationship based on cut-off points of quartiles for daily sodium intake (Q1 vs. Q2 + Q3 + Q4, Q1 + Q2 vs. Q3 + Q4, Q1 + Q2 + Q3 vs. Q4) after adjusting for age, BMI, household income, education level, drinking and smoking status, employment type, occupation, shift work, dining out frequency, and average weekly working hours. All statistical analyses were performed using the R program version 4.1.1 (R Foundation, Vienna, Austria), and the “survey” package was used for weighted analysis.
The present study protocol received ethical approval from the Institutional Review Board (IRB) of Hanyang University (IRB No. HYUIRB-202212-005). Informed consent was obtained from all participants upon enrollment.
RESULTS
Of the total 8,471 study subjects, 3,387 worked 36–40 hours, 3,279 worked 41–52 hours, and 1,805 worked more than 52 hours per week. The demographic data of the study subjects based on weekly working hours are presented. In males, the highest percentage of workers was those with weekly working hours of 41–52 hours, at 68.9%. In females, the highest percentage of workers had 36–40 hours work week, at 53.5%. The demographic characteristics directly proportional to weekly working hours were overweight, drinker, and past or present smoker (Table 1).
Table 1
Demographic characteristics of the study participants
The average daily sodium intake of the 8,473 study subjects was 3,946.8 ± 2,288.2 mg. The daily sodium intake based on average working hours per week was 3,740.7 ± 2,086.5 mg for 36–40 hours, 4,042.0 ± 2,438.3 mg for 41–52 hours, and 4,160.6 ± 2,338.2 mg for over 52 hours, showing an increase as the average working hours per week increased. According to the WHO recommended daily sodium intake of 2 g, 82.6% of all study subjects consumed more than 2 g of sodium, indicating that most study participants exceeded the recommended intake. Also, the difference in systolic and diastolic blood pressure according to weekly working hours was described (Table 2).
Table 2
Sodium intake and blood pressure according to working hours per week
The study performed logistic regression analysis to determine whether sodium intake per day increased as the average working hours per week increased. After adjusting for confounders, the risk did increase with average working hours per week. Statistical significance was found when comparing the combined quartiles of Q3 and Q4 of daily sodium intake to the combined quartiles of Q1 and Q2 for groups with average weekly working hours of 41–52 hours (PR: 1.06; 95% CI: 1.01–1.12) and exceeding 52 hours (PR: 1.08; 95% CI: 1.01–1.14) and the fourth quartile of daily sodium intake to the combined quartiles of Q1, Q2, and Q3 for groups with average weekly working hours of 41–52 hours (PR: 1.18; 95% CI: 1.08–1.30) and exceeding 52 hours (PR: 1.28; 95% CI: 1.15–1.43) (Table 3).
Table 3
Adjusted prevalence ratios of daily sodium intake quartiles associated with weekly working hours
In males, significance was found when comparing the fourth quartile of daily sodium intake to the combined quartiles of Q1, Q2, and Q3 for groups with average weekly working hours of 41–52 hours (PR: 1.17; 95% CI: 1.05–1.30) and exceeding 52 hours (PR: 1.22; 95% CI: 1.09–1.38) (Table 3).
In addition to weekly working hours, logistic regression analysis was performed on demographic and occupational factors with average sodium intake comparing the fourth quartile of daily sodium intake to the combined quartiles of Q1, Q2, and Q3. After adjustment, statistical significance was observed in groups with people in their 30s (PR: 1.16; 95% CI: 1.02–1.31); drinkers (PR: 1.19; 95% CI: 1.09–1.31); past smokers (PR: 1.45; 95% CI: 1.31–1.61) and current smokers (PR: 1.44; 95% CI: 1.30–1.59); manual workers (PR: 1.14; 95% CI: 1.03–1.26), those with frequency of dining out one to 6 times a week (PR: 1.37; 95% CI: 1.10–1.70) and of dining out at least once a day (PR: 1.67; 95% CI: 1.34–2.08); and those with weekly working hours of 41–52 (PR: 1.18; 95% CI: 1.08–1.30) and over 52 (PR: 1.28; 95% CI: 1.15–1.43) (Table 4).
Table 4
Adjusted prevalence ratios of Q1 + Q2 + Q3 and Q4 of daily sodium intake
Stratified analysis was conducted on male study participants with average sodium intake comparing the fourth quartile of daily sodium intake to the combined quartiles of Q1, Q2, and Q3. Logistic regression analysis was performed on demographic and occupational factors. After adjustment, significance was observed in groups with drinkers (PR: 1.15; 95% CI: 1.05–1.26); frequency of dining out at least once a day (PR: 1.46; 95% CI: 1.12–1.90), weekly working hours of 41–52 (PR: 1.17; 95% CI: 1.05–1.30), and weekly working hours over 52 (PR: 1.22; 95% CI: 1.09–1.38) (Table 4).
Stratified analysis was conducted on female study participants with average sodium intake comparing the fourth quartile of daily sodium intake to the combined quartiles of Q1, Q2, and Q3. Logistic regression analysis was performed on demographic and occupational factors. After adjustment, significance was observed in high household income (PR: 1.90; 95% CI: 1.07–3.40); frequency of dining out at least once a day (PR: 1.60; 95% CI: 1.09–2.35) (Table 4).
DISCUSSION
This study demonstrated a relationship between long working hours and sodium intake. Statistical significance remained among male workers even after adjusting for confounding factors. Especially, statistical significance was observed when comparing the fourth quartile to the combined quartiles of Q1, Q2, and Q3. The sodium intake corresponding to the fourth quartile ranges from 4,962 to 28,112 mg, which exceeds the WHO-recommended daily average sodium intake of 4,310 mg. This particularly indicates a relationship between long working hours and sodium intake exceeding the WHO average. As working hours increase, individuals have less time available to maintain a healthy diet. This leads to insufficient time for home cooking,27 resulting in a higher frequency of consuming fast food, pre-prepared meals, and dining out. Among the study subjects, the proportion of individuals eating out more than once a day increased to approximately 48% when the average weekly working hours exceeded 40, compared to approximately 43% among those working 36–40 hours per week. Moreover, increased frequency of eating out is associated with a decrease in the consumption of vegetables and fruits.28 Additionally, long working hours, as observed in this study, are associated with increased intake of excessive energy, sugar, and fat.16 Previous studies have shown that workers tend to alleviate work-related stress caused by long working hours by consuming unhealthy food including high-sodium.12 It is well-established that long working hours induce psychological stress, which, in turn, affects eating behavior by decreasing eating awareness29 and intuitive eating while increasing uncontrolled emotional food intake.30
In summary, long working hours result in insufficient time for cooking, leading to increased frequency of eating out, especially fast food and convenience store meals. A study conducted by the Department of Food and Nutrition at Seoul National University revealed that the average sodium content of 71 lunch boxes sold by 5 Korean convenience store companies was 1,325 mg, which accounts for 66% of the WHO’s recommended intake.31 If 2 such meals are consumed in one day, the person has exceeded the WHO’s recommended daily sodium amount. Among the subjects of this study, about 48% of those working more than 40 hours per week eat out more than once a day, consistent with the increase in sodium intake in long-term workers.
The relationship between long working hours and high blood pressure has been well-established.32 Some studies have indicated increase risk of systolic blood pressure when the average weekly working hours exceed 61 hours.33,34 However, there have been conflicting findings suggesting a lower risk of hypertension when the average weekly working hours exceed 60 hours or no significant relationship between working hours and blood pressure.35 Nonetheless, the relationship between long working hours and the risk of cardiovascular disease is relatively clear, with multiple studies suggesting mechanisms linking the 2,36 for reason such as insufficient rest after prolonged work, lack of sleep, physical inactivity during leisure time, type A personality traits associated with both long work and cardiovascular disease, and work-related stress.37,38,39,40,41 Moreover, it is well-known that high blood pressure increases the risk of cardiovascular disease, and increased sodium intake is a clear risk factor for high blood pressure. Therefore, this study demonstrated that long working hours contributed to increased sodium intake through various physiological mechanisms. Future studies should establish a causal relationship between long working hours and high blood pressure.
In female participants subjected to stratified analyses, significance was not ascertained concerning weekly working hours. This outcome can potentially be attributed to the limited number of participants categorized within Q4 of sodium intake among females, which subsequently yielded an insufficient sample size to establish significance. Specifically, Q4, which encompasses weekly working hours ranging from 41 to 52 hours, included a total of 211 participants, while Q4 comprising weekly working hours exceeding 52 hours encompassed 85 participants, a relatively small sample size for rigorous statistical analysis. This is likely due to the lower percentage of females participating in the workforce compared to males in Korea.42 Nonetheless, significance persists in the context of dining frequency outside the home, supporting the credibility and validity of the analytical model.
Although this study utilized nationally representative data, ensuring statistical robustness, it is important to acknowledge the limitations. As a cross-sectional study, it cannot establish a causal relationship between long working hours and increased sodium intake based solely on the statistical analysis results. Furthermore, the 24-hour retrospective survey on eating habits may not fully capture the dietary patterns of the study subjects as it relies on the memory of the study participants, which can introduce recall bias. Additionally, it can assess short-term intake but may face difficulties in confirming long-term dietary exposure.43 Nutrient intake is underestimated in most dietary studies.44 According to a study analyzing the 2007–2009 KNHANES data, energy intake was underestimated in groups such as females, those aged 30–49, and those with obesity and low income.45,46 Nevertheless, according to the German National Nutrition Survey II, there was no significant difference in nutrient intake between the 24-hour recall method and the weighed food method. The 24-hour recall method is known to alleviate participants’ burden, especially in situations where survey response rates are low. Considering these factors, the European Food Safety Authority recommends the 24-hour recall method as the standard assessment method.47
When assessing daily intake through 24-hour dietary recall, it is challenging to estimate the actual amount of salt used in cooking, and the correlation coefficient between the 24-hour urine sodium excretion reflecting actual sodium absorption and sodium intake through the 24-hour dietary recall ranged from 0.11 to 0.47.46 In a study conducted in Korea, the correlation coefficient was 0.11, which is presumed to be due to the high amounts of sodium in Korean foods. According to the KNHANES, the average sodium intake in Korea has been continuously decreasing and was 3,189 mg/day in 2020.48 In this study targeting the years 2013 to 2020, the average sodium intake of the subjects was about 4,000 mg/day. According to the global report on sodium intake reduction published by WHO, the worldwide average sodium intake measured in 2019 was 4,310 mg/day, and Korea’s average sodium intake was 4,854 mg/day.49 Considering the WHO report, the sodium intake collected by the 24-hour recall method in this study appears to have been somewhat underestimated. Therefore, it seems that urine samples or similar measures are necessary to correct for errors and should be used in future analyses.
To address the significant relationship between long working hours and sodium intake revealed in this study, various interventions are needed to reduce sodium intake. Recognizing that long working hours hinder individuals from maintaining a healthy diet, it is crucial to promote a conscious reduction in the frequency of eating out, to improve the working environment to alleviate workplace stress, and to implement government-level policies to limit the average working hours per week.
CONCLUSIONS
In conclusion, this study confirmed a significant relationship between long working hours and sodium intake. The lack of time for maintaining a healthy diet and the increased frequency of eating out due to long working hours adversely affect eating habits. Reducing sodium intake requires not only individual efforts, but also workplace interventions and proposed regulations to improve the working environment and working hours.
Acknowledgements
This study was conducted using the Korea National Health and Nutrition Examination Survey (KNHANES) provided by the Korea Disease Control and Prevention Agency (KDCA). We are grateful to those who have made efforts to make these research materials available.
Abbreviations
BMI
body mass index
CI
confidence interval
KNHANES
Korea National Health and Nutrition Examination Survey
OECD
Organization for Economic Cooperation and Development
PR
prevalence ratio
SD
standard deviation
WHO
World Health Organization
-
Competing interests: The authors declare that they have no competing interests.
-
Authors contributions:
Conceptualization: Ju K, Min J.
Data curation: Ju K, Kim J.
Formal analysis: Ju K, Woo SH, Kim J.
Investigation: Min J.
Methodology: Kim Y, Kim I.
Software: Woo SH.
Validation: Kim Y.
Visualization: Song J, Lee SJ.
Writing - original draft: Ju K.
Writing - review & editing: Ju K, Min J, Kim I, Song J, Lee SJ.
NOTES
- 1. Organization for Economic Cooperation and Development (OECD). Average Annual Hours Actually Worked per Worker. Paris, France: OECD; 2021.
- 2. National Assembly Budget Office (KR). Economic Trends. Seoul, Korea: National Assembly Budget Office; 2023.
- 3. World Health Organization (WHO). Long Working Hours Increasing Deaths From Heart Disease and Stroke: WHO, ILO. Geneva, Switzerland: WHO; 2021.
- 4. Li J, Pega F, Ujita Y, Brisson C, Clays E, Descatha A, et al. The effect of exposure to long working hours on ischaemic heart disease: a systematic review and meta-analysis from the WHO/ILO Joint Estimates of the Work-related Burden of Disease and Injury. Environ Int 2020;142:105739. 32505014.ArticlePubMedPMC
- 5. Descatha A, Sembajwe G, Pega F, Ujita Y, Baer M, Boccuni F, et al. The effect of exposure to long working hours on stroke: a systematic review and meta-analysis from the WHO/ILO Joint Estimates of the Work-related Burden of Disease and Injury. Environ Int 2020;142:105746. 32505015.ArticlePubMed
- 6. Trudel X, Brisson C, Gilbert-Ouimet M, Vézina M, Talbot D, Milot A. Long working hours and the prevalence of masked and sustained hypertension. Hypertension 2020;75(2):532–538. 31852264.ArticlePubMed
- 7. Seo E, Lee Y, Mun E, Kim DH, Jeong Y, Lee J, et al. The effect of long working hours on developing type 2 diabetes in adults with prediabetes: the Kangbuk Samsung Cohort Study. Ann Occup Environ Med 2022;34(1):e4. 35425614.ArticlePubMedPMCPDF
- 8. Kivimäki M, Nyberg ST, Batty GD, Kawachi I, Jokela M, Alfredsson L, et al. Long working hours as a risk factor for atrial fibrillation: a multi-cohort study. Eur Heart J 2017;38(34):2621–2628. 28911189.PubMedPMC
- 9. Charles LE, Fekedulegn D, Landsbergis P, Burchfiel CM, Baron S, Kaufman JD, et al. Associations of work hours, job strain, and occupation with endothelial function: the Multi-Ethnic Study of Atherosclerosis (MESA). J Occup Environ Med 2014;56(11):1153–1160. 25376409.PubMedPMC
- 10. Virtanen M, Kivimäki M. Long working hours and risk of cardiovascular disease. Curr Cardiol Rep 2018;20(11):123. 30276493.ArticlePubMedPMCPDF
- 11. Park S, Kook H, Seok H, Lee JH, Lim D, Cho DH, et al. The negative impact of long working hours on mental health in young Korean workers. PLoS One 2020;15(8):e0236931. 32750080.ArticlePubMedPMC
- 12. Leung SL, Barber JA, Burger A, Barnes RD. Factors associated with healthy and unhealthy workplace eating behaviours in individuals with overweight/obesity with and without binge eating disorder. Obes Sci Pract 2018;4(2):109–118. 29670748.ArticlePubMedPMCPDF
- 13. Bauer KW, Hearst MO, Escoto K, Berge JM, Neumark-Sztainer D. Parental employment and work-family stress: associations with family food environments. Soc Sci Med 2012;75(3):496–504. 22591825.ArticlePubMedPMC
- 14. Souza RV, Sarmento RA, de Almeida JC, Canuto R. The effect of shift work on eating habits: a systematic review. Scand J Work Environ Health 2019;45(1):7–21. 30088659.ArticlePubMed
- 15. Bucher Della Torre S, Wild P, Dorribo V, Danuser B, Amati F. Energy, nutrient and food intakes of male shift workers vary according to the schedule type but not the number of nights worked. Nutrients 2020;12(4):919. 32230756.ArticlePubMedPMC
- 16. Wardle J, Steptoe A, Oliver G, Lipsey Z. Stress, dietary restraint and food intake. J Psychosom Res 2000;48(2):195–202. 10719137.ArticlePubMed
- 17. Min J, Lee DW, Kang MY, Myong JP, Kim HR, Lee J. Working for long hours is associated with dietary fiber insufficiency. Front Nutr 2022;9:786569. 35252290.ArticlePubMedPMC
- 18. Lee W, Jung J, Ahn J, Kim HR. Rate of inappropriate energy and micronutrient intake among the Korean working population. Public Health Nutr 2020;23(18):3356–3367. 32183914.ArticlePubMedPMC
- 19. Kivimäki M, Jokela M, Nyberg ST, Singh-Manoux A, Fransson EI, Alfredsson L, et al. Long working hours and risk of coronary heart disease and stroke: a systematic review and meta-analysis of published and unpublished data for 603,838 individuals. Lancet 2015;386(10005):1739–1746. 26298822.ArticlePubMed
- 20. Soek H, Won JU, Lee TI, Kim YK, Lee W, Lee JH, et al. A dose-response relationship between long working hours and unmet need for access to hospital facilities. Scand J Work Environ Health 2016;42(2):135–143. 26862879.ArticlePubMed
- 21. Filippou CD, Tsioufis CP, Thomopoulos CG, Mihas CC, Dimitriadis KS, Sotiropoulou LI, et al. Dietary approaches to stop hypertension (DASH) diet and blood pressure reduction in adults with and without hypertension: a systematic review and meta-analysis of randomized controlled trials. Adv Nutr 2020;11(5):1150–1160. 32330233.ArticlePubMedPMCPDF
- 22. Lee DW, Lee J, Kim HR, Jun KY, Kang MY. Long work hours and decreased glomerular filtration rate in the Korean working population. Occup Environ Med 2020;77(10):699–705. 32576647.ArticlePubMed
- 23. Strazzullo P, Leclercq C. Sodium. Adv Nutr 2014;5(2):188–190. 24618759.ArticlePubMedPMC
- 24. Alderman MH, Cohen H, Madhavan S. Dietary sodium intake and mortality: the National Health and Nutrition Examination Survey (NHANES I). Lancet 1998;351(9105):781–785. 9519949.ArticlePubMed
- 25. Ruiz AMP, Lima MG, Medina LPB, Pinto RL, Barros MBA, Filho AAB. Can meals outside homes impact sodium intake? Curr Dev Nutr 2020;4(6):nzaa091. 32582874.ArticlePubMedPMCPDF
- 26. Coutinho LM, Scazufca M, Menezes PR. Methods for estimating prevalence ratios in cross-sectional studies. Rev Saude Publica 2008;42(6):992–998. 19009156.PubMed
- 27. Monsivais P, Aggarwal A, Drewnowski A. Time spent on home food preparation and indicators of healthy eating. Am J Prev Med 2014;47(6):796–802. 25245799.ArticlePubMedPMC
- 28. Nagler EM, Viswanath K, Ebbeling CB, Stoddard AM, Sorensen G. Correlates of fruit and vegetable consumption among construction laborers and motor freight workers. Cancer Causes Control 2013;24(4):637–647. 22729935.ArticlePubMedPMCPDF
- 29. Barrington WE, Ceballos RM, Bishop SK, McGregor BA, Beresford SA. Perceived stress, behavior, and body mass index among adults participating in a worksite obesity prevention program, Seattle, 2005-2007. Prev Chronic Dis 2012;9:E152. 23036611.ArticlePubMedPMC
- 30. Järvelä-Reijonen E, Karhunen L, Sairanen E, Rantala S, Laitinen J, Puttonen S, et al. High perceived stress is associated with unfavorable eating behavior in overweight and obese Finns of working age. Appetite 2016;103:249–258. 27108837.ArticlePubMed
- 31. Cho C, Nam Y, Yoo HJ. Evaluation of nutritional quality of convenience store meal boxes according to store company and meal price. Korean J Community Nutr 2022;27(2):105–120.ArticlePDF
- 32. Wong K, Chan AH, Ngan SC. The effect of long working hours and overtime on occupational health: a meta-analysis of evidence from 1998 to 2018. Int J Environ Res Public Health 2019;16(12):2102. 31200573.ArticlePubMedPMC
- 33. Iwasaki K, Sasaki T, Oka T, Hisanaga N. Effect of working hours on biological functions related to cardiovascular system among salesmen in a machinery manufacturing company. Ind Health 1998;36(4):361–367. 9810150.ArticlePubMed
- 34. Nakanishi N, Yoshida H, Nagano K, Kawashimo H, Nakamura K, Tatara K. Long working hours and risk for hypertension in Japanese male white collar workers. J Epidemiol Community Health 2001;55(5):316–322. 11297649.ArticlePubMedPMC
- 35. Pimenta AM, Beunza JJ, Bes-Rastrollo M, Alonso A, López CN, Velásquez-Meléndez G, et al. Work hours and incidence of hypertension among Spanish university graduates: the Seguimiento Universidad de Navarra prospective cohort. J Hypertens 2009;27(1):34–40. 19050449.ArticlePubMed
- 36. Kang MY, Park H, Seo JC, Kim D, Lim YH, Lim S, et al. Long working hours and cardiovascular disease: a meta-analysis of epidemiologic studies. J Occup Environ Med 2012;54(5):532–537. 22576460.PubMed
- 37. Kivimäki M, Leino-Arjas P, Kaila-Kangas L, Luukkonen R, Vahtera J, Elovainio M, et al. Is incomplete recovery from work a risk marker of cardiovascular death? Prospective evidence from industrial employees. Psychosom Med 2006;68(3):402–407. 16738071.ArticlePubMed
- 38. van Diest R, Appels A. Vital exhaustion and perception of sleep. J Psychosom Res 1992;36(5):449–458. 1619584.ArticlePubMed
- 39. Chen JD, Cheng TJ, Lin YC, Hsiao ST. Job categories and acute ischemic heart disease: a hospital-based, case-control study in Taiwan. Am J Ind Med 2007;50(6):409–414. 17450543.ArticlePubMed
- 40. Rosenman RH, Friedman M, Straus R, Wurm M, Kositchek R, Hahn W, et al. A predictive study of coronary heart disease. JAMA 1964;189(1):15–22. 14149016.ArticlePubMed
- 41. Karasek RA. Job demands, job decision latitude, and mental strain: implications for job redesign. Adm Sci Q 1979;24(2):285–308.Article
- 42. Kwon MJ. Occupational health inequalities by issues on gender and social class in labor market: absenteeism and presenteeism across 26 OECD countries. Front Public Health 2020;8:84. 32269984.ArticlePubMedPMC
- 43. Shim JS, Oh K, Kim HC. Dietary assessment methods in epidemiologic studies. Epidemiol Health 2014;36:e2014009. 25078382.ArticlePubMedPMC
- 44. Black AE. Critical evaluation of energy intake using the Goldberg cut-off for energy intake:basal metabolic rate. A practical guide to its calculation, use and limitations. Int J Obes 2000;24(9):1119–1130.ArticlePDF
- 45. de Mestral C, Mayén AL, Petrovic D, Marques-Vidal P, Bochud M, Stringhini S. Socioeconomic determinants of sodium intake in adult populations of high-income countries: a systematic review and meta-analysis. Am J Public Health 2017;107(4):e1–e12.Article
- 46. Kye S, Kwon SO, Lee SY, Lee J, Kim BH, Suh HJ, et al. Under-reporting of energy intake from 24-hour dietary recalls in the Korean National Health and Nutrition Examination Survey. Osong Public Health Res Perspect 2014;5(2):85–91. 24955317.ArticlePubMedPMC
- 47. Straßburg A, Eisinger-Watzl M, Krems C, Roth A, Hoffmann I. Comparison of food consumption and nutrient intake assessed with three dietary assessment methods: results of the German National Nutrition Survey II. Eur J Nutr 2019;58(1):193–210. 29189903.ArticlePubMedPDF
- 48. Trends in sodium intake, 2010-2020. Public Health Wkly Rep 2022;15(48):2914–2915.Article
- 49. World Health Organization (WHO). WHO Global Report on Sodium Intake Reduction. Geneva, Switzerland: WHO; 2023.
REFERENCES
REFERENCES
Figure & Data
REFERENCES
Citations
Citations to this article as recorded by 
- Associations of long working hours with the use of combustible cigarettes, electronic cigarettes, and heated tobacco products among young adults: a population-based study of South Korea
Seong-Uk Baek, Jin-Ha Yoon
Postgraduate Medical Journal.2026; 102(1209): 608. CrossRef - Long working hours increase the risk of insufficient dietary diversity: Findings among online ride-hailing drivers
Binshuo Hu, Cheng Chang, Xin Song, Zhihui Wang, Xiaoshun Wang, Xiaowen Ding, Hong Yu, Li Guan, Dongsheng Niu, Jue Li, Rui Guan, Tenglong Yan
Appetite.2026; 221: 108471. CrossRef - Comparative Effectiveness of Behavioural Sodium-Reduction Interventions for Intensive Systolic Blood Pressure Control in Populations with Elevated Blood Pressure: A Systematic Review and Network Meta-Analysis
Prapichaya Prommas, Manae Uchibori, Santosh Kumar Rauniyar, Shuhei Nomura
Nutrients.2026; 18(3): 428. CrossRef - Occupational Physical Activity and Blood Pressure: The Role of Leisure Time Physical Activity and Sex Differences
Soo-Hyeon Kim, Seunghyeon Cho, Hyeonjun Kim, Won-Ju Park
Journal of Korean Medical Science.2026;[Epub] CrossRef - Association Between the Korean Healthy Eating Index and Hyperuricemia Among Korean Adults
Heeju Son, Hee-Soo Lee, Seung-Yeon Lee, Wanhyung Lee
Journal of Korean Medical Science.2026;[Epub] CrossRef - Long Working Hours and Risk of Ischemic Heart Disease Among Japanese Workers: The Jichi Medical School Cohort Study
Mayumi Saiki, Akizumi Tsutsumi, Jian Li
Journal of Preventive Medicine and Public Health.2026; 59(2): 211. CrossRef - Association of long working hours with visceral adiposity index, anthropometric indices, and weight management behaviors: a study of Korean workers
Seong-Uk Baek, Jin-Ha Yoon
Family Practice.2025;[Epub] CrossRef - Gender discrimination in the workplace and the onset of problematic alcohol use among female wage workers: A longitudinal study in Korea
Seong-Uk Baek, Jin-Ha Yoon, Jong-Uk Won
Social Science & Medicine.2025; 379: 118183. CrossRef - Association between long working hours and poor cardiovascular health assessed by the American Heart Association’s “Life’s essential 8”: findings from a nationally representative sample of Korean workers (2014–2021)
Seong-Uk Baek, Jin-Ha Yoon
Postgraduate Medical Journal.2025; 101(1200): 980. CrossRef - Association Between Food Insecurity and Poor Cardiovascular Health Assessed by the Life’s Essential 8 Metric: A Population-Based Study of Korean Adults
Seong-Uk Baek, Jin-Ha Yoon
Nutrients.2025; 17(13): 2148. CrossRef - OECD Ülkelerinde Kadın Sağlığı Araştırmalarının: Eğilimlerini Analiz Etmek, Boşlukları ve Gelecek Yönelimlerini Belirlemek
Merve Tekinarslan
KutBilim Sosyal Bilimler ve Sanat Dergisi.2025; 5(1): 19. CrossRef - Sex Differences in the Association Between the Korean Healthy Eating Index and Liver Enzymes Among Korean Adults
Seong-Uk Baek, Jin-Ha Yoon
Nutrients.2025; 17(14): 2372. CrossRef - The physical activity paradox in the development of metabolic syndrome: Based on the Korea National Health and nutrition examination survey
Hyung Doo Kim, Tae-Won Jang
Preventive Medicine Reports.2025; 57: 103203. CrossRef - Shift work and dietary behaviors among Korean workers
Chung Ho Kim, Wanhyung Lee
Journal of Occupational Health.2025;[Epub] CrossRef - Flexible screen-printed graphene oxide-based biosensor for sweat sodium detection
L. Marini, P. Chithra Lekha, Roop L. Mahajan, T. Devasena
Current Applied Physics.2025; 80: 145. CrossRef - Association Between Exposure to Age Discrimination and Nutritional Risk: Findings from a Nationwide Sample of Older Adults in South Korea
Seong-Uk Baek, Jin-Ha Yoon
Nutrients.2025; 17(23): 3643. CrossRef - Temporary Employment Is Associated with Poor Dietary Quality in Middle-Aged Workers in Korea: A Nationwide Study Based on the Korean Healthy Eating Index, 2013–2021
Seong-Uk Baek, Myeong-Hun Lim, Yu-Min Lee, Jong-Uk Won, Jin-Ha Yoon
Nutrients.2024; 16(10): 1482. CrossRef
 Cite
CiteThe impact of long working hours on daily sodium intake

Fig. 1 Flowchart of participants.
Fig. 1
The impact of long working hours on daily sodium intake
| Characteristics | Total | Weekly working hours (hours) | ||||
|---|---|---|---|---|---|---|
| 36–40 | 40–52 | > 52 | ||||
| Total | 8,471 (100.0) | 3,387 (40.0) | 3,279 (38.7) | 1,805 (21.3) | ||
| Sex | < 0.001 | |||||
| Male | 4,681 (55.3) | 1,574 (46.5) | 1,864 (56.8) | 1,243 (68.9) | ||
| Female | 3,790 (44.7) | 1,813 (53.5) | 1,415 (43.2) | 562 (31.1) | ||
| Age (years) | < 0.001 | |||||
| 20–29 | 1,370 (16.2) | 575 (17.0) | 563 (17.2) | 232 (12.9) | ||
| 30–39 | 2,608 (30.8) | 997 (29.7) | 1,081 (33.0) | 530 (29.4) | ||
| 40–49 | 2,499 (29.5) | 1,057 (31.2) | 919 (28.0) | 523 (29.0) | ||
| 50–59 | 1,472 (17.4) | 571 (16.9) | 552 (16.8) | 349 (19.3) | ||
| 60 and older | 522 (6.2) | 187 (5.5) | 164 (5.0) | 171 (9.5) | ||
| Household income | < 0.001 | |||||
| Low | 293 (3.5) | 99 (2.9) | 107 (3.3) | 87 (4.8) | ||
| Mid-low | 1,734 (20.5) | 609 (18.0) | 661 (20.2) | 464 (25.7) | ||
| Mid-high | 2,861 (33.8) | 1,065 (31.4) | 1,154 (35.2) | 642 (35.6) | ||
| High | 3,583 (42.3) | 1,614 (47.7) | 1,357 (41.4) | 612 (33.9) | ||
| Education | < 0.001 | |||||
| Elementary | 342 (4.0) | 85 (2.9) | 107 (3.3) | 87 (4.8) | ||
| Middle school | 430 (5.1) | 119 (3.5) | 152 (4.6) | 159 (8.8) | ||
| High school | 2,681 (31.6) | 971 (28.7) | 1,006 (30.7) | 704 (39.0) | ||
| University | 5,018 (59.2) | 2,212 (65.3) | 1,992 (60.8) | 814 (45.1) | ||
| Body mass index | < 0.001 | |||||
| Normal | 5,813 (68.6) | 2,414 (71.3) | 2,245 (68.5) | 1,154 (63.9) | ||
| Overweight or obese | 2,658 (31.4) | 973 (28.7) | 1,034 (31.5) | 651 (36.1) | ||
| Drinking | < 0.001 | |||||
| Non-drinker | 6,944 (82.0) | 2,836 (83.7) | 2,698 (82.3) | 1,410 (78.1) | ||
| Drinker | 1,527 (18.0) | 551 (16.3) | 581 (17.7) | 395 (21.9) | ||
| Smoking | < 0.001 | |||||
| Non-smoker | 4,515 (53.3) | 2,043 (60.3) | 1,722 (52.5) | 750 (41.6) | ||
| Ex-smoker | 1,887 (22.3) | 711 (21.0) | 747 (22.8) | 429 (23.8) | ||
| Current smoker | 2,069 (24.4) | 633 (18.7) | 810 (24.7) | 626 (34.7) | ||
| Occupation group | < 0.001 | |||||
| Manual worker | 2,419 (28.6) | 725 (21.4) | 921 (28.1) | 773 (42.8) | ||
| Non-manual worker | 6,052 (71.4) | 2,662 (78.6) | 2,358 (71.9) | 1,032 (57.2) | ||
| Employment status | < 0.001 | |||||
| Full-time job | 7,319 (86.4) | 3,023 (89.3) | 2,830 (86.3) | 1,466 (81.2) | ||
| Temporary job | 910 (10.7) | 298 (8.8) | 367 (11.2) | 245 (13.6) | ||
| Day labor | 242 (2.9) | 66 (1.9) | 82 (2.5) | 94 (5.2) | ||
| Shiftwork | < 0.001 | |||||
| Day work | 7,334 (86.6) | 3,049 (90.0) | 2,847 (86.8) | 1,466 (79.7) | ||
| Shiftwork | 1,137 (13.4) | 338 (10.0) | 432 (13.2) | 367 (20.3) | ||
| Dining out | < 0.001 | |||||
| Less than once a week | 686 (8.1) | 235 (6.9) | 227 (6.9) | 224 (12.4) | ||
| 1–6 times a week | 3,881 (45.8) | 1,691 (49.9) | 1,495 (45.6) | 695 (38.5) | ||
| More than once a day | 3,904 (46.1) | 1,461 (43.1) | 1,557 (47.5) | 886 (49.1) | ||
| Characteristics | Total | Weekly working hours (hours) | Mean ± SD (mg) | |||
|---|---|---|---|---|---|---|
| 36–40 | 40–52 | > 52 | ||||
| Sodium (mg) | 3,946.8 ± 2,288.2 | 3,740.7 ± 2,086.5 | 4,042.0 ± 2,438.3 | 4,160.6 ± 2,338.2 | ||
| Excessive sodium intake | ||||||
| Less than 2 g | 1,383 (16.3) | 589 (17.4) | 521 (15.9) | 273 (15.1) | 1,431.2 ± 407.6 | |
| More than 2 g | 7,088 (83.7) | 2,798 (82.6) | 2,758 (84.1) | 1,532 (84.9) | 4,437.7 ± 2,179.3 | |
| Sodium intake quartilea | ||||||
| Q1 | 2,118 (25.0) | 909 (26.8) | 796 (24.3) | 413 (22.9) | 1,699.1 ± 498.0 | |
| Q2 | 2,118 (25.0) | 888 (26.2) | 801 (24.4) | 429 (23.8) | 2,957.8 ± 325.8 | |
| Q3 | 2,117 (25.0) | 875 (25.8) | 818 (24.9) | 424 (23.5) | 4,187.1 ± 416.1 | |
| Q4 | 2,118 (25.0) | 715 (21.1) | 864 (26.3) | 539 (29.9) | 6,943.4 ± 2,312.2 | |
| Blood pressure (mmHg) | ||||||
| Systolic | 113.8 ± 13.7 | 113.0 ± 13.9 | 113.6 ± 13.5 | 115.5 ± 13.6 | ||
| Diastolic | 76.1 ± 9.9 | 75.6 ± 9.9 | 76.0 ± 9.9 | 77.1 ± 9.8 | ||
| Characteristics | Weekly working hours (hours) | ||||
|---|---|---|---|---|---|
| 36–40 | 40–52 | > 52 | |||
| Totala | |||||
| Q1 vs. Q2 + Q3 + Q4 | 1 | 1.02 (1.00–1.05) | 1.03 (0.99–1.06) | 0.00 | |
| Q1 + Q2 vs. Q3 + Q4 | 1 | 1.06 (1.01–1.12)b | 1.08 (1.01–1.14)b | 0.00 | |
| Q1 + Q2 + Q3 vs. Q4 | 1 | 1.18 (1.08–1.30)b | 1.28 (1.15–1.43)b | 0.00 | |
| Malea | |||||
| Q1 vs. Q2 + Q3 + Q4 | 1 | 1.02 (0.99–1.05) | 1.01 (0.98–1.05) | 0.91 | |
| Q1 + Q2 vs. Q3 + Q4 | 1 | 1.07 (1.00–1.12) | 1.07 (1.00–1.14)b | 0.28 | |
| Q1 + Q2 + Q3 vs. Q4 | 1 | 1.17 (1.05–1.30)b | 1.22 (1.09–1.38)b | 0.00 | |
| Femalea | |||||
| Q1 vs. Q2 + Q3 + Q4 | 1 | 1.00 (0.97–1.06) | 1.00 (0.92–1.09) | 0.24 | |
| Q1 + Q2 vs. Q3 + Q4 | 1 | 0.98 (0.88–1.09) | 0.89 (0.76–1.05) | 0.45 | |
| Q1 + Q2 + Q3 Vs. Q4 | 1 | 1.03 (0.85–1.26) | 1.12 (0.85–1.47) | 0.06 | |
| Characteristics | Totala | Malea | Femalea | |
|---|---|---|---|---|
| Age (years) | ||||
| 20–29 | 1.00 | 1.00 | 1.00 | |
| 30–39 | 1.16 (1.02–1.31)b | 1.03 (0.90–1.19) | 1.21 (0.94–1.55) | |
| 40–49 | 1.05 (0.92–1.19) | 0.96 (0.83–1.12) | 0.90 (0.69–1.19) | |
| 50–59 | 1.11 (0.96–1.29) | 0.99 (0.83–1.17) | 1.06 (0.75–1.51) | |
| 60 and older | 0.82 (0.67–1.08) | 0.76 (0.59–0.97) | 0.73 (0.39–1.39) | |
| Drinker | ||||
| Non-drinker | 1.00 | 1.00 | 1.00 | |
| Drinker | 1.19 (1.09–1.31)b | 1.15 (1.05–1.26)b | 1.03 (0.73–1.47) | |
| Smoker | ||||
| Non-smoker | 1.00 | 1.00 | 1.00 | |
| Ex-smoker | 1.45 (1.31–1.61)b | 1.09 (0.97–1.23) | 0.82 (0.55–1.22) | |
| Current-smoker | 1.44 (1.30–1.59)b | 1.07 (0.95–1.20) | 0.95 (0.65–1.38) | |
| Household income | ||||
| Low | 1.00 | 1.00 | 1.00 | |
| Mid-low | 1.08 (0.84–1.40) | 1.02 (0.77–1.36) | 1.36 (0.72–2.47) | |
| Mid-high | 1.15 (0.89–1.48) | 1.07 (0.82–1.41) | 1.61 (0.90–2.89) | |
| High | 1.13 (0.88–1.46) | 1.01 (0.77–1.33) | 1.90 (1.07–3.40)b | |
| Education | ||||
| Elementary | 1.00 | 1.00 | 1.00 | |
| Middle school | 0.96 (0.71–1.31) | 1.11 (0.78–1.57) | 0.48 (0.24–0.97) | |
| High school | 1.08 (0.84–1.40) | 1.06 (0.78–1.44) | 0.85 (0.50–1.44) | |
| University | 1.12 (0.85–1.46) | 1.07 (0.78–1.47) | 0.67 (0.38–1.19) | |
| Job | ||||
| Non-manual worker | 1.00 | 1.00 | 1.00 | |
| Manual worker | 1.14 (1.03–1.26)b | 1.04 (0.93–1.15) | 1.03 (0.78–1.37) | |
| Shiftwork | ||||
| Day work | 1.00 | 1.00 | 1.00 | |
| Shiftwork | 0.94 (0.80–1.02) | 0.87 (0.77–1.00) | 1.04 (0.78–1.38) | |
| Employment status | ||||
| Full-time job | 1.00 | 1.00 | 1.00 | |
| Temporary job | 0.87 (0.75–1.02) | 0.87 (0.72–1.04) | 1.16 (0.90–1.49) | |
| Day labor | 1.02 (0.80–1.29) | 1.00 (0.78–1.29) | 1.12 (0.57–2.19) | |
| Frequency of dining out | ||||
| Less than once a week | 1.00 | 1.00 | 1.00 | |
| 1–6 times a week | 1.37 (1.10–1.70)b | 1.25 (0.96–1.63) | 1.39 (0.96–2.02) | |
| More than once a day | 1.67 (1.34–2.08)b | 1.46 (1.12–1.90)b | 1.60 (1.09–2.35)b | |
| Weekly working hours (hours) | ||||
| 36–40 | 1.00 | 1.00 | 1.00 | |
| 40–52 | 1.18 (1.08–1.30)b | 1.17 (1.05–1.30)b | 1.03 (0.85–1.26) | |
| > 52 | 1.28 (1.15–1.43)b | 1.22 (1.09–1.38)b | 1.12 (0.85–1.47) | |
Table 1 Demographic characteristics of the study participants
Table 2 Sodium intake and blood pressure according to working hours per week
SD: standard deviation.
aQ1: 153.1–2,389.3 mg, Q2: 2,390.0–3,519.0 mg, Q3: 3,520.0–4,961.0 mg, Q4: 4,962.0–28,112.0 mg.
Table 3 Adjusted prevalence ratios of daily sodium intake quartiles associated with weekly working hours
Values are presented as prevalence ratio (95% confidence interval).
aAdjusted for age, drinking, smoking, household income, education, job, employment, shiftwork, and frequency of dining out.
b
Table 4 Adjusted prevalence ratios of Q1 + Q2 + Q3 and Q4 of daily sodium intake
Values are presented as prevalence ratio (95% confidence interval).
aAdjusted for age, drinking, smoking, household income, education, job, employment, shift work, and frequency of dining out.
b

