
Articles
- Page Path
- HOME > Ann Occup Environ Med > Volume 30; 2018 > Article
- Research Article The association between long working hours and work-related musculoskeletal symptoms of Korean wage workers: data from the fourth Korean working conditions survey (a cross-sectional study)
- Jae-Gwang Lee, Guang Hwi Kim, Sung Won Jung, Sang Woo Kim, June-Hee Lee, Kyung-Jae Lee
-
Annals of Occupational and Environmental Medicine 2018;30:67.
DOI: https://doi.org/10.1186/s40557-018-0278-0
Published online: December 3, 2018
Department of Occupational and Environmental Medicine, Soonchunhyang University Hospital, Seoul, South Korea
• Received: May 8, 2018 • Accepted: November 8, 2018
© The Author(s). 2018
Open AccessThis article is distributed under the terms of the Creative Commons Attribution 4.0 International License (http://creativecommons.org/licenses/by/4.0/), which permits unrestricted use, distribution, and reproduction in any medium, provided you give appropriate credit to the original author(s) and the source, provide a link to the Creative Commons license, and indicate if changes were made. The Creative Commons Public Domain Dedication waiver (http://creativecommons.org/publicdomain/zero/1.0/) applies to the data made available in this article, unless otherwise stated.
Abstract
-
Background It has been reported that long working hours are hazardous to the workers’ health. Especially, work-related musculoskeletal disorders (WMSDs) have been considered as one of the significant health issues in workplace. The objective of this study was to identify the association between long working hours and work-related musculoskeletal symptoms.
-
Methods The analysis was conducted using data from the Fourth Korean Working Conditions Survey (KWCS). Subjects of this study were 24,783 wage workers and divided into three groups according to the weekly working hours, which were ≤ 40, 41–52 and > 52 h. The relationship between long working hours and work-related musculoskeletal symptoms was analyzed by multivariate logistic regression method after adjusting for general, occupational characteristics including specific working motions or postures and psychosocial factors.
-
Results Approximately 18.4% of subjects worked more than 52 h per week and 26.4 and 16.4% of male subjects and 33.0 and 23.4% of female subjects experienced work-related upper and lower limb pains, respectively, over the last 12 months. Moreover, the prevalence of upper and lower limb pain was increased in both genders as the weekly working hours increased. The odds ratios (ORs) of upper limb pain for those working 41–52 h and more than 52 h per week when adjusted for general, occupational characteristics including specific motions or postures and psychosocial factors were 1.36 and 1.40 for male workers and 1.26 and 1.66 for female workers compared to the reference group, respectively. Furthermore, ORs of lower limb pain for the same weekly working hour groups were 1.26 and 1.47 for male workers and 1.20 and 1.47 for female workers, respectively.
-
Conclusions Long working hours were significantly related to work-related musculoskeletal symptoms in Korean wage workers and appropriate interventions should be implemented to reduce long working hours that can negatively affect workers’ health.
Background
As the industry develops increasingly, not only preexisting jobs have been expanded, but also new jobs have been come into being in plenty of fields of industry. Furthermore, for several jobs, there have been an extension of working hours and an introduction of night shift in duty to achieve an increase in productivity [1]. Especially in South Korea, not only changes in lifestyle of people made it possible to emerge stores which open 24 h such as convenience stores, cafés, or fast food stores but also the number of workers who work with long duty hours has increased because of comparatively higher wage of extended work or shift work [2]. According to the statistics from Organization for Economic Cooperation and Development (OECD), average weekly working hours of Korean workers in 2016 were 43.7 which was fourth highest and also exceeded by more than six hours compared to the average time of OECD countries [3]. Meanwhile, worker’s health issue which is caused by long working hours has received much attention because it is an important consideration to both employers and society in addition to workers themselves. Sickness of workers can cause decrease in efficiencies of work and subsequently reduce productivity in workplace as well as increase in socioeconomic burden [4]. Previous studies have shown the negative impact of long working hours on workers’ increased risk of hypertension [5, 6], coronary heart disease [7], stroke [8], anxiety [9], depression [10, 11], and occupational injuries [12, 13].
Meanwhile, prevalence of musculoskeletal disorders (MSDs) has been increased and considered as one of the significant health problems in workplace. According to the annual report about industrial injuries from Korean Ministry of Employment and Labor, work-related MSDs (WMSDs) accounted for 74.15, 71.80, and 68.41% of the occupational diseases in 2014, 2015, and 2016, respectively [14]. This implies that even though the proportion of the WMSDs among occupational diseases has tended to decrease slightly, they still occupy a significant portion in occupational diseases and need to be reduced much more.
Some studies have shown risk factors of WMSDs. Bernard et al. found epidemiological evidence of physical factors which are able to affect MSDs of upper extremity, lower extremity, and neck in their review article [15]. Several factors have been related to WMSDs such as awkward and/or sustained postures, excessive force, repetitive motion, and prolonged sitting or standing. Moreover, psychosocial factors such as occupational stress [16, 17], low social support, and job insecurity [18] are also considered to be related to WMSDs. Several studies have focused on the influence of work schedules on the prevalence of WMSDs. Two studies found that long work hours were associated with increased healthcare provider visits or short-term disability claims [19, 20]. Furthermore, Engkvist et al. [21] and Krause et al. [22] reported that long work hours were related to increase in back pain among nurses and transit operators, respectively. Another study showed that the combination of extended shifts and long working hours was linked to self-reported symptoms of the neck, shoulder, and back while controlling for age [23]. However, few studies have investigated the contribution of long working hours to WMSDs in South Korea. Shin at al. [24] showed that one of the risk factors of worker’s lower back pain was working more than 45 h per week and Lee [25] found in his cohort study that workers who consistently worked more than 48 h per week had a higher risk of lower back pain and the prevalence of lower back pain was decreased in case that working hours were reduced.
The purpose of this study was to identify the association between long working hours and work-related musculoskeletal symptoms of Korean wage workers using data from the Fourth Korean Working Conditions Survey (KWCS). While lower back pain is one of the typical musculoskeletal symptoms, we focused on the upper and lower limb pain as the work-related musculoskeletal symptoms because the upper and lower limb pains are important musculoskeletal symptoms and there have been few studies analyzing the relationship between long working hours and workers’ limb pain especially in Korean workers. In addition, the analysis was performed with gender stratification because the influence of a risk factor on specific type of occupation could differ in gender in industrial health researches [26, 27].
Methods
This study was based on data from the Fourth KWCS conducted by the Korea Occupational Safety and Health Agency in 2014. Subjects of KWCS were economically active Korean employed workers aged from 15 or more. Total 50,007 people responded the survey and 24,783 wage workers aged not fewer than 20 were selected for this study, excluding military personnel or workers employed in agriculture or forestry who occupy a small amount of respondents and those who refused to answer or left required fields of questionnaire blank. Because most workers aged below 20 work in part-time jobs temporarily and were low in number (n = 361), they were excluded from the study subjects [28, 29]. In addition, entering an aging society, there are jobs which have no legal retirement age such as security guards and therefore, aged workers are active in economic activity after their retirement. As a result, we did not set upper limit of age of the study population.
General characteristics
Gender, age, educational status, and monthly income were considered as general characteristics of study population to analyze the influence on the work-related musculoskeletal symptoms. Age was divided into five groups of 20–29, 30–39, 40–49, 50–59 and more than 60. Educational status was categorized as middle school graduate or below, high school graduate, and college graduate or above. Also, monthly income was categorized as below 1,300,000, 1,300,000-1,999,000, 2,000,000-2,999,000, and 3,000,000 or more whose unit is Korean won.
Occupational characteristics
Occupational characteristics included type of occupation, employment status, shift work, scale of workplace, weekly working hours, and presence of specific working motions or postures. Type of occupation was divided into five groups of manager/professional, office worker, technician, service or sales worker, and manual worker. The manual workers included security guards, street cleaners, couriers, or parking guides. Also, employment status was categorized as regular workers and temporary/day labor workers. Shift work was simply divided into two groups, i.e., doing shift work or not. Scale of workplace was categorized based on the number of employees as below 50, 50–299, and 300 or more. Presence of specific motions or postures during work were evaluated using the following question: “Does your main paid job involve the followings?” and the specific motions or postures included lifting or moving people, carrying heavy loads, standing continuously, repetitive hand or arm movements, and working with computers. Study subjects were asked to check the corresponding proportion of time that each specific motion or posture occupies during work such as “all of the time”, “almost all of the time”, “around 3/4 of the time”, “around half of the time”, “around 1/4 of the time”, “almost never” or “never”. With the answers we dichotomized results into “No” if subject checked “never” or “Yes” if subject checked others.
Job stress and social support were considered as psychosocial characteristics. Each of them was asked as the following questions, respectively: “You experience stress in your work,” and “Your colleagues help and support you.” Subjects answered each question checking one of the examples such as “Always”, “Most of the time”, “Sometimes,” “Rarely”, or “Never” and were divided into low or high group according to the median score which was calculated by scoring each answers [30].
Weekly working hours, the independent variable of this study, were asked as the following question: “How many hours do you usually work per week in your main paid job?” Lunch break and commuting time were excluded from calculating the working hours. According to the Article 50 of the Korean Labor Standards Act, regular working hours per week in South Korea shall not exceed 40 h on average excluding recess hours; however, in case parties concerned reach agreement, the working hours per week may be extended up to 52 h [31]. Therefore, in this study, ‘long working hours’ were defined as more than 40 h per week and all study subjects were included in one of the following three groups in terms of working hours per week: less than or equal to 40 h, from 41 to 52 h, and more than 52 h.
Musculoskeletal symptoms
Musculoskeletal symptoms among study subjects, the dependent variable of this study, were investigated using the following question: “Over the last 12 months, did you have any of the following health problems?” Symptoms were largely divided into two groups. One of them was muscular pains in shoulders, neck and/or upper limbs (arms, elbow, wrists, hands etc.) and another was muscular pains in lower limbs (hips, legs, knees, feet etc.). In addition, we analyzed only results that subjects answered “Yes” in the following question: “Were the health problems related to your work?”
Statistical analysis
To determine factors contributing to weekly working hours and musculoskeletal symptoms in terms of the general and occupational characteristics of study subjects, the chi-square tests were performed. Moreover, multivariate logistic regression was implemented so as to analyze the relationship between weekly working hours and musculoskeletal symptoms by calculating odds ratios (ORs) and 95% confidential interval (CI) regarding two models: Model 1 was adjusted for gender, age, educational status, occupation, monthly income, employment status, shift work, and scale of workplace and Model 2 was adjusted for specific working motions or postures, job stress, and social support in addition to the covariates which were used in Model 1. All statistical analyses were performed using the SPSS version 18.0 (SPSS Inc., Chicago, IL, USA) and the level of statistical significance was set at p < 0.05.
Results
There were 11,890 (48.8%) female and 12,893 (52.0%) male subjects among total 24,783 study population and 53.5, 28.1 and 18.4% of all subjects worked ≤40, 41–52, and > 52 h per week, respectively (Table 1). The average age of the subjects was 43.4 years old and the age group of 30s (30.6%) and 60 years and more (23.9%) showed the largest proportions of working 41–52 and > 52 h per week, respectively. The greatest proportion of long working hours (> 40 h per week) was shown among workers whose final educational background was a high school (54.3%) and monthly income was in the range of 1,300,000-1,999,000 won (58.1%). In addition, 34.8% of technicians worked 41–52 h per week which was the largest proportion compared to the other occupations with respect to the same weekly working hours and 23.7% of service or sales workers and manual workers worked more than 52 h per week, which was the largest proportion regarding the same weekly working hours. Regular workers (48.7%), workers who had shift work (58.0%) and workers working in the workplace where the number of employees was under 50 (49.0%) showed the largest proportion of long working hours.
Table 1
General and occupational characteristics of subjects associated with the weekly working hours
In this study, 26.4 and 16.4% of male workers experienced work-related upper and lower limb pain over the last 12 months (Table 2) and 33.0 and 23.4% of female workers experienced the same symptoms, respectively, during the same period of time (Table 3). The proportions of having upper and lower limb pains in both genders tended to be increasing as the age of subjects was higher and the educational status or monthly income were lower except that the greatest proportion for upper limb pain of male workers was shown in the 1,300,000-1,999,000 won. In terms of occupation, the largest proportions were shown in the manual workers for upper and lower limb pains in both genders. The proportion of temporary or day labor workers with musculoskeletal symptoms was higher than that of the regular workers for both male and female workers. Furthermore, workers who did shift work and who worked in the workplaces where the number of employees was under 50 tended to experience upper and lower limb pain more compared to the workers who did not shift work and those working in the larger scale of workplaces for both genders. For the presence of specific working motions or postures, the proportions of having work-related musculoskeletal symptoms were shown to be larger when carrying heavy loads, standing continuously, and repetitive movement of arms or hands were included during work in both genders. Meanwhile, male and female workers who lift or carry people in their work process showed not much difference in prevalence of musculoskeletal symptoms compared to the workers who did not such working motions. As workers were under higher job stress and lower social support, they tended to have work-related musculoskeletal symptoms more.
Table 2
General and occupational characteristics of male subjects associated with the work-related musculoskeletal symptoms
Table 3
General and occupational characteristics of female subjects associated with the work-related musculoskeletal symptoms
To investigate the relationship between the weekly working hours and work-related musculoskeletal symptoms, multivariate logistic regression analysis was implemented with gender stratification (Table 4). Compared with the reference group whose weekly working hours were ≤ 40, the ORs of prevalence of work-related upper limb pain for those working 41–52 h and > 52 h per week were 1.50 (95% CI 1.37–1.65) and 1.90 (95% CI 1.73–2.10), respectively, in male workers. On the other hand, the ORs of prevalence of upper limb pain in female workers were 1.22 (95% CI 1.12–1.33) and 1.96 (95% CI 1.76–2.18). With regard to lower limb pain, the ORs for those working 41–52 h and > 52 h per week were 1.39 (95% CI 1.24–1.55) and 2.09 (95% CI 1.87–2.34), respectively, in male workers. In female workers, the ORs of prevalence of lower limb pain were 1.17 (95% CI 1.06–1.29) and 1.98 (95% CI 1.77–2.22).
Table 4
Odds ratios and 95% confidence intervals of work-related musculoskeletal symptoms with gender stratification
When adjusted for general (gender, age, educational status, and monthly income) and occupational (occupation, employment status, shift work, and number of employees) characteristics, the ORs of upper limb pain were 1.37 (95% CI 1.24–1.51) and 1.47 (95% CI 1.32–1.64) for male workers working 41–52 h and > 52 h per week, respectively in Model 1. Furthermore, the ORs of male workers for the same weekly working hour groups were 1.27 (95% CI 1.13–1.43) and 1.52 (95% CI 1.34–1.73), respectively, regarding lower limb pain. On the other hand, the ORs of female workers were 1.28 (95% CI 1.16–1.41) and 1.77 (95% CI 1.57–2.00) for upper limb pain and 1.23 (95% CI 1.10–1.38) and 1.60 (95% CI 1.40–1.82) for lower limb pain in Model 1.
In addition to the characteristics which were adjusted in Model 1, specific working motions or postures (lifting or carrying people, carrying heavy loads, standing continuously, repetitive movement of arm or hands and computer work) and psychosocial factors (job stress and social support) were also adjusted in Model 2. The ORs of upper limb pain were 1.36 (95% CI 1.23–1.50) and 1.40 (95% CI 1.25–1.57) for male workers working 41–52 h and > 52 h per week, respectively. Also, the ORs of lower limb pain in male workers were 1.26 (95% CI 1.11–1.42) and 1.47 (95% CI 1.29–1.68) for those working 41–52 h and > 52 h per week, respectively. On the other hand, the ORs of upper limb pain were 1.26 (95% CI 1.14–1.39) and 1.66 (95% CI 1.46–1.89) for female workers working 41–52 h and > 52 h per week and the ORs of lower limb pain were 1.20 (95% CI 1.07–1.35) and 1.47 (95% CI 1.28–1.69) for the same weekly working hour groups in female workers, respectively.
To investigate the distribution of age according to the occupation of study subjects, frequency analysis was performed (Fig. 1). Age group of 30–39 (green bar) and 40–49 (grey bar) occupied the greater proportions in managers or professionals, office workers, and technicians than any other occupations. Among service or sales workers, the age group of 40–49 showed the largest proportion (29.7%) and the age group of 60 years and more (yellow bar) was the most prevalent (44.3%) among manual workers. On the other hand, among age group of 60 years and more, manual workers (62.0%) showed the largest proportion than any other occupations.
Fig. 1
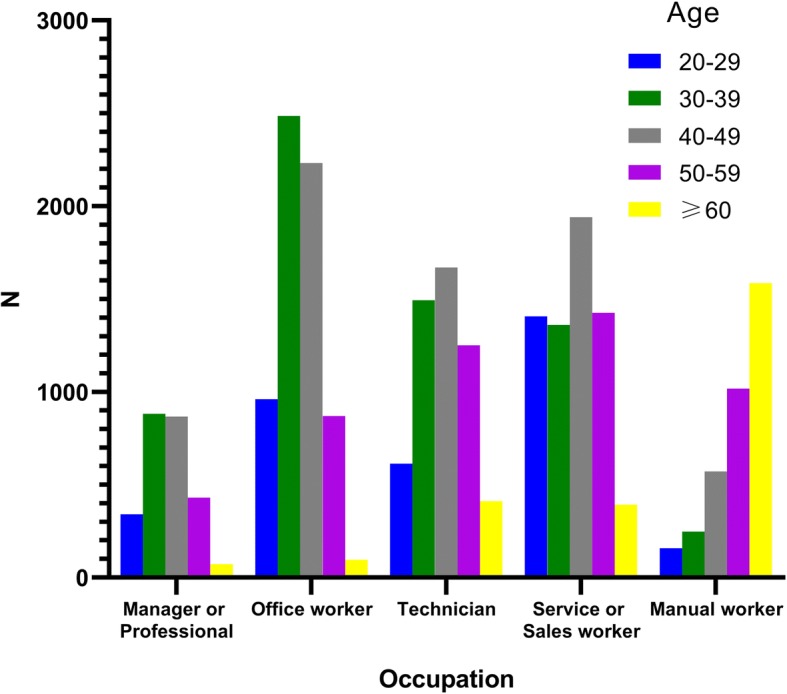
Relationship between age groups and occupations of subjects. Blue bar indicates the age group of 20–29 years. Green bar indicates the age group of 30–39 years. Grey bar indicates the age group of 40–49 years. Purple bar indicates the age group of 50–59 years. Yellow bar indicates the age group of 60 years and more
Discussion
In this study, we investigated the association between long working hours and work-related musculoskeletal symptoms among Korean wage workers. The results of analysis showed that as the working hours per week increased, the prevalence of upper and lower limb pain that workers experienced were also higher compared to the reference group of weekly working hours. The result also remained valid when adjusted for general and occupational characteristics in Model 1 and 2. Therefore, we found that long working hours independently increased workers’ prevalence of work-related musculoskeletal symptoms. This finding is also consistent with previous studies showing the relationship between the long working hours and WMSDs. Data from 24 years of follow-up has shown that the overtime work was associated with the diagnosis of shoulder disorders in women workers (Prevalence ratio [PR] 2.7; 95% CI 1.1–6.9) [32]. Furthermore, it was reported that working more than 13 h per day was one of the risk factors significantly related to neck, shoulder and back disorders in nurses (OR 1.94, OR 1.87, and OR 1.87 for neck, shoulder and back, respectively) [33]. Working 48 h and more per week was also shown to be associated with the elevated risk of back pain of those working in small and medium-sized 26 manufacturing companies (OR 1.98; 95% CI 1.02–3.83) [25].
WMSDs are known to be in strong association with the physical demands such as repetitive movement, awkward postures, and heavy lifting or pushing in the job [15]. The relationship between long working hours and the risk of WMSDs can be explained by the hypothesis that as the working hours increase, time exposed to the physical demands during work increases as well and this consequently could affect the higher prevalence of musculoskeletal diseases. In addition to such an ergonomic aspect, increase in working hours can cause relative reduction in recovery time of accumulated fatigue and leisure time to relieve stresses [2]. As a result, such factors complexly and cumulatively influence on worker’s musculoskeletal system and finally could induce WMSDs.
Another important finding of this study was that the proportion of workers working more than 52 h per week among the age group of 60 years and more (23.9%) was larger than that of other age groups. Furthermore, the type of occupation occupying the largest proportion among the age group of 60 years and more was the manual work (62.0%) when analyzing the distribution of occupations with regard to each age group. Considering the result that prevalence of musculoskeletal symptoms was the highest in the age group of 60 years and more and in the manual workers, these results imply that aged workers are more vulnerable to WMSDs because physical demands which can be a high burden to worker’s body are relatively higher in manual workers than any other occupations and the old age itself even increases the risk of WMSDs in that aged workers generally have worked for longer period of times than younger workers, so there could be the cumulative effect. Therefore, it is important to draw up any preventive measures or intervention programs to decrease WMSDs especially for aged workers. Moreover, the social structure in which aged people have a lot of physical labor should be changed.
Comparing the prevalence of work-related musculoskeletal symptoms of male workers with that of female workers, proportion of having work-related upper limb pain was larger in female workers than male workers and also larger in female workers for lower limb pain. This result is consistent with previous studies showing that the prevalence of work-related musculoskeletal symptoms was more frequent in female workers [34, 35]. Factors that increase the prevalence of musculoskeletal symptoms in female workers could be the burden of housework which women mostly take charge of other than men, tendency to express symptoms exaggeratingly in women and physiologic features that make women more vulnerable to musculoskeletal disease such as strength of muscles, difference of muscle fiber type and distribution, difference in hormones, and pregnancy [36]. On the other hand, except that the ORs of upper limb pain for female workers were shown to be higher than those for male workers as the weekly working hour exceeded 52 h, we found that the ORs of musculoskeletal symptoms for female workers were not always higher than those for male workers as the weekly working hour increased.
There are a few limitations in this study. First, while we showed the association between long working hours and work-related musculoskeletal symptoms, the results do not explain the causal relationship between them because this study was designed as a cross-sectional study. To identify the causality or temporal relationship between long working hours and musculoskeletal symptoms, further longitudinal studies should be performed. Second, this study was based on the Fourth KWCS which consists of a self-report questionnaire and therefore, there was a possibility of an information bias. Third, there might be other personal factors such as height, weight, exercise, or previous history of musculoskeletal diseases, which could affect the prevalence of musculoskeletal symptoms. However, such factors were not considered all in this study because of data limitations. Fourth, musculoskeletal symptoms analyzed in this study do not exactly mean the musculoskeletal disease because ‘symptoms’ are based on the subjective feelings of individuals, but ‘diseases’ are based on the objective diagnostic criteria. However, it is meaningful to analyze the prevalence of musculoskeletal symptoms in workplaces to prevent the occurrence of WMSDs because almost all musculoskeletal symptoms are accompanied by or come before the musculoskeletal diseases.
Despite these limitations, there are several strengths in this study. First, the data, KWCS, which we used is a representative national survey that investigated working conditions and worker’s health issue and provides reliable samples of Korean workers. Second, different from previous studies which limited in the specific occupational group, this study showed the relationship between long working hours and work-related musculoskeletal symptoms for various types of occupation. Third, there have been few studies about the association between long working hours and work-related upper and lower limb symptoms in Korea, thus this study can be a valuable reference for future researches.
Conclusions
In conclusion, long working hours were associated with musculoskeletal symptoms in Korean wage workers. Further studies are necessary to find the concrete mechanism by which long working hours affect the prevalence of WMSDs and to show the causal relationship between them. Moreover, appropriate interventions should be implemented to reduce long working hours that can affect workers’ health and the optimal reference working hours should be set because the legal working hours differ from country to country.
Acknowledgements
None.
Not applicable.
Data sharing not applicable to this article as no datasets were generated or analyzed during the current study.
Abbreviations
CI
Confidence Interval
KRW
Korean Won
KWCS
Korean Working Conditions Survey
OECD
Organization for Economic Cooperation and Development
OR
Odds Ratio
PR
Prevalence Ratio
WMSD
Work-related Musculoskeletal Disorder
- 1. Costa Giovanni, Haus Erhard, Stevens Richard. Shift work and cancer – considerations on rationale, mechanisms, and epidemiology. Scandinavian Journal of Work, Environment & Health 2010;36(2):163–179. 10.5271/sjweh.2899.ArticlePubMed
- 2. Caruso CC, Bushnell T, Eggerth D, Heitmann A, Kojola B, Newman K, Rosa RR, Sauter SL, Vila B. Long working hours, safety, and health: toward a National Research Agenda. Am J Ind Med 2006;49:930–942. 10.1002/ajim.20373. 16948157.ArticlePubMed
- 3. https://stats.oecd.org/Index.aspx?DataSetCode=AVE_HRS.
- 4. Caruso CC. Possible broad impacts of long work hours. Ind Health 2006;44:531–536. 10.2486/indhealth.44.531. 17085913.ArticlePubMed
- 5. Nakanishi N, Yoshida H, Nagano K, Kawashimo H, Nakamura K, Tatara K. Long working hours and risk for hypertension in Japanese male white collar workers. J Epidemiol Community Health 2001;55:316–322. 10.1136/jech.55.5.316. 11297649.ArticlePubMedPMC
- 6. Yang H, Schnall PL, Jauregui M, Su T-C, Baker D. Work hours and self-reported hypertension among working people in California. Hypertension 2006;48:744–750. 10.1161/01.HYP.0000238327.41911.52. 16940208.ArticlePubMed
- 7. Virtanen M, Heikkilä K, Jokela M, Ferrie JE, Batty GD, Vahtera J, Kivimäki M. Long working hours and coronary heart disease: a systematic review and meta-analysis. Am J Epidemiol 2012;176:586–596. 10.1093/aje/kws139. 22952309.ArticlePubMedPMC
- 8. Kivimäki M, Jokela M, Nyberg ST, Singh-Manoux A, Fransson EI, Alfredsson L, Bjorner JB, Borritz M, Burr H, Casini A. Long working hours and risk of coronary heart disease and stroke: a systematic review and meta-analysis of published and unpublished data for 603 838 individuals. Lancet 2015;386:1739–1746. 10.1016/S0140-6736(15)60295-1. 26298822.ArticlePubMed
- 9. Kleppa E, Sanne B, Tell GS. Working overtime is associated with anxiety and depression: the Hordaland health study. J Occup Environ Med 2008;50:658–666. 10.1097/JOM.0b013e3181734330. 18545093.ArticlePubMed
- 10. Amagasa T, Nakayama T. Relationship between long working hours and depression: a 3-year longitudinal study of clerical workers. J Occup Environ Med 2013;55:863–872. 10.1097/JOM.0b013e31829b27fa. 23924827.PubMed
- 11. Virtanen M, Ferrie JE, Singh-Manoux A, Shipley MJ, Stansfeld SA, Marmot MG, Ahola K, Vahtera J, Kivimäki M. Long working hours and symptoms of anxiety and depression: a 5-year follow-up of the Whitehall II study. Psychol Med 2011;41:2485–2494. 10.1017/S0033291711000171. 21329557.ArticlePubMedPMC
- 12. Dembe AE, Erickson JB, Delbos RG, Banks SM. The impact of overtime and long work hours on occupational injuries and illnesses: new evidence from the United States. Occup Environ Med 2005;62:588–597. 10.1136/oem.2004.016667. 16109814.ArticlePubMedPMC
- 13. Folkard S, Lombardi DA. Modeling the impact of the components of long work hours on injuries and “accidents”. Am J Ind Med 2006;49:953–963. 10.1002/ajim.20307. 16570251.ArticlePubMed
- 14. :. http://www.kosha.or.kr/board.do?menuId=554.
- 15. Bernard BP, Putz-Anderson V. Musculoskeletal disorders and workplace factors; a critical review of epidemiologic evidence for work-related musculoskeletal disorders of the neck, upper extremity, and low back. 1997.
- 16. Kim MG, Kim K-S, Ryoo J-H, Yoo S-W. Relationship between occupational stress and work-related musculoskeletal disorders in Korean male firefighters. Annals of occupational and environmental medicine 2013;25:9. 10.1186/2052-4374-25-9. 24472292.ArticlePubMedPMCPDF
- 17. Leino P. Symptoms of stress predict musculoskeletal disorders. J Epidemiol Community Health 1989;43:293–300. 10.1136/jech.43.3.293. 2636881.ArticlePubMedPMC
- 18. Amin NA, Nordin R, Fatt QK, Noah RM, Oxley J. Relationship between psychosocial risk factors and work-related musculoskeletal disorders among public hospital nurses in Malaysia. Annals of occupational and environmental medicine 2014;26:23. 10.1186/s40557-014-0023-2. 25852937.ArticlePubMedPMCPDF
- 19. Josephson M, Ahlberg G, Härenstam A, Svensson H, Theorell T, Wiktorin C, Vingård E. Paid and unpaid work, and its relation to low back and neck/shoulder disorders among women. Women & health 2003;37:17–30. 10.1300/J013v37n02_02. 12733551.ArticlePubMed
- 20. O'Brien-Pallas L, Shamian J, Thomson D, Alksnis C, Koehoorn M, Kerr M, Bruce S. Work-related disability in Canadian nurses. J Nurs Scholarsh 2004;36:352–357. 10.1111/j.1547-5069.2004.04063.x. 15636416.ArticlePubMed
- 21. Engkvist I-L, Hjelm EW, Hagberg M, Menckel E, Ekenvall L. Risk indicators for reported overexertion back injuries among female nursing personnel. Epidemiology 2000;11:519–522. 10.1097/00001648-200009000-00006. 10955403.ArticlePubMed
- 22. Krause N, Rugulies R, Ragland DR, Syme SL. Physical workload, ergonomic problems, and incidence of low back injury: a 7.5-year prospective study of San Francisco transit operators. Am J Ind Med 2004;46:570–585. 10.1002/ajim.20094. 15551390.ArticlePubMed
- 23. Lipscomb Jane A, Trinkoff Alison M, Geiger-Brown Jeanne, Brady Barbara. Work-schedule characteristics and reported musculoskeletal disorders of registered nurses. Scandinavian Journal of Work, Environment & Health 2002;28(6):394–401. 10.5271/sjweh.691.ArticlePubMed
- 24. Shin KS, Chung YK, Lee HE. Prevalence and risk factors of work-related low back pain among operators and drivers of transportation vehicle. Korean Journal of Occupational and Environmental Medicine 2012;24:11–19.ArticlePDF
- 25.
- 26. Messing K, Punnett L, Bond M, Alexanderson K, Pyle J, Zahm S, Wegman D, Stock SR, de Grosbois S. Be the fairest of them all: challenges and recommendations for the treatment of gender in occupational health research. Am J Ind Med 2003;43:618–629. 10.1002/ajim.10225. 12768612.ArticlePubMed
- 27. Yoon J, Sung H, Kim Y, Kim S-S. The relationship between experience of workplace violence and musculoskeletal pain among wage Workers in South Korea. Journal of Korean Society of Occupational and Environmental Hygiene 2015;25:211–219. 10.15269/JKSOEH.2015.25.2.211.Article
- 28. Jung SW, Lee K-J, Lee HS, Kim GH, Lee JG, Kim JJ, Lee J-H. Relationship of activities outside work to sleep and depression/anxiety disorders in Korean workers: the 4th Korean working condition survey. Annals of occupational and environmental medicine 2017;29:51. 10.1186/s40557-017-0206-8. 29046812.ArticlePubMedPMCPDF
- 29. Seok H, Yoon J-H, Lee W, Lee J-H, Jung PK, Kim I, Won J-U, Roh J. The association between concealing emotions at work and medical utilization in Korea. Annals of occupational and environmental medicine 2014;26:31. 10.1186/s40557-014-0031-2. 25852941.ArticlePubMedPMCPDF
- 30. Yoo T, Ye B, Kim J-I, Park S. Relationship of workplace violence and perpetrators on sleep disturbance-data from the 4th Korean working conditions survey. Annals of occupational and environmental medicine 2016;28:59. 10.1186/s40557-016-0142-z. 27777783.ArticlePubMedPMCPDF
- 31. http://www.moel.go.kr/english/download_eng.jsp?type=&file=(31)LABORSTANDARDSACT_2012.pdf.
- 32. Fredriksson K, Alfredsson L, Köster M, Thorbjörnsson CB, Toomingas A, Torgén M, Kilbom A. Risk factors for neck and upper limb disorders: results from 24 years of follow up. Occup Environ Med 1999;56:59–66. 10.1136/oem.56.1.59. 10341748.ArticlePubMedPMC
- 33. Trinkoff AM, Le R, Geiger-Brown J, Lipscomb J, Lang G. Longitudinal relationship of work hours, mandatory overtime, and on-call to musculoskeletal problems in nurses. Am J Ind Med 2006;49:964–971. 10.1002/ajim.20330. 16691609.ArticlePubMed
- 34. Kim BK, Park CY, Yim HW, Koo JW, Lee KS. Selection of a high risk group and the effectiveness of an exercise program on musculoskeletal symptoms in small and medium sized enterprises. Korean Journal of Occupational and Environmental Medicine 2005;17:10–25.ArticlePDF
- 35. Park SG, Lee JY. Characteristics and odds ratio of work related musculoskeletal disorders according to job classification in small-to-medium-sized enterprises. Korean Journal of Occupational and Environmental Medicine 2004;16:422–435.ArticlePDF
- 36. Kim HR, Won JU, Song JS, Kim CN, Kim HS, Roh JH. Pain related factors in upper extremities among hospital workers using video display terminals. Korean Journal of Occupational and Environmental Medicine 2003;15:140–149.ArticlePDF
REFERENCES
Notes
Figure & Data
REFERENCES
Citations
Citations to this article as recorded by 
- Using Ecological Momentary Assessment (EMA) to understand occupation from the perspective of the experiencing self: An illustrative example in workers with type 1 diabetes
Raymond Hernandez, Rebecca Aldrich, Stefan Schneider, Arthur A. Stone, Shawn C. Roll, Elizabeth A. Pyatak
Journal of Occupational Science.2026; 33(2): 445. CrossRef - Reducing musculoskeletal disorders to enhance task performance among BPO workers: a partial least square structural equation modeling approach
Ma. Janice J. Gumasing
Theoretical Issues in Ergonomics Science.2026; 27(1): 1. CrossRef - The Hidden Cost of Long Working Hours: Occupational Anxiety and Argumentativeness in Emergency Nurses
Gürkan Özden, Ahmet Ceviz, Bahar Aslan, Muhammed Gönültaş
Journal of Emergency Nursing.2026; 52(3): 706. CrossRef - Musculoskeletal Symptoms and Associated Factors Among Iron Foundry Workers
Sibel Sert, Sevda Sungur, Mediha Bal, Selma Metintaş, Muhammed Fatih Önsüz
Workplace Health & Safety.2026; 74(5): 254. CrossRef - Occupational health risks and livelihood challenges among professional drivers in Bangladesh
J.M. Adeeb Salman Chowdhury, Rakibul Islam, Md. Safayet Hossain, Sabiha Ahmed Nila, Azima Mostofa Fiha, Meshkat Ebnay Mozahid, Md. Monirul Islam
Global Health Journal.2026; 10(1): 53. CrossRef - How equal is Norway? An analysis of migrant workers’ occupational health and safety in Norway
Nabaraj Adhikari, Shahad Uddin
International Social Work.2026; 69(3): 373. CrossRef - Vulnerability assessment of informal waste workers in India and its implications towards sustainable waste management policy
Jatin Kumar Drall, Mayengbam Ramesh Chandra, Vidisha Upadhyay, Bholu Ram Yadav, Sunil Kumar
Waste Management & Research: The Journal for a Sustainable Circular Economy.2026;[Epub] CrossRef - Association between working ≥10 hours per day and satisfaction with work environment among wage workers in Korea: a cross-sectional study using data from the 7th Korean Working Conditions Survey
Rae-Yun Kim, Dong-Woo Kim, Yoon-Soo Jang, Na-Rae Lee, June-Hee Lee, Kyung-Jae Lee
Annals of Occupational and Environmental Medicine.2026; 38: e9. CrossRef - On-site manual therapy for firefighters in Seoul: six-month utilization and outcome from a retrospective service analysis and web-based survey
Sungmin Park, Bo-Hyoung Jang
Chiropractic & Manual Therapies.2026;[Epub] CrossRef - Investigation of prevalence and risk factors of musculoskeletal disorders among tea harvesting farmers: A systematic review
Bahram Kouhnavard, Mojtaba Khosravi Danesh, Mansour Shamsipour, Adel Mazloumi
WORK: A Journal of Prevention, Assessment & Rehabilitation.2025; 80(1): 10. CrossRef - The Impact of Sleep Deprivation on Desktop Workers: Exploring the Link between Sleep Quality, Physical Activity, and Sedentary Lifestyles—A Cross-sectional Study
Manjarika Raj, Feba Roy
Journal of Society of Indian Physiotherapists.2025; 9(1): 47. CrossRef - Proactive Approaches to Work-Related Musculoskeletal Injuries in an Aging Workforce
Nimisha Kalia, Edward J. Bernacki, Xuguang (Grant) Tao
Journal of Occupational & Environmental Medicine.2025; 67(2): e136. CrossRef - Commuting time and musculoskeletal pain in the relationship with working time: a cross-sectional study
Hoje Ryu, Seong-Sik Cho, Jung Il Kim, Sun-Haeng Choi, Nathan Kim
Ann Occup Environ Med.2025; 37: e4. CrossRef - Prevalence of work-related musculoskeletal complaints among surgeons in Saudi Arabia
Ahmed Saad Al Zomia, Tariq Ali Al Mufarrih, Asmaa Saad Habbash, Abdulrahman Saeed Alshahrani, Iffat Elbarazi, Abdulrahman Mohammed Almofareh, Mosab Abdulaziz Deajim, Rayan Mohammed Alshehri, Salaheddine Bendak, Abdulrhman Mohammed Alqarni, Faisal M Faye,
International Journal of Occupational Safety and Ergonomics.2025; 31(4): 1025. CrossRef - Prevalence of work-related musculoskeletal disorder and its associated factors among weavers in low- and middle-income countries: a systematic review and meta-analysis
Abebe Kassa Geto, Chala Daba, Belay Desye, Gete Berihun, Leykun Berhanu
BMJ Open.2025; 15(8): e093124. CrossRef - Prevalence of low back pain and its associated factors among weavers in low- and middle- income countries: a systematic review and meta-analysis
Abebe Kassa Geto, Leykun Berhanu, Gete Berihun, Chala Daba, Belay Desye
BMC Musculoskeletal Disorders.2025;[Epub] CrossRef - Tipping the scales: how paid work hours thresholds impact health and gender wage disparities
Sunjin Pak, Amit Kramer, Yun-Kyoung Kim
The International Journal of Human Resource Management.2025; 36(13): 2342. CrossRef - Unraveling the after-hours dilemma: Consequences of overworking among teleworkers—A scoping review protocol
Bao-Zhu Stephanie Long, Kishana Balakrishnar, Luke A. Fiorini, Aaron Howe, Ali Bani-Fatemi, Basem Gohar, Behdin Nowrouzi-Kia, Marcos de Moraes Sousa
PLOS One.2025; 20(8): e0330594. CrossRef - Effectiveness of a six-month workplace therapeutic micro-exercise program on musculoskeletal pain: Initial anamnestic risk screening via TACOS and outcome evaluation using the Nordic Questionnaire
Mojtaba Ebrahimi varkiani, Amirhossein Vaghari gargari, Siavash Torkashvand
Journal of Bodywork and Movement Therapies.2025; 45: 365. CrossRef - Prevalence and evaluation of pattern of work-related musculoskeletal disorders among aluminum workers
Muhammad Audu Dan Inu, Mahmud Ali Karaga, Ibrahim Ahmad Abubakar, Abubakar Baba Saleh
Adesh University Journal of Medical Sciences & Research.2025; 7: 110. CrossRef - Assessment of the musculoskeletal discomfort scale for upper limb among workers in inner Brazil
Lara Karine Dias Silva, Alline Thamyres Claudino da Silva, Camyla Ferreira Moreno, Eloyse Ricely Machado de Souza, Tamires Fernanda Barbosa Nunes, Larissa Ane Hora de Souza, Lizandra Garcia Lupi Vergara, Jonhatan Magno Norte da Silva, Karen Jacobs, Remko
Work.2024; 78(1): 83. CrossRef - Study of musculoskeletal disorders risk factors and discomfort in sculptors in the north of Mexico
Patricia Eugenia Sortillón-González, Aidé Aracely Maldonado-Macías, David Saénz-Zamarrón, Juan Luis Hernandez-Arellano, Enrique Javier De la Vega-Bustillos, Karen Jacobs, Remko Soer
Work.2024; 78(1): 55. CrossRef - ‘Wait…, let me tell you, if I worked for a boss, I would be on sick leave': A Qualitative Study of Self-Employed Workers in Physically Demanding Jobs in the Netherlands
Bart Cillekens, Judith M. Mollet, Rixt A. Smit, P. Paul F. M. Kuijer, Pieter Coenen
Journal of Occupational Rehabilitation.2024; 34(3): 644. CrossRef - Biomechanical risk factors and subacromial pain provocation in healthy manufacturing workers
Claudio Muñoz-Poblete, Jaqueline Inostroza, Juan Carranza-Leiva
International Journal of Occupational Safety and Ergonomics.2024; 30(4): 1031. CrossRef - Identification of effective factors in musculoskeletal disorders of tea harvesting workers: a qualitative study
Bahram Kouhnavard, Adel Mazlomi, - Mansour Shamsipour
Occupational Health Journal.2024; 20(2): 201. CrossRef - Work-related musculoskeletal symptoms among Saudi radiologists: a cross-sectional multi-centre study
Magbool Alelyani, Moawia Gameraddin, Abdullah Mohammed A. Khushayl, Aljoharah M. Altowaijri, Maryam Ibrahim Qashqari, Fahad Ali Ahmed Alzahrani, Awadia Gareeballah
BMC Musculoskeletal Disorders.2023;[Epub] CrossRef - Association between irregular working hours and work-related musculoskeletal pain: results from the 6th Korean Working Conditions Survey
Munyoung Yang, Jun-Pyo Myong, Jongin Lee, Min Young Park, Mo-Yeol Kang
Annals of Occupational and Environmental Medicine.2023;[Epub] CrossRef - Longer working hours and musculoskeletal pain: a meta-analysis
Sohrab Amiri
International Journal of Occupational Safety and Ergonomics.2023; 29(1): 1. CrossRef - Prevalence and risk factors of work-related musculoskeletal disorders among emerging manufacturing workers in Beijing, China
Xiaowen Ding, Ziyi Guan, Nan Liu, Mingli Bi, Fang Ji, Huining Wang, Xueyan Zhang, Baolong Liu, Dongsheng Niu, Tian Lan, Tingting Xie, Jue Li, Tenglong Yan
Frontiers in Medicine.2023;[Epub] CrossRef - The association between adverse ergonomic factors and work-related musculoskeletal symptoms among medical staff in China: a cross-sectional study
Fei Liu, Ning Jia, Chuansha Wu, Jingzhi Sun, Gang Li, Huadong Zhang, Dongxia Li, Rugang Wang, Jing Liu, Tianlai Li, Jixiang Liu, Ruijie Ling, Zhongxu Wang
Ergonomics.2023; 66(12): 2212. CrossRef - An Additional Effect of Electro-Acupuncture on Unspecified Chronic Low Back Pain Among University Employees in Al-kharj, Saudi Arabia: A Randomized Controlled Study
Gopal Nambi, Saud M. Alrawaili
Acupuncture & Electro-Therapeutics Research: International Journal of Integrated Medicine.2023; 48(3): 185. CrossRef - Does an increase in working hours affect mortality risk? The relationship between working hours and mortality among the older population
Murat A. Mercan, Hande Barlin, Nazire Begen
Work.2022; 71(3): 625. CrossRef - Associations Between Workplace Violence, Mental Health, and Physical Health among Korean Workers: The Fifth Korean Working Conditions Survey
Hae Ran Kim
Workplace Health & Safety.2022; 70(3): 161. CrossRef - The incidence of work-related musculoskeletal pain among administrators in a South African university
L.M. Moraba, T.J. Ellapen, Y. Paul
African Journal for Physical Activity and Health Sciences (AJPHES).2022; 28(3): 218. CrossRef - The prevalence of MSDs and the associated risk factors in nurses of China
Liang Tang, Guozhen Wang, Wei Zhang, Jie Zhou
International Journal of Industrial Ergonomics.2022; 87: 103239. CrossRef - Effects of multiple risk factors on upper limb musculoskeletal disorders among workers in inner Brazil
Iris Lima da Silva, Eloyse Ricely Machado de Souza, Lara Karine Dias Silva, Alline Thamyres Claudino da Silva, Jonhatan Magno Norte da Silva
Work.2022; 72(3): 885. CrossRef - A Study on the Factors Influencing Overall Fatigue and Musculoskeletal Pains in Automobile Manufacturing Production Workers
Jun Won Kim, Byung Yong Jeong, Myoung Hwan Park
Applied Sciences.2022; 12(7): 3528. CrossRef - Prevalence and Factors Associated with Musculoskeletal Disorders among Thai Burley Tobacco Farmers
Amarin Kongtawelert, Bryan Buchholz, Dusit Sujitrarath, Wisanti Laohaudomchok, Pornpimol Kongtip, Susan Woskie
International Journal of Environmental Research and Public Health.2022; 19(11): 6779. CrossRef - Effectiveness and response differences of a multidisciplinary workplace health promotion program for healthcare workers
Kai-Hung Cheng, Ning-Kuang Wu, Chao-Tung Chen, Chih-Yu Hsu, Yen-An Lin, John Jiin-Chyuan Luo, Li-Ang Lee, Hai-Hua Chuang
Frontiers in Medicine.2022;[Epub] CrossRef - Prevalence and associated factors of lower extremity musculoskeletal disorders among manufacturing workers: a cross-sectional study in China
Xu Jin, Yidan Dong, Fujiang Wang, Ping Jiang, Zhongbin Zhang, Lihua He, Mikael Forsman, Liyun Yang
BMJ Open.2022; 12(2): e054969. CrossRef - Factors Associated with Musculoskeletal Disorders among Regular and Special Education Teachers: A Narrative Review
Ahmad Asyraf Abdul Rahim, Mohammad Saffree Jeffree, Dayang Maryama Ag Daud, Nicholas Pang, Mohd Fazeli Sazali
International Journal of Environmental Research and Public Health.2022; 19(18): 11704. CrossRef - Investigating the relationship between working time characteristics on musculoskeletal symptoms: a cross sectional study
Jennifer L Garza, Jacqueline M Ferguson, Alicia G Dugan, Ragan E Decker, Rick A Laguerre, Adekemi O Suleiman, Jennifer M Cavallari
Archives of Environmental & Occupational Health.2022; 77(2): 141. CrossRef - Risk Factors of Musculoskeletal Disorders in Office Workers
Priska Aulianingrum, Hendra Hendra
The Indonesian Journal of Occupational Safety and Health.2022; 11(SI): 68. CrossRef - Long working hours and risk of 50 health conditions and mortality outcomes: a multicohort study in four European countries
Jenni Ervasti, Jaana Pentti, Solja T. Nyberg, Martin J. Shipley, Constanze Leineweber, Jeppe K. Sørensen, Lars Alfredsson, Jakob B. Bjorner, Marianne Borritz, Hermann Burr, Anders Knutsson, Ida E.H. Madsen, Linda L. Magnusson Hanson, Tuula Oksanen, Jan H.
The Lancet Regional Health - Europe.2021; 11: 100212. CrossRef - Factors Associated with Musculoskeletal Disorders Among Female Readymade Garment Workers in Bangladesh: A Comparative Study Between OSH Compliant and Non-Compliant Factories
Mohammad Hayatun Nabi, Pornpimol Kongtip, Susan Woskie, Noppanun Nankongnab, Dusit Sujirarat, Suttinun Chantanakul
Risk Management and Healthcare Policy.2021; Volume 14: 1119. CrossRef - Influence of risk factors associated with musculoskeletal disorders on an inner population of northeastern Brazil
Deividson Sá Fernandes de Souza, Jonhatan Magno Norte da Silva, João Vítor de Oliveira Santos, Maria Sonaira Braz Alcântara, Manoel Gerônio Lino Torres
International Journal of Industrial Ergonomics.2021; 86: 103198. CrossRef - The Relationship of Grip and Pinch Strength to Musculoskeletal Disorders in Female Carpet Weavers in Southeastern Iran, 2019
Naser Hashemi Nejad, Mostafa Mohammadian, Ali Akbar Haghdoost, Esmail Charkhloo
Indian Journal of Occupational and Environmental Medicine.2021; 25(3): 138. CrossRef - The relationship between chronotypes and musculoskeletal problems in male automobile manufacturing workers
Suwhan Kim, Won-Ju Park, Seunghyeon Cho, Dae-Young Lim, Yeongjae Yoo, Hyeonjun Kim, Wonyang Kang, Kyung Wook Kang, Jai-Dong Moon
Annals of Occupational and Environmental Medicine.2021;[Epub] CrossRef - The Association Between Long Working Hours and Infertility
Joonho Ahn, Sang Ha Lee, Min Young Park, Soo Hyun Oh, Wanhyung Lee
Safety and Health at Work.2021; 12(4): 517. CrossRef - Interaction between occupational physical burdens and low job control on musculoskeletal pain: Analysis of the 5th Korean Working Environment Survey
Jongin Lee, Hyoung-Ryoul Kim, Dong-Wook Lee, Mo-Yeol Kang
Journal of Occupational Health.2021;[Epub] CrossRef - PEMILIHAN ANALGESIK EKSTERNAL UNTUK MENGATASI NYERI OTOT PADA KULI ANGKUT PUSAT GROSIR SURABAYA
Nida Septioning Sukma, Devy Maulidya Cahyani, Yuniar Tri Saskia Revi, Evelyn Clarissa Febiany, Fatihatul Alifiyah, Berlian Sarasitha Hariawan, Iffah Khosyyatillah, Ni’matul Khoiriyyah, Savira Putri Ayuningtyas, Firda Rosyidah, Mufarrihah Mufarrihah
Jurnal Farmasi Komunitas.2020; 7(1): 23. CrossRef - Factors Related to Physical and Mental Health in Workers With Different Categories of Employment
Jungsun Park, Yangho Kim
Journal of Occupational & Environmental Medicine.2020; 62(7): 511. CrossRef - Prevalence and predictors of work-related musculoskeletal disorders among workers of a gold mine in south Kivu, Democratic Republic of Congo
Alfred Okello, Solomon Tsebeni Wafula, Deogratias K. Sekimpi, Richard K. Mugambe
BMC Musculoskeletal Disorders.2020;[Epub] CrossRef - Association of Exposure to a Combination of Ergonomic Risk Factors with Musculoskeletal Symptoms in Korean Workers
Jungsun Park, Yangho Kim
International Journal of Environmental Research and Public Health.2020; 17(24): 9456. CrossRef - Prevalence of work-related musculoskeletal symptoms and associated risk factors among domestic gas workers and staff of works department in Enugu, Nigeria: a cross-sectional study
Chinenye Doris Oluka, Esther Obidike, Antoninus Obinna Ezeukwu, Ogochukwu Kelechi Onyeso, Echezona Nelson Dominic Ekechukwu
BMC Musculoskeletal Disorders.2020;[Epub] CrossRef - Factors related to the risk of illness of nursing staff at work in a psychiatric institution
Kayo Henrique Jardel Feitosa Sousa, Regina Célia Gollner Zeitoune, Luciana Fernandes Portela, Gisele Massante Peixoto Tracera, Katerine Gonçalves Moraes, Rachel Ferreira Savary Figueiró
Revista Latino-Americana de Enfermagem.2020;[Epub] CrossRef - Leisure time management in the workplace: Providing a model
Farkhondeh Forouzan, Hadi Teimouri, Ali Safari
Human Systems Management.2020; 39(3): 399. CrossRef - The association between long working hours and marital status change: middle-aged and educated Korean in 2014–2015
Hyunil Kim, Byung-Seong Suh, Won-Cheol Lee, Han-Seur Jeong, Kyung-Hun Son, Min-Woo Nam, Hyeong-Cheol Kim
Annals of Occupational and Environmental Medicine.2019;[Epub] CrossRef - Prevalence, patterns, and coping strategies of musculoskeletal disorders among caterers in the selected local government areas of Lagos State in Nigeria, 2017
Ashiyat Akodu, Ibitayo Famose
Journal of Occupational Health and Epidemiology.2019; 8(1): 29. CrossRef - The Effects of Workplace Rest Breaks on Health Problems Related to Long Working Hours and Shift Work among Male Apartment Janitors in Korea
Sungjin Park, June-Hee Lee, Wanhyung Lee
Safety and Health at Work.2019; 10(4): 512. CrossRef
 Cite
Cite- Figure
-
- Related articles
-
- Commuting time and musculoskeletal pain in the relationship with working time: a cross-sectional study
- Association between multiple jobs and physical and psychological symptoms among the Korean working population
- Association between single-person household wage workers in South Korea and insomnia symptoms: the 6th Korean Working Conditions Survey (KWCS)
The association between long working hours and work-related musculoskeletal symptoms of Korean wage workers: data from the fourth Korean working conditions survey (a cross-sectional study)

Fig. 1 Relationship between age groups and occupations of subjects. Blue bar indicates the age group of 20–29 years. Green bar indicates the age group of 30–39 years. Grey bar indicates the age group of 40–49 years. Purple bar indicates the age group of 50–59 years. Yellow bar indicates the age group of 60 years and more
Fig. 1
The association between long working hours and work-related musculoskeletal symptoms of Korean wage workers: data from the fourth Korean working conditions survey (a cross-sectional study)
| Characteristics | Total(N,%) | Weekly working hours | p-value* | ||
|---|---|---|---|---|---|
| ≤40 | 41-52 | > 52 | |||
| Total | 24,783(100) | 13,269(53.5) | 6956(28.1) | 4558(18.4) | |
| Gender | |||||
| Female | 11,890(48.0) | 6934(58.3) | 3182(26.8) | 1774(14.9) | < 0.001 |
| Male | 12,893(52.0) | 6335(49.1) | 3774(29.3) | 2784(21.6) | |
| Age (years) | |||||
| 20–29 | 3481(14.0) | 1841(52.9) | 990(28.4) | 650(18.7) | < 0.001 |
| 30–39 | 6469(26.1) | 3446(53.3) | 1977(30.6) | 1046(16.2) | |
| 40–49 | 7280(29.4) | 3959(54.4) | 2103(28.9) | 1218(16.7) | |
| 50–59 | 4995(20.2) | 2577(51.6) | 1386(27.7) | 1032(20.7) | |
| ≥ 60 | 2558(10.3) | 1446(56.5) | 500(19.5) | 612(23.9) | |
| Education | |||||
| Middle school graduate or below | 2659(10.7) | 1503(56.5) | 552(20.8) | 604(22.7) | < 0.001 |
| High school graduate | 9536(38.5) | 4354(45.7) | 2727(28.6) | 2455(25.7) | |
| College graduate or above | 12,588(50.8) | 7412(58.9) | 3677(29.2) | 1499(11.9) | |
| Monthly income (KRW) | |||||
| < 1,300,000 | 5478(22.1) | 3860(70.5) | 984(18.0) | 634(11.6) | < 0.001 |
| 1,300,000-1,999,000 | 6548(26.4) | 2747(42.0) | 2079(31.8) | 1722(26.3) | |
| 2,000,000-2,999,000 | 6964(28.1) | 3308(47.5) | 2282(32.8) | 1374(19.7) | |
| ≥ 3,000,000 | 5793(23.4) | 3354(57.9) | 1611(27.8) | 828(14.3) | |
| Occupation | |||||
| Managers or Professionals | 2594(10.5) | 1731(66.7) | 665(25.6) | 198(7.6) | < 0.001 |
| Office workers | 6644(26.8) | 4385(66.0) | 1858(28.0) | 401(6.0) | |
| Technicians | 5438(21.9) | 2279(41.9) | 1890(34.8) | 1269(23.3) | |
| Service or Sales workers | 6525(26.3) | 2877(44.1) | 1808(27.7) | 1840(23.7) | |
| Manual workers | 3582(14.5) | 1997(55.8) | 735(20.5) | 850(23.7) | |
| Employment status | |||||
| Regular | 18,754(75.7) | 9606(51.2) | 5729(30.5) | 3419(18.2) | < 0.001 |
| Temporary or Day labor | 6029(24.3) | 3663(60.8) | 1227(20.4) | 1139(18.9) | |
| Shift work | |||||
| No | 22,250(89.8) | 12,206(54.9) | 6242(28.1) | 3802(17.1) | < 0.001 |
| Yes | 2533(10.2) | 1063(42.0) | 714(28.2) | 756(29.8) | |
| Number of employees | |||||
| < 50 | 18,082(73.0) | 9220(51.0) | 5149(28.5) | 3713(20.5) | < 0.001 |
| 50–299 | 4593(18.5) | 2734(59.5) | 1282(27.9) | 577(12.6) | |
| ≥ 300 | 2108(8.5) | 1315(62.4) | 525(24.9) | 268(12.7) | |
| Characteristics | Upper limb pain | p-value* | Lower limb pain | p-value* | ||
|---|---|---|---|---|---|---|
| No(%) | Yes(%) | No(%) | Yes(%) | |||
| Total | 9493(73.6) | 3400(26.4) | 10,782(83.6) | 2111(16.4) | ||
| Age (years) | ||||||
| 20–29 | 1356(84.6) | 246(15.4) | < 0.001 | 1461(91.2) | 141(8.8) | < 0.001 |
| 30–39 | 2813(77.8) | 804(22.2) | 3199(88.4) | 418(11.6) | ||
| 40–49 | 2623(73.2) | 960(26.8) | 3024(84.4) | 559(15.6) | ||
| 50–59 | 1734(66.5) | 872(33.5) | 2008(77.1) | 598(22.9) | ||
| ≥ 60 | 967(65.1) | 518(34.9) | 1090(73.4) | 395(26.6) | ||
| Education | ||||||
| Middle school graduate or below | 674(54.5) | 563(45.5) | < 0.001 | 797(64.4) | 440(35.6) | < 0.001 |
| High school graduate | 3153(67.9) | 1489(32.1) | 3684(79.4) | 958(20.6) | ||
| College graduate or above | 5666(80.8) | 1348(19.2) | 6301(89.9) | 713(10.2) | ||
| Monthly income (KRW) | ||||||
| < 1,300,000 | 1089(72.5) | 413(27.5) | < 0.001 | 1170(77.9) | 332(22.1) | < 0.001 |
| 1,300,000-1,999,000 | 1576(69.5) | 692(30.5) | 1790(78.9) | 478(21.1) | ||
| 2,000,000-2,999,000 | 3183(71.6) | 1261(28.4) | 3707(83.4) | 737(16.6) | ||
| ≥ 3,000,000 | 3645(77.9) | 1034(22.1) | 4115(87.9) | 564(12.1) | ||
| Occupation | ||||||
| Managers or Professionals | 1031(83.1) | 209(16.9) | < 0.001 | 1142(92.1) | 98(7.9) | < 0.001 |
| Office workers | 2981(84.7) | 537(15.3) | 3302(93.9) | 216(6.1) | ||
| Technicians | 2731(64.8) | 1486(35.2) | 3255(77.2) | 962(22.8) | ||
| Service or Sales workers | 1627(80.8) | 386(19.2) | 1752(87.0) | 261(13.0) | ||
| Manual workers | 1123(59.0) | 782(41.0) | 1331(69.9) | 574(30.1) | ||
| Employment status | ||||||
| Regular | 7874(75.7) | 2521(24.3) | < 0.001 | 8954(86.1) | 1441(13.9) | < 0.001 |
| Temporary or Day labor | 1619(64.8) | 879(35.2) | 1828(73.2) | 670(26.8) | ||
| Shift work | ||||||
| No | 8340(74.3) | 2890(25.7) | < 0.001 | 9475(84.4) | 1755(15.6) | < 0.001 |
| Yes | 1153(69.3) | 510(30.7) | 1307(78.6) | 356(21.4) | ||
| Number of employees | ||||||
| < 50 | 6134(72.1) | 2375(27.9) | < 0.001 | 6976(82.0) | 1533(18.0) | < 0.001 |
| 50–299 | 2082(75.3) | 684(24.7) | 2373(85.8) | 393(14.2) | ||
| ≥ 300 | 1277(78.9) | 341(21.1) | 1433(88.6) | 185(11.4) | ||
| Working motion or posture | ||||||
| Lifting or carrying people | ||||||
| No | 5605(73.8) | 1990(26.2) | 0.054 | 6364(83.8) | 1231(16.2) | 0.192 |
| Yes | 3888(73.4) | 1410(26.6) | 4418(83.4) | 880(16.6) | ||
| Carrying heavy loads | ||||||
| No | 3215(84.0) | 614(16.0) | < 0.001 | 3503(91.5) | 326(8.5) | < 0.001 |
| Yes | 6278(69.3) | 2786(30.7) | 7279(80.3) | 1785(19.7) | ||
| Standing continuously | ||||||
| No | 1935(84.1) | 365(15.9) | < 0.001 | 2093(91.0) | 207(9.0) | < 0.001 |
| Yes | 7558(71.3) | 3035(28.7) | 8689(82.0) | 1904(18.0) | ||
| Repetitive movement | ||||||
| No | 1789(88.4) | 235(11.6) | < 0.001 | 1884(93.1) | 140(6.9) | < 0.001 |
| Yes | 7704(70.9) | 3165(29.1) | 8898(81.9) | 1971(18.1) | ||
| Computer work | ||||||
| No | 2381(61.6) | 1484(38.4) | < 0.001 | 2817(72.9) | 1048(27.1) | < 0.001 |
| Yes | 7112(78.8) | 1916(21.2) | 7965(88.2) | 1063(11.8) | ||
| Job stress | ||||||
| Low | 2307(76.4) | 713(23.6) | < 0.001 | 2550(84.4) | 470(15.6) | < 0.001 |
| High | 7115(72.8) | 2657(27.2) | 8150(83.4) | 1622(16.6) | ||
| No response | 71(70.3) | 30(29.7) | 82(81.2) | 19(18.8) | ||
| Social support | ||||||
| High | 8286(74.2) | 2877(25.8) | < 0.001 | 9435(84.5) | 1728(15.5) | < 0.001 |
| Low | 835(67.9) | 395(32.1) | 947(77.0) | 283(23.0) | ||
| No response | 372(74.4) | 128(25.6) | 400(80.0) | 100(20.0) | ||
| Characteristics | Upper limb pain | p-value* | Lower limb pain | p-value* | ||
|---|---|---|---|---|---|---|
| No(%) | Yes(%) | No(%) | Yes(%) | |||
| Total | 7972(67.0) | 3918(33.0) | 9111(76.6) | 2779(23.4) | ||
| Age (years) | ||||||
| 20–29 | 1501(79.9) | 378(20.1) | < 0.001 | 1638(87.2) | 241(12.8) | < 0.001 |
| 30–39 | 2151(75.4) | 701(24.6) | 2428(85.1) | 424(14.9) | ||
| 40–49 | 2484(67.2) | 1213(32.8) | 2856(77.3) | 841(22.7) | ||
| 50–59 | 1320(55.3) | 1069(44.7) | 1603(67.1) | 786(32.9) | ||
| ≥ 60 | 516(48.1) | 557(51.9) | 586(54.6) | 487(45.4) | ||
| Education | ||||||
| Middle school graduate or below | 636(44.7) | 786(55.3) | < 0.001 | 750(52.7) | 672(47.3) | < 0.001 |
| High school graduate | 3073(62.8) | 1821(37.2) | 3588(73.3) | 1306(26.7) | ||
| College graduate or above | 4263(76.5) | 1311(23.5) | 4773(85.6) | 801(14.4) | ||
| Monthly income (KRW) | ||||||
| < 1,300,000 | 2422(60.9) | 1554(39.1) | < 0.001 | 2789(70.1) | 1187(29.9) | < 0.001 |
| 1,300,000-1,999,000 | 2859(66.8) | 1421(33.2) | 3249(75.9) | 1031(24.1) | ||
| 2,000,000-2,999,000 | 1856(73.7) | 664(26.3) | 2130(84.5) | 390(15.5) | ||
| ≥ 3,000,000 | 835(75.0) | 279(25.0) | 943(84.6) | 171(15.4) | ||
| Occupation | ||||||
| Managers or Professionals | 1016(75.0) | 338(25.0) | < 0.001 | 1123(82.9) | 231(17.1) | < 0.001 |
| Office workers | 2471(79.0) | 655(21.0) | 2860(91.5) | 266(8.5) | ||
| Technicians | 776(63.6) | 445(36.4) | 944(77.3) | 277(22.7) | ||
| Service or Sales workers | 2908(64.5) | 1604(35.5) | 3194(70.8) | 1318(29.2) | ||
| Manual workers | 801(47.8) | 876(52.2) | 990(59.0) | 687(41.0) | ||
| Employment status | ||||||
| Regular | 5743(68.7) | 2616(31.3) | < 0.001 | 6624(79.2) | 1735(20.8) | < 0.001 |
| Temporary or Day labor | 2229(63.1) | 1302(36.9) | 2487(70.4) | 1044(29.6) | ||
| Shift work | ||||||
| No | 7444(67.5) | 3576(32.5) | < 0.001 | 8512(77.2) | 2508(22.8) | < 0.001 |
| Yes | 528(60.7) | 342(39.3) | 599(68.9) | 271(31.1) | ||
| Number of employees | ||||||
| < 50 | 6330(66.1) | 3243(33.9) | < 0.001 | 7259(75.8) | 2314(24.2) | < 0.001 |
| 50–299 | 1281(70.1) | 546(29.9) | 1452(79.5) | 375(20.5) | ||
| ≥ 300 | 361(73.7) | 129(26.3) | 400(81.6) | 90(18.4) | ||
| Working motion or posture | ||||||
| Lifting or carrying people | ||||||
| No | 4540(67.7) | 2164(32.3) | 0.054 | 5451(76.9) | 1550(23.1) | 0.192 |
| Yes | 3432(66.2) | 1754(33.8) | 3957(76.3) | 1229(23.7) | ||
| Carrying heavy loads | ||||||
| No | 3076(76.8) | 929(23.2) | < 0.001 | 3440(85.9) | 565(14.1) | < 0.001 |
| Yes | 4896(32.1) | 2989(37.9) | 819(79.1) | 2155(20.9) | ||
| Standing continuously | ||||||
| No | 1575(77.1) | 468(22.9) | < 0.001 | 1809(88.5) | 234(11.5) | < 0.001 |
| Yes | 6397(65.0) | 3450(35.0) | 7302(74.2) | 2545(25.8) | ||
| Repetitive movement | ||||||
| No | 1370(82.1) | 299(17.9) | < 0.001 | 1467(87.9) | 202(12.1) | < 0.001 |
| Yes | 6602(64.6) | 3619(35.4) | 7644(74.8) | 2577(25.2) | ||
| Computer work | ||||||
| No | 1962(53.5) | 1706(46.5) | < 0.001 | 2333(63.6) | 1335(36.4) | < 0.001 |
| Yes | 6010(73.1) | 2212(26.9) | 6778(84.4) | 1444(17.6) | ||
| Job stress | ||||||
| Low | 2130(69.7) | 926(30.3) | 0.001 | 2393(78.3) | 663(21.7) | 0.039 |
| High | 5773(66.2) | 2950(33.8) | 6634(76.1) | 2089(23.9) | ||
| No response | 69(62.2) | 42(37.8) | 84(75.7) | 27(24.3) | ||
| Social support | ||||||
| High | 6650(67.6) | 3191(32.4) | 0.028 | 7643(77.7) | 2198(22.3) | < 0.001 |
| Low | 842(64.5) | 463(35.5) | 931(71.3) | 374(28.7) | ||
| No response | 480(64.5) | 264(35.5) | 537(72.2) | 207(27.8) | ||
| Weekly working hour | Upper limb pain | Lower limb pain | |||||||
|---|---|---|---|---|---|---|---|---|---|
| Male | Female | Male | Female | ||||||
| OR | 95% CI | OR | 95% CI | OR | 95% CI | OR | 95% CI | ||
| Crude | ≤40 | 1 | Reference | 1 | Reference | 1 | Reference | 1 | Reference |
| 41–52 | 1.50 | 1.37–1.65 | 1.22 | 1.16–1.33 | 1.39 | 1.24–1.55 | 1.17 | 1.06–1.29 | |
| > 52 | 1.90 | 1.73–2.10 | 1.96 | 1.76–2.18 | 2.09 | 1.87–2.34 | 1.98 | 1.77–2.22 | |
| Model I* | ≤40 | 1 | Reference | 1 | Reference | 1 | Reference | 1 | Reference |
| 41–52 | 1.37 | 1.24–1.51 | 1.28 | 1.16–1.41 | 1.27 | 1.13–1.43 | 1.23 | 1.10–1.38 | |
| > 52 | 1.47 | 1.32–1.64 | 1.77 | 1.57–2.00 | 1.52 | 1.34–1.73 | 1.56 | 1.40–1.72 | |
| Model II** | ≤40 | 1 | Reference | 1 | Reference | 1 | Reference | 1 | Reference |
| 41–52 | 1.36 | 1.23–1.50 | 1.26 | 1.14–1.39 | 1.26 | 1.11–1.42 | 1.20 | 1.07–1.35 | |
| > 52 | 1.40 | 1.25–1.57 | 1.66 | 1.46–1.89 | 1.47 | 1.29–1.68 | 1.47 | 1.28–1.69 | |
Table 1 General and occupational characteristics of subjects associated with the weekly working hours
*calculated by chi-square test
Table 2 General and occupational characteristics of male subjects associated with the work-related musculoskeletal symptoms
*calculated by chi-square test
Table 3 General and occupational characteristics of female subjects associated with the work-related musculoskeletal symptoms
*calculated by chi-square test
Table 4 Odds ratios and 95% confidence intervals of work-related musculoskeletal symptoms with gender stratification
*Adjusted for gender, age, education, occupation, monthly income, employment status, shift work and number of employees
**Adjusted for gender, age, education, occupation, monthly income, employment status, shift work, number of employees, working motion or posture, job stress, and social support

