
Articles
- Page Path
- HOME > Ann Occup Environ Med > Volume 36; 2024 > Article
- Original Article Association between single-person household wage workers in South Korea and insomnia symptoms: the 6th Korean Working Conditions Survey (KWCS)
-
Yoon Ho Lee
 , Yong-Jin Lee, Eun-Chul Jang, Young-Sun Min, Soon-Chan Kwon,*
 -
Annals of Occupational and Environmental Medicine 2024;36:e25.
DOI: https://doi.org/10.35371/aoem.2024.36.e25
Published online: September 6, 2024
Department of Occupational and Environmental Medicine, Soonchunhyang University Cheonan Hospital, Cheonan, Korea
- *Correspondence: Soon-Chan Kwon Department of Occupational and Environmental Medicine, Soonchunhyang University Cheonan Hospital, 31 Suncheonhyang 6-gil, Dongnam-gu, Cheonan 31151, Korea E-mail: 91ksc@hanmail.net
• Received: March 28, 2024 • Revised: August 7, 2024 • Accepted: August 7, 2024
© 2024 Korean Society of Occupational & Environmental Medicine
This is an Open Access article distributed under the terms of the Creative Commons Attribution Non-Commercial License (https://creativecommons.org/licenses/by-nc/4.0/) which permits unrestricted non-commercial use, distribution, and reproduction in any medium, provided the original work is properly cited.
- 7,641 Views
- 300 Download
- 2 Crossref
Abstract
-
Background The rise in single-person households is a global phenomenon with well-documented implications for both physical and mental well-being. However, there remains a scarcity of studies focusing specifically on the health impacts of single-person households on workers. This study aims to address this gap by comparing insomnia symptoms between single- and multi-person household workers, shedding light on the health implications of household composition.
-
Methods This study utilized data from the Sixth Korean Working Conditions Survey. Insomnia symptoms were categorized into normal sleep and insomnia symptom groups utilizing the 3-item Minimal Insomnia Symptom Scale. Multiple logistic regression analysis was employed to examine the association between single-person household wage workers and insomnia symptoms.
-
Results In comparison to wage workers from multi-person households, those from single-person households exhibited heightened risks of reporting insomnia symptoms. In the fully adjusted model, the odds ratios for symptoms of insomnia among single-person household wage workers was 1.173 (95% confidence interval: 1.020–1.349).
-
Conclusions This study underscores that single-person household wage workers in Korea face an elevated risk of insomnia symptoms compared to their counterparts in multi-person households.
BACKGROUND
The global rise in single-person households has been notable.1 In Europe, the average household size has declined over the past decade, while the number of households has risen.2 As of 2016, single-person households comprised of an average of 30.6% of all households among 32 Organisation for Economic Co-operation and Development (OECD) countries.3 This trend is mirrored in South Korea, where the proportion of single-person households has steadily increased from 23.9% in 2010 to 34.5% in 2022.4 According to projections by the Korean Statistical Office, this figure is expected to rise to 35.6% by 2030 and 39.6% by 2050, becoming the predominant household type in all regions by 2050.5 These shifts in household composition are recognized to significantly influence individual health behaviors, resulting in variations in physical and mental health levels.6 Studies on the adult population in South Korea indicated that single-person households exhibit higher rates of chronic diseases, outpatient clinic visits, and hospitalizations, and individuals in single-person households tend to report insufficient sleep, higher rates of depressive symptoms, and an increased prevalence of suicidal ideations.7,8
Among various health-related issues in single-person households, sleep problems are considered crucial to workers’ daily lives and work performance. According to the National Interest Disease Statistics from the National Health Insurance Service of Korea, the population seeking medical attention for insomnia symptoms in 2022 amounted to approximately 720,000, exhibiting an increasing trend.9 Studies on insufficient sleep duration have revealed that sleeping for less than 6 hours is associated with self-reported sleep disorders or insomnia, overexertion, and exhaustion.10 Sleep disorders are known to have several negative health effects, including impaired attention and concentration, increased risk of depression, metabolic diseases, and cardiovascular diseases.11 Furthermore, individuals with inadequate sleep report more physical and mental damage related to work compared to those who sleep well.12 In a community-based study, demographic factors such as age and sex, as medical history, were identified as risk factors for insomnia. Low social support and living alone have been reported as additional risk factors for insomnia in the community.13
While research revealed a negative association between single-person households and health issues, focusing primarily on isolation, depression, and suicidal ideation, studies specifically addressing the impact of household type on workers are lacking.8,14-17 Therefore, this study aimed to examine the prevalence of insomnia symptoms and poor self-rated health among wage workers in single-person households and compare them with multi-person household workers to understand the impact of household type on health.
METHODS
This study conducted a cross-sectional analysis utilizing primary data from the 6th Korean Working Conditions Survey (KWCS). The KWCS, conducted by the Korea Occupational Safety and Health Agency, has been conducted at three-year intervals since 2006 to collect fundamental data for occupational injury prevention policy. The 6th KWCS was conducted from October 2020 to April 2021 and employed various data collection methods, including 1:1 face-to-face interviews through household visits by trained interviewers, self-administered surveys, and web-based surveys. A total of 50,538 employed individuals aged 15 or older from 17 provinces nationwide participated in the 6th KWCS. For the purpose of this analysis focusing on wage workers aged 20 years and older, 17,622 unpaid family workers and self-employed individuals under 20 years of age were excluded. In addition, 4,007 participants with missing values for key variables were excluded, resulting in a final sample of 28,909 individuals (Fig. 1).
Single-person household and multi-person household
Individuals who responded “1 person” to the question “How many people, including yourself, live together in your household?” were defined as belonging to a single-person household, whereas those with two or more individuals were classified as belonging to a multi-person household.18
Insomnia symptoms
Insomnia symptoms were evaluated utilizing the Minimal Insomnia Symptom Scale (MISS). The MISS consists of three items asking how often the participant had experienced difficulty falling asleep, waking up repeatedly during sleep, and feeling tired and exhausted after waking up in the past 12 months. The symptoms of insomnia were evaluated by asking participants to choose one of the following options for each item: “every day,” “several times a week,” “several times a month,” “rarely,” “never,” “don’t know,” or “refuse to answer.” Responses of “don’t know” and “refuse to answer” were treated as missing data and excluded from the statistical analysis. Scores ranging from 0 to 4 were assigned to each response (0 = “none at all,” 1 = “rarely,” 2 = “several times a month,” 3 = “several times a week,” 4 = “every day”). The total MISS score, calculated by summing the scores of each subscale, ranges from 0 to 12, with a score of 6 or higher indicating insomnia.19 In this study, subjects with scores of 6 or higher were categorized into a group exhibiting symptoms of insomnia, while those with scores below 6 were classified into the normal sleep group.
Covariates
Since insomnia is associated with various factors, this study attempted to control for these variables. Sociodemographic variables included sex, age, educational level, and monthly household income.20-22 Age was categorized as 20–29, 30–39, 40–49, 50–59, and 60 or older. Education level was dichotomized into high school graduation or below, and college graduation or above. Monthly household income was stratified into four groups: less than 2 million won, 2-3 million won, 3–4 million won, and >4 million won.
Occupational characteristics included job classification, type of employment, number of employees, weekly working hours, shiftwork status,20 job stress,23 and presenteeism.24 Employment type was classified as regular, temporary, or day laborer. Job classification was categorized into white-, pink-, green-, and blue-collar. The number of employees was divided into less than 50 employees, 50–299 employees, and 300 or more employees. Weekly working hours were grouped as 40 hours or less, 41–52 hours, and 53 hours or more. Shift work was dichotomized as “yes” or “no.” Job stress was assessed using the question, “Do you feel stressed at work?” Participants who responded with “always,” “mostly,” or “sometimes” were classified into the high job stress group, while those who responded with “rarely” or “never” were classified into the low work stress group.17 Responses of “not applicable,” “don’t know/no response,” and “refuse to answer” were treated as missing data and excluded. Presenteeism was classified based on the question, “In the past year, have you ever worked while being ill?” with responses of “yes” or “no.” Responses of “not applicable,” “don’t know/no response,” and “refuse to answer” were treated as missing data and excluded.
Health-related variables included self-rated health status.25-27 Self-rated health is a widely utilized health indicator in various cohort studies owing to its association with lifestyle factors like smoking, alcohol consumption, and physical activity, as well as mortality rates.28,29 According to the results of a study investigating the association between self-rated health and commonly utilized biomarkers, it has been reported that self-rated health can serve as a sensitive indicator of physiological status. Therefore, it can be utilized as a tool to assess the overall health status of the working population.30 Participants evaluated their health status by selecting one of the following options: “excellent,” “good,” “fair,” “poor,” or “very poor,” “don’t know/no response” or “refuse to answer.” To organize the survey responses based on previous research on self-rated health, respondents who selected “excellent,” “good,” or “fair” were classified as having good self-rated health, while those who selected “poor” or “very poor” were classified as having poor self-rated health.31-33 Responses of “don’t know/no response” and “refuse to answer” were treated as missing data and excluded from the statistical analysis.
Chi-squared tests were conducted to compare the proportions of sex, age, education level, monthly household income, job classification, type of employment, number of employees, weekly working hours, shift work status, job stress, and presenteeism between single- and multi-person household workers. Chi-square tests were utilized to compare the prevalence of self-rated health and sleep disturbance between the two groups. Chi-square test was conducted to analyze changes in the prevalence of insomnia symptoms by age group and household size.
Logistic regression analysis was employed to calculate odds ratios (OR) and 95% confidence intervals (CI) for self-rated health and insomnia symptoms among single-person household workers and multi-person household workers. The crude model involved simple logistic regression, and Model 1 was adjusted for sex, age, education level, household monthly income, weekly working time, and shift work. Model 2 was further adjusted for job classification, number of employees, type of employment, job stress, and presenteeism and Model 3 was additionally adjusted for self-rated health.
The 6th KWCS provides weighted variables for the dataset to represent the entire working population. Final data analysis was performed utilizing the provided weights, and IBM SPSS Statistics version 27.0 (IBM Corp., Armonk, NY, USA) was utilized for all statistical analyses. Statistical significance was considered when the p-value was less than 0.05.
This study was approved by the Institutional Review Board (IRB) review of Soonchunhyang University Cheonan Hospital (IRB No. 2023-12-048). Informed consent was submitted by all subjects when they were enrolled.
RESULTS
Table 1 displays the characteristics of workers from single-person and multi-person households. Among the study population, 9.4% belonged to single-person households, while 90.6% belonged to multi-person households. Compared to workers from multi-person household, those from single-person households had a higher percentage of individuals aged 60 years and older (25.5% vs. 12.9%, p < 0.001) and individuals in their 20s (23.8% vs. 15.7%, p < 0.001). Educational disparities were evident, with a lower proportion of individuals holding college degrees or higher among single-person household workers compared to their counterparts from multi-person households (47.0% vs. 60.4%, p < 0.001). Concerning monthly household income, a larger proportion of single-person household workers earned less than two million won (36.2% vs. 26.9%, p < 0.001), while a smaller proportion earned 400 million won or more (8.2% vs. 18.8%, p < 0.001). Differences were observed in weekly working hours, job classification, employment type, number of employees, shift work, job stress, and presenteeism. Single-person household workers had a significantly higher proportion working more than 53 hours per week compared to their counterparts (7.8% vs. 6.5%, p=0.015). The percentage of blue-collar workers was notably higher in single-person households at 46.5% (p < 0.001). Regarding the number of employees, businesses with less than 50 employees were more prevalent among single-person households (72.0%, p < 0.001). Additionally, the percentage of regular employment was lower among single-person households than that among multi-person household workers (67.6% vs. 81.6%, p < 0.001). Furthermore, the rate of shift work was significantly lower among single-person household workers (8.7%) compared to multi-person household workers (10.3%, p = 0.006). Among multi-person household workers, 77.9% were classified as having high job stress levels, compared with 72.6% among single-person household workers (p < 0.001). The proportion of those experiencing presenteeism was also significantly higher among workers in multi-person households at 11.3%, compared to 10.0% for workers in single-person households (p = 0.027).
Table 1 also presents the prevalence of self-rated health and insomnia symptoms among study participants according to the number of household members. Among multi-person household workers, 3.0% were classified as having poor self-rated health, compared with 4.29% among single-person household workers. The prevalence of insomnia symptoms among multi-person and single-person household workers was 7.8% and 9.4%, respectively. There were no statistically significant differences between workers from single- and multi-person households in terms of sex.
Table 2 presents the changes in prevalence of insomnia symptoms among participants according to age group. The prevalence of insomnia symptoms in the 20s group was 5.3%, 7.2% in the 30s, 7.7% in the 40s, 8.8% in the 50s, and 11.6% in the 60s and older, indicating that the proportion of workers with insomnia symptoms increases with age (p for trend <0.001).
Table 3 illustrates the prevalence of insomnia symptoms according to the increase in the number of household members. Insomnia symptoms in the single-person household group was 9.4%; in the two-person household group, 8.7%; in the three-person household group, 7.8%; and in the four-person or more group, 7.5% (p for trend <0.001). This shows that the proportion of workers experiencing insomnia symptoms gradually decreases as the number of household members increases.
Table 4 presents the results of logistic regression analysis investigating the association between single-person household workers and insomnia symptoms. Without adjusting for other factors, single-person household workers had a higher probability of experiencing insomnia symptoms than multi-person household workers, and this difference was statistically significant (OR: 1.219; 95% CI: 1.073–1.385). In Model 3, after adjusting for all variables, the relationship between single-person household workers and insomnia symptoms declined slightly but remained statistically significant (OR: 1.173; 95% CI: 1.020–1.349).
DISCUSSION
This study investigated the relationship between single-person household wage workers and insomnia symptoms. The findings exhibited a higher risk of insomnia symptoms among single-person household workers as opposed to among multi-person household workers. This illustrates that the rise in single-person households may not only be a societal phenomenon, but also has potential implications with regard to the health of workers.
The study found that individuals in their 20s and those aged 60 years and older had a higher frequency of single-person household workers as opposed to multi-person household workers. Additionally, characteristics such as a lower socioeconomic status were more prevalent among single-person household workers. These findings align with similar patterns reported in prior studies and national survey results.4,15,34 These factors are believed to contribute to an elevated risk of insomnia in single-person household workers. In general, the prevalence of insomnia symptoms increases with age,35,36 and the results of this study also showed that the rate of insomnia increases with age. However, another study reported that young people are also at high risk of insomnia. A study examining insomnia characteristics during the coronavirus disease 2019 (COVID-19) pandemic based on a 2022 sleep survey in Korea highlighted a higher risk of insomnia among the younger population. The authors attributed this to reduced daytime physical activity as a result of increased remote work, economic difficulties resulting from employment insecurity, and delayed bedtime habits associated with excessive utilization of the smartphone while in bed.37 Conversely, individuals aged 60 and above may be influenced by factors such as employment stress, occupational status reduction, stress related to learning new tasks, and increased risk of illness.12,38,39
Low socioeconomic status, along with factors such as long working hours, blue-collar occupations, small-scale workplaces, non-regular employment, and advanced age, have been reported as risk factors for sleep disturbances.21,38,40,41 The findings of this study are aligned with that of other studies. The poor health status of self-assessment in the single-person household wage group compared to the multi-person household wage group is also thought to have affected the higher risk of insomnia symptoms in the single-person household wage group. A 2008 study of middle-aged adults found that nonrestorative sleep and short sleep time were significantly associated with low self-rated health status.25 A study of older workers found that those who rated their health as poor were less likely to report good sleep efficiency.26
Moreover, the characteristics of single-person households mentioned earlier are likely linked to loneliness, which has been identified as a health risk factor in studies on its impact. On the other hand, it is possible that the characteristics of single-person households mentioned above are related to loneliness, which has been identified as a health risk factor in studies on its impact. Factors such as living alone, being under 25 or over 65, and having a low economic status were suggested as risk factors for loneliness.42,43 An analysis of the relationship between loneliness and social support in Turkish cancer patients in 2007 found that individuals lacking interpersonal relationships often experienced loneliness.44 Notably, a study on the social relationships of single-person households aged 20-30 revealed that they spent almost half as much time with others compared to other household types.45 Loneliness has been exhibited to have a negative relationship with self-rated health,43 and the increased prevalence of loneliness in those with poor self-rated health implies that loneliness may influence the health status of single-person household workers.46,47 In addition, studies that analyzed loneliness and sleep reported that loneliness was associated with higher insomnia symptoms.48 In a study comparing cohorts collected from the UK population in 2017–2019 and 2020, focusing on the risk factors for loneliness, it was observed that the risk of loneliness increased during the COVID-19 pandemic. This was attributed to the global reduction in face-to-face interactions and social activities, decreased job opportunities and employment, as well as restrictions on travel and outdoor activities, resulting in numerous individuals experiencing an increased risk of lacking emotional and social support.49 The UK and Japan have recognized loneliness as a significant public health issue and have appointed ministers to address the problem.16 Social connections and cohabitation with family provide an impact on both physical and psychological well-being by promoting healthy lifestyles and stability. This finding supports the consideration of living alone as a factor in health management.50
This study however, encountered several limitations. Firstly, as a result of its cross-sectional design, causality could not be established. Secondly, the lack of information on lifestyle factors such as alcohol consumption and smoking habits prevented adjustment for their potential impact on sleep and health status. Thirdly, the study lacks information on the reasons for becoming a single-person household, resulting in an insufficient investigation regarding the health impacts based on the diverse characteristics of single-person households. Therefore, future research should explore the health effects of workers based on their reasons for forming single-person households. Nevertheless, this study is significant as it investigated the sleep and health problems of workers according to household type, utilizing data representative of the domestic working population.
CONCLUSIONS
The findings of this study highlight that wage workers from single-person households in Korea face a heightened risk of experiencing insomnia symptoms and compared to their counterparts from multi-person households. It is crucial to recognize that these insomnia symptoms not only impact individual well-being, but also have significant implications for workplace productivity, ultimately contributing to rising societal costs. The escalating prevalence of single-person households extends beyond societal shifts; it demands attention as a determinant affecting the health outcomes of the workforce.
Abbreviations
CI
confidence interval
COVID-19
coronavirus disease 2019
KWCS
Korean Working Conditions Survey
MISS
Minimal Insomnia Symptom Scale
OECD
Organization for Economic Co-operation and Development
OR
odds ratio
-
Funding
This work was supported by the Soonchunhyang University Research Fund.
-
Competing interests
Young-Sun Min, contributing editor of the Annals of Occupational and Environmental Medicine, was not involved in the editorial evaluation or decision to publish this article. All remaining authors have declared no conflicts of interest.
-
Author contributions
Conceptualization: Lee YH, Kwon SC. Data curation: Lee YH, Lee YJ, Jang EC, Kwon SC, Min YS. Formal analysis: Lee YH, Jang EC, Lee YJ, Kwon SC, Min YS. Investigation: Lee YH, Jang EC, Lee YJ, Kwon SC, Min YS. Writing - original draft: Lee YH. Writing - review & editing: Kwon SC.
-
Acknowledgments
We appreciate the Occupational Safety and Health Research Institute (OSHRI) for offering the data from the 6th Korean working conditions survey. The paper's contents are solely the responsibility of the author and do not necessarily represent the official views of the OSHRI.
NOTES

Table 1.
Characteristics of study subjects according to the number of household members
| Total (n = 33,113) |
No. of household members |
p-value | ||
|---|---|---|---|---|
| ≥2 (n = 29,992) | 1 (n = 29,992) | |||
| Sex | ||||
| Men | 18,818 (56.8) | 17,045 (56.8) | 1,773 (56.8) | 0.980 |
| Women | 14,295 (43.2) | 12,947 (43.2) | 1,348 (43.2) | |
| Age (years) | ||||
| 20–29 | 5,464 (16.5) | 4,722 (15.7) | 742 (23.8) | <0.001 |
| 30–39 | 7,519 (22.7) | 6,836 (22.8) | 683 (21.9) | |
| 40–49 | 8,192 (24.7) | 7,793 (26.0) | 399 (12.8) | |
| 50–59 | 7,265 (21.9) | 6,764 (22.6) | 501 (16.1) | |
| ≥60 | 4,673 (14.1) | 3,877 (12.9) | 796 (25.5) | |
| Education level | ||||
| High school or below | 13,536 (40.9) | 11,883 (39.6) | 1,653 (53.0) | <0.001 |
| University or above | 19,577 (59.1) | 18,109 (60.4) | 1,468 (47.0) | |
| Household monthly income (KRW) | ||||
| <2,000,000 | 9,193 (27.8) | 8,062 (26.9) | 1,131 (36.2) | <0.001 |
| 2,000,000–3,000,000 | 10,775 (32.5) | 9,619 (32.1) | 1,156 (37.0) | |
| 3,000,000–4,000,000 | 7,246 (21.9) | 6,667 (22.2) | 579 (18.5) | |
| ≥4,000,000 | 5,900 (17.8) | 5,644 (18.8) | 256 (8.2) | |
| Weekly working time (hours) | ||||
| ≤40 | 23,719 (71.6) | 21,504 (71.7) | 2,215 (70.9) | 0.015 |
| 41–52 | 7,208 (21.8) | 6,545 (21.8) | 663 (21.2) | |
| ≥53 | 2,186 (6.6) | 1,942 (6.5) | 244 (7.8) | |
| Job classification | ||||
| White | 8,337 (25.2) | 7,683 (25.6) | 654 (20.9) | <0.001 |
| Pink | 13,013 (39.3) | 12,011 (40.0) | 1,002 (32.1) | |
| Green | 76 (0.2) | 63 (0.2) | 13 (0.4) | |
| Blue | 11,688 (35.3) | 10,235 (34.1) | 1,453 (46.5) | |
| No. of employees | ||||
| <50 | 21,093 (63.7) | 18,847 (62.8) | 2,246 (72.0) | <0.001 |
| 50–299 | 6,262 (18.9) | 5,773 (19.2) | 489 (15.7) | |
| ≥300 | 5,758 (17.4) | 5,372 (17.9) | 386 (12.4) | |
| Type of employment | ||||
| Regular | 26,581 (80.3) | 24,472 (81.6) | 2,109 (67.6) | <0.001 |
| Temporary | 4,732 (14.3) | 4,027 (13.4) | 705 (22.6) | |
| Day laborers | 1,800 (5.4) | 1,493 (5.0) | 307 (9.8) | |
| Shift work | ||||
| No | 29,762 (89.9) | 26,913 (89.7) | 2,849 (91.3) | 0.006 |
| Yes | 3,351 (10.1) | 3,079 (10.3) | 272 (8.7) | |
| Job stress | ||||
| Low | 7,497 (22.6) | 6,641 (22.1) | 856 (27.4) | <0.001 |
| High | 25,617 (77.4) | 23,351 (77.9) | 2,266 (72.6) | |
| Presenteeism | ||||
| No | 29,400 (88.8) | 26,591 (88.7) | 2,809 (90.0) | 0.027 |
| Yes | 3,714 (11.2) | 3,401 (11.3) | 313 (10.0) | |
| Self-rated health statusa | ||||
| Good | 27,418 (96.9) | 24,987 (97.0) | 2,431 (95.7) | <0.001 |
| Poor | 882 (3.1) | 773 (3.0) | 109 (4.3) | |
| Insomnia symptomsb | ||||
| No | 30,468 (92.0) | 27,640 (92.2) | 2,828 (90.6) | 0.002 |
| Yes | 2,645 (8.0) | 2352 (7.8) | 293 (9.4) | |
Values are presented as number (%).
aExcellent, good, fair were classified as having good self-rated health and poor, very poor were classified as having poor self-rated health;
bSubjects with Minimal Insomnia Symptom Scale (MISS) scores of 6 or higher were categorized into a group having symptoms of insomnia.
Table 2.
Changes in prevalence of insomnia symptoms by age groups
| Age (years) | Total (n = 33,113) |
Insomnia symptomsa |
p-value | p for trend | |
|---|---|---|---|---|---|
| No (n = 30,468) | Yes (n = 2,645) | ||||
| 20–29 | 5,463 (100) | 5,174 (94.7) | 289 (5.3) | <0.001 | <0.001 |
| 30–39 | 7,519 (100) | 6,975 (92.8) | 544 (7.2) | ||
| 40–49 | 8,192 (100) | 7,563 (92.3) | 629 (7.7) | ||
| 50–59 | 7,265 (100) | 6,626 (91.2) | 639 (8.8) | ||
| ≥60 | 4,674 (100) | 4,130 (88.4) | 544 (11.6) | ||
Table 3.
Changes in prevalence of insomnia symptoms with increasing household size
| No. of household members | Total (n = 33,113) |
Insomnia symptomsa |
p-value | p for trend | |
|---|---|---|---|---|---|
| No (n = 30,468) | Yes (n = 2,645) | ||||
| 1 | 3,121 (100) | 2,828 (90.6) | 293 (9.4) | <0.001 | <0.001 |
| 2 | 6,739 (100) | 6,156 (91.3) | 583 (8.7) | ||
| 3 | 9,068 (100) | 8,362 (92.2) | 706 (7.8) | ||
| ≥4 | 14,186 (100) | 13,123 (92.5) | 1,063 (7.5) | ||
Table 4.
ORs and 95% CIs for insomnia symptoms whether single-person household or not
| Insomnia symptomsa |
OR (95% CI) |
|||
|---|---|---|---|---|
| Crude | Model 1 | Model 2 | Model 3 | |
| No | Ref. | Ref. | Ref. | Ref. |
| Yes | 1.219 (1.073–1.385)** | 1.194 (1.048–1.361)** | 1.209 (1.056–1.385)** | 1.173 (1.020–1.349)* |
Crude: unadjusted; Model 1: adjusted for adjusted for sex, age, education level, household monthly income, weekly working time, shift work; Model 2: adjusted for adjusted for sex, age, education level, household monthly income, weekly working time, shift work, job classification, number of employees, type of employment, job stress, presenteeism; Model 3: adjusted for adjusted for sex, age, education level, household monthly income, weekly working time, shift work, job classification, number of employees, type of employment, job stress, presenteeism, self-rated health.
OR: odds ratio; CI: confidence interval.
*p < 0.05,
**p < 0.01.
aSubjects with Minimal Insomnia Symptom Scale (MISS) scores of 6 or higher were categorized into a group having symptoms of insomnia.
- 1. Lee HY, Noh SC, Choi EY. Growth pattern and spatial distribution of one-person households by socio-economic demographic characteristics. J Korean Geogr Soc 2011;46(4):480–500.
- 2. Eurofound. Household Composition and Well-being. Luxembourg: Publications Office of the European Union; 2019.
- 3. Organisation for Economic Co-operation and Development (OECD). OECD Family Database. Paris, France: OECD Publishing; 2013.
- 4. Statistics Korea. 2022 Population and Housing Census. Daejeon, Korea: Statistics Korea; 2022.
- 5. Statistics Korea. Household Projections 2020. Daejeon, Korea: Statistics Korea; 2020.
- 6. Berkman LF. Social support, social networks, social cohesion and health. Soc Work Health Care 2000;31(2):3–14.ArticlePubMed
- 7. Kang E, Lee M. Single-person households in south Korea and their policy implication. Health Welf Policy Forum 2016;4(234):47–56.
- 8. Shin MA. Comparative study on health behavior and mental health between one person and multi-person households: analysis of data from the National Health and Nutrition Examination Surveys (2013, 2015, 2017). J Korean Soc Wellness 2019;14(4):11–23.Article
- 9. HIRA Healthcare Bigdata Hub. Disease statistics of national interest. https://opendata.hira.or.kr/op/opc/olapMfrnIntrsIlnsInfoTab1.do. Updated 2023. Accessed December 15, 2023.
- 10. Grandner MA, Patel NP, Gehrman PR, Perlis ML, Pack AI. Problems associated with short sleep: bridging the gap between laboratory and epidemiological studies. Sleep Med Rev 2010;14(4):239–47.ArticlePubMed
- 11. Wingard DL, Berkman LF. Mortality risk associated with sleeping patterns among adults. Sleep 1983;6(2):102–7.ArticlePubMed
- 12. Fietze I, Rosenblum L, Salanitro M, Ibatov AD, Eliseeva MV, Penzel T, et al. The interplay between poor sleep and work-related health. Front Public Health 2022;10:866750.ArticlePubMedPMC
- 13. Fidler AL, Chaudhari P, Sims V, Payne-Murphy J, Fischer J, Cottler LB. Insomnia among community members in Florida: associations with demographics, health conditions, and social support. J Clin Transl Sci 2023;7(1):e128.ArticlePubMedPMC
- 14. Lee MS, Song H, Kim B. Association between physical health status, health behaviors and subjective depression among single-person household. Korean J Health Educ Promot 2018;35(2):61–71.Article
- 15. Han SI, Huh Y, Sunwoo S. Comparison of health related quality of life of one- and multi-person households using EQ-5D based on the 7th Korea National Health and Nutrition Examination Survey. Korean J Fam Pract 2022;12(1):22–7.Article
- 16. Park M, Kim SA. Characteristics and types of loneliness, social isolation, and mental health problems in single-person households: focusing on single-person households in Seoul. Health Soc Welf Rev 2022;42(4):127–41.
- 17. Kim HY, Choi J, Lim HM, Park C, Hong YC. The association between non-regular work patterns and insomnia among Korean wage workers: the fifth Korean working condition survey. Ann Occup Environ Med 2021;33:e9.ArticlePubMedPMCPDF
- 18. Kim SW, Bae KH, Seo JB, Jeon JH, Lee WK, Lee IK, et al. Association between household size, residential area, and osteoporosis: analysis of 2008 to 2011 Korea National Health and Nutrition Examination Survey. Korean J Intern Med 2016;31(4):712–21.ArticlePubMedPMCPDF
- 19. Broman JE, Smedje H, Mallon L, Hetta J. The Minimal Insomnia Symptom Scale (MISS): a brief measure of sleeping difficulties. Ups J Med Sci 2008;113(2):131–42.PubMed
- 20. Grandner MA. Sleep and Health. Oxford, UK: Academic Press; 2019.
- 21. de Souza Lopes C, Robaina JR, Rotenberg L. Epidemiology of insomnia: prevalence and risk factors. In: Sahoo S, editor. Can't Sleep? Issues of Being an Insomniac. London, UK: InTech; 2012.
- 22. Morin CM, Jarrin DC. Epidemiology of insomnia: prevalence, course, risk factors, and public health burden. Sleep Med Clin 2022;17(2):173–91.PubMed
- 23. Utsugi M, Saijo Y, Yoshioka E, Horikawa N, Sato T, Gong Y, et al. Relationships of occupational stress to insomnia and short sleep in Japanese workers. Sleep 2005;28(6):728–35.ArticlePubMed
- 24. Hwang J, Cho SS, Kim JI. Association between insomnia and absenteeism or presenteeism among Korean employees. Ann Occup Environ Med 2022;34:e41.ArticlePubMedPMCPDF
- 25. Coombe AH, Epps F, Lee J, Chen ML, Imes CC, Chasens ER. Sleep and self-rated health in an aging workforce. Workplace Health Saf 2019;67(6):302–10.ArticlePubMedPDF
- 26. Simoes Maria M, Bula C, Santos-Eggimann B, Krief H, Heinzer R, Seematter-Bagnoud L. Sleep characteristics and self-rated health in older persons. Eur Geriatr Med 2020;11(1):131–8.ArticlePubMedPDF
- 27. Stefan L, Juranko D, Prosoli R, Baric R, Sporis G. Self-reported sleep duration and self-rated health in young adults. J Clin Sleep Med 2017;13(7):899–904.ArticlePubMedPMCPDF
- 28. Segovia J, Bartlett RF, Edwards AC. The association between self-assessed health status and individual health practices. Can J Public Health 1989;80(1):32–7.PubMed
- 29. Jylha M. What is self-rated health and why does it predict mortality? Towards a unified conceptual model. Soc Sci Med 2009;69(3):307–16.ArticlePubMed
- 30. Jylha M, Volpato S, Guralnik JM. Self-rated health showed a graded association with frequently used biomarkers in a large population sample. J Clin Epidemiol 2006;59(5):465–71.ArticlePubMed
- 31. Pien LC, Chen IS, Cheng WJ, Cheng Y. Work-to-family conflict and its associations with workers' burnout, poor self-rated health, and minor mental disorder: a survey of general employees in Taiwan. J Occup Environ Med 2020;62(8):588–94.PubMed
- 32. Park MY, Park J, Myong JP, Kim HR, Lee DW, Kang MY. Poor worker's long working hours paradox: evidence from the Korea National Health and Nutrition Examination Survey, 2013-2018. Ann Occup Environ Med 2022;34:e2.ArticlePubMedPMCPDF
- 33. Han E, Kim UJ, Lee Y, Lee S, Ham S, Lee W, et al. Association between lone work and self-rated health status: using the 5th Korean Working Conditions Survey. Ann Occup Environ Med 2023;35:e29.ArticlePubMedPMCPDF
- 34. Cho YK, Shim KW, Suk HW, Lee HS, Lee SW, Byun AR, et al. Differences between one-person and multi-person households on socioeconomic status, health behavior, and metabolic syndrome across gender and age groups. Korean J Fam Pract 2019;9(4):373–82.Article
- 35. Ohayon MM. Epidemiology of insomnia: what we know and what we still need to learn. Sleep Med Rev 2002;6(2):97–111.ArticlePubMed
- 36. Unruh ML, Redline S, An MW, Buysse DJ, Nieto FJ, Yeh JL, et al. Subjective and objective sleep quality and aging in the sleep heart health study. J Am Geriatr Soc 2008;56(7):1218–27.ArticlePubMed
- 37. Jeon JY, Kim KT, Lee SY, Cho YW; Sleep Epidemiology Committee of the Korean Sleep Research Society. Insomnia during coronavirus disease 2019 pandemic in Korea: a National sleep survey. Sleep Biol Rhythms 2023;21(4):431–8.ArticlePubMedPMCPDF
- 38. Lee J, Hong Y, Lee W. Prevalence of insomnia in various industries and associated demographic factors in night-shift workers using workers' specific health examination data. Int J Environ Res Public Health 2021;18(13):6902.ArticlePubMedPMC
- 39. Seo K, Ryu S, Jeong S, Kang HT, Kim SK, Koh SB, et al. Risk of insomnia symptoms according to work-family conflict by workers' characteristics. Ann Occup Environ Med 2023;35:e36.ArticlePubMedPMCPDF
- 40. Roth T. Prevalence, associated risks, and treatment patterns of insomnia. J Clin Psychiatry 2005;66 Suppl 9:10–3.PubMed
- 41. Leger D, Massuel MA, Metlaine A, Group SS. Professional correlates of insomnia. Sleep 2006;29(2):171–8.PubMed
- 42. Pinquart M, Sorensen S. Risk factors for loneliness in adulthood and old age: a meta-analysis. In: Shohov SP, editor. Advances in Psychology Research. Vol. 19. Hauppauge, NY: Nova Science Publishers; 2003, 111–43.
- 43. Stickley A, Koyanagi A, Leinsalu M, Ferlander S, Sabawoon W, McKee M. Loneliness and health in Eastern Europe: findings from Moscow, Russia. Public Health 2015;129(4):403–10.ArticlePubMed
- 44. Yildirim Y, Kocabiyik S. The relationship between social support and loneliness in Turkish patients with cancer. J Clin Nurs 2010;19(5-6):832–9.ArticlePubMed
- 45. Noh HJ. Social relationships of young single-person households. Health Soc Welf Rev 2018;38(2):71–102.Article
- 46. Hawkley LC, Buecker S, Kaiser T, Luhmann M. Loneliness from young adulthood to old age: explaining age differences in loneliness. Int J Behav Dev 2022;46(1):39–49.ArticlePubMedPDF
- 47. Jessen MA, Pallesen AV, Kriegbaum M, Kristiansen M. The association between loneliness and health: a survey-based study among middle-aged and older adults in Denmark. Aging Ment Health 2018;22(10):1338–43.ArticlePubMed
- 48. Griffin SC, Williams AB, Ravyts SG, Mladen SN, Rybarczyk BD. Loneliness and sleep: A systematic review and meta-analysis. Health Psychol Open 2020;7(1):2055102920913235.ArticlePubMedPMCPDF
- 49. Bu F, Steptoe A, Fancourt D. Who is lonely in lockdown? Cross-cohort analyses of predictors of loneliness before and during the COVID-19 pandemic. Public Health 2020;186:31–4.ArticlePubMed
- 50. Shor E, Roelfs DJ, Yogev T. The strength of family ties: a meta-analysis and meta-regression of self-reported social support and mortality. Soc Netw 2013;35(4):626–38.Article
REFERENCES
Figure & Data
REFERENCES
Citations
Citations to this article as recorded by 
- Differential Health Effects of Occupational and Leisure-Time Physical Activity: A Korean Perspective Review
Bart Cillekens, Pieter Coenen, P. Paul F.M. Kuijer
Physical Therapy Korea.2026; 33(1): 1. CrossRef - Influencing Factors of Quality of Life Among Korean Women in One-Person and Multiperson Households: Analysis of the 8th Korean National Health and Nutrition Examination Survey
Mi-Rae An, Seul-Gi Jeong, Ju-Hee Nho
Journal of Korean Maternal and Child Health.2025; 29(4): 228. CrossRef
 Cite
Cite- Figure
-
- Related articles
-
- Association between working ≥10 hours per day and satisfaction with work environment among wage workers in Korea: a cross-sectional study using data from the 7th Korean Working Conditions Survey
- Association between sudden work recall and psychological health issues: a cross-sectional analysis of the 6th Korean Working Conditions Survey
- Health effects of weekend work on Korean workers: based on the 6th Korean Working Conditions Survey
- Association between multiple jobs and physical and psychological symptoms among the Korean working population
Association between single-person household wage workers in South Korea and insomnia symptoms: the 6th Korean Working Conditions Survey (KWCS)
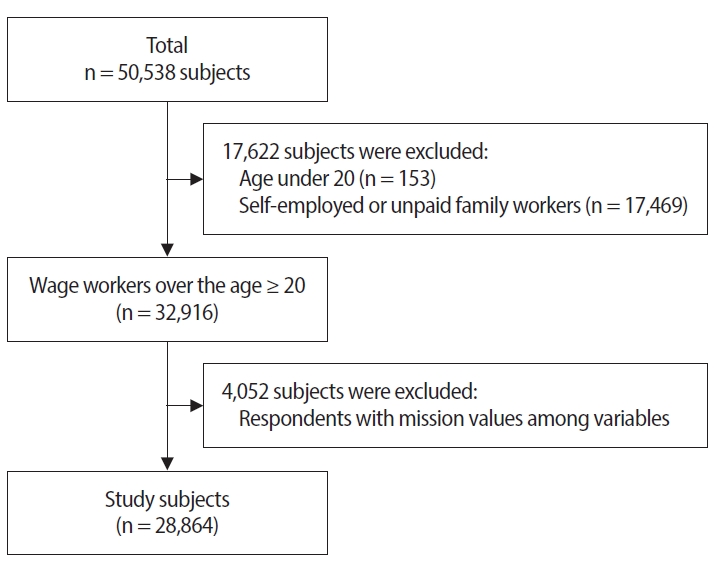
Fig. 1. Flowchart showing the final selection.
Fig. 1.
Association between single-person household wage workers in South Korea and insomnia symptoms: the 6th Korean Working Conditions Survey (KWCS)
| Total (n = 33,113) | No. of household members |
p-value | ||
|---|---|---|---|---|
| ≥2 (n = 29,992) | 1 (n = 29,992) | |||
| Sex | ||||
| Men | 18,818 (56.8) | 17,045 (56.8) | 1,773 (56.8) | 0.980 |
| Women | 14,295 (43.2) | 12,947 (43.2) | 1,348 (43.2) | |
| Age (years) | ||||
| 20–29 | 5,464 (16.5) | 4,722 (15.7) | 742 (23.8) | <0.001 |
| 30–39 | 7,519 (22.7) | 6,836 (22.8) | 683 (21.9) | |
| 40–49 | 8,192 (24.7) | 7,793 (26.0) | 399 (12.8) | |
| 50–59 | 7,265 (21.9) | 6,764 (22.6) | 501 (16.1) | |
| ≥60 | 4,673 (14.1) | 3,877 (12.9) | 796 (25.5) | |
| Education level | ||||
| High school or below | 13,536 (40.9) | 11,883 (39.6) | 1,653 (53.0) | <0.001 |
| University or above | 19,577 (59.1) | 18,109 (60.4) | 1,468 (47.0) | |
| Household monthly income (KRW) | ||||
| <2,000,000 | 9,193 (27.8) | 8,062 (26.9) | 1,131 (36.2) | <0.001 |
| 2,000,000–3,000,000 | 10,775 (32.5) | 9,619 (32.1) | 1,156 (37.0) | |
| 3,000,000–4,000,000 | 7,246 (21.9) | 6,667 (22.2) | 579 (18.5) | |
| ≥4,000,000 | 5,900 (17.8) | 5,644 (18.8) | 256 (8.2) | |
| Weekly working time (hours) | ||||
| ≤40 | 23,719 (71.6) | 21,504 (71.7) | 2,215 (70.9) | 0.015 |
| 41–52 | 7,208 (21.8) | 6,545 (21.8) | 663 (21.2) | |
| ≥53 | 2,186 (6.6) | 1,942 (6.5) | 244 (7.8) | |
| Job classification | ||||
| White | 8,337 (25.2) | 7,683 (25.6) | 654 (20.9) | <0.001 |
| Pink | 13,013 (39.3) | 12,011 (40.0) | 1,002 (32.1) | |
| Green | 76 (0.2) | 63 (0.2) | 13 (0.4) | |
| Blue | 11,688 (35.3) | 10,235 (34.1) | 1,453 (46.5) | |
| No. of employees | ||||
| <50 | 21,093 (63.7) | 18,847 (62.8) | 2,246 (72.0) | <0.001 |
| 50–299 | 6,262 (18.9) | 5,773 (19.2) | 489 (15.7) | |
| ≥300 | 5,758 (17.4) | 5,372 (17.9) | 386 (12.4) | |
| Type of employment | ||||
| Regular | 26,581 (80.3) | 24,472 (81.6) | 2,109 (67.6) | <0.001 |
| Temporary | 4,732 (14.3) | 4,027 (13.4) | 705 (22.6) | |
| Day laborers | 1,800 (5.4) | 1,493 (5.0) | 307 (9.8) | |
| Shift work | ||||
| No | 29,762 (89.9) | 26,913 (89.7) | 2,849 (91.3) | 0.006 |
| Yes | 3,351 (10.1) | 3,079 (10.3) | 272 (8.7) | |
| Job stress | ||||
| Low | 7,497 (22.6) | 6,641 (22.1) | 856 (27.4) | <0.001 |
| High | 25,617 (77.4) | 23,351 (77.9) | 2,266 (72.6) | |
| Presenteeism | ||||
| No | 29,400 (88.8) | 26,591 (88.7) | 2,809 (90.0) | 0.027 |
| Yes | 3,714 (11.2) | 3,401 (11.3) | 313 (10.0) | |
| Self-rated health status |
||||
| Good | 27,418 (96.9) | 24,987 (97.0) | 2,431 (95.7) | <0.001 |
| Poor | 882 (3.1) | 773 (3.0) | 109 (4.3) | |
| Insomnia symptoms |
||||
| No | 30,468 (92.0) | 27,640 (92.2) | 2,828 (90.6) | 0.002 |
| Yes | 2,645 (8.0) | 2352 (7.8) | 293 (9.4) | |
| Age (years) | Total (n = 33,113) | Insomnia symptoms |
p-value | p for trend | |
|---|---|---|---|---|---|
| No (n = 30,468) | Yes (n = 2,645) | ||||
| 20–29 | 5,463 (100) | 5,174 (94.7) | 289 (5.3) | <0.001 | <0.001 |
| 30–39 | 7,519 (100) | 6,975 (92.8) | 544 (7.2) | ||
| 40–49 | 8,192 (100) | 7,563 (92.3) | 629 (7.7) | ||
| 50–59 | 7,265 (100) | 6,626 (91.2) | 639 (8.8) | ||
| ≥60 | 4,674 (100) | 4,130 (88.4) | 544 (11.6) | ||
| No. of household members | Total (n = 33,113) | Insomnia symptoms |
p-value | p for trend | |
|---|---|---|---|---|---|
| No (n = 30,468) | Yes (n = 2,645) | ||||
| 1 | 3,121 (100) | 2,828 (90.6) | 293 (9.4) | <0.001 | <0.001 |
| 2 | 6,739 (100) | 6,156 (91.3) | 583 (8.7) | ||
| 3 | 9,068 (100) | 8,362 (92.2) | 706 (7.8) | ||
| ≥4 | 14,186 (100) | 13,123 (92.5) | 1,063 (7.5) | ||
| Insomnia symptoms |
OR (95% CI) |
|||
|---|---|---|---|---|
| Crude | Model 1 | Model 2 | Model 3 | |
| No | Ref. | Ref. | Ref. | Ref. |
| Yes | 1.219 (1.073–1.385) |
1.194 (1.048–1.361) |
1.209 (1.056–1.385) |
1.173 (1.020–1.349) |
Table 1. Characteristics of study subjects according to the number of household members
Values are presented as number (%). Excellent, good, fair were classified as having good self-rated health and poor, very poor were classified as having poor self-rated health; Subjects with Minimal Insomnia Symptom Scale (MISS) scores of 6 or higher were categorized into a group having symptoms of insomnia.
Table 2. Changes in prevalence of insomnia symptoms by age groups
Values are presented as number (%). Subjects with Minimal Insomnia Symptom Scale (MISS) scores of 6 or higher were categorized into a group having symptoms of insomnia.
Table 3. Changes in prevalence of insomnia symptoms with increasing household size
Values are presented as number (%). Subjects with Minimal Insomnia Symptom Scale (MISS) scores of 6 or higher were categorized into a group having symptoms of insomnia.
Table 4. ORs and 95% CIs for insomnia symptoms whether single-person household or not
Crude: unadjusted; Model 1: adjusted for adjusted for sex, age, education level, household monthly income, weekly working time, shift work; Model 2: adjusted for adjusted for sex, age, education level, household monthly income, weekly working time, shift work, job classification, number of employees, type of employment, job stress, presenteeism; Model 3: adjusted for adjusted for sex, age, education level, household monthly income, weekly working time, shift work, job classification, number of employees, type of employment, job stress, presenteeism, self-rated health. OR: odds ratio; CI: confidence interval. Subjects with Minimal Insomnia Symptom Scale (MISS) scores of 6 or higher were categorized into a group having symptoms of insomnia.

