
Articles
- Page Path
- HOME > Ann Occup Environ Med > Volume 35; 2023 > Article
- Original Article Relationship between visual display terminal working hours and headache/eyestrain in Korean wage workers during the COVID-19 pandemic: the sixth Korean Working Conditions Survey
-
Gayoung Kim
 , Seong-yong Cho, Jinseok Kim, Seongyong Yoon, Jisoo Kang, Si young Kim
 -
Annals of Occupational and Environmental Medicine 2023;35:e8.
DOI: https://doi.org/10.35371/aoem.2023.35.e8
Published online: May 9, 2023
Department of Occupational and Environmental Medicine, Soonchunhyang University Gumi Hospital, Gumi, Korea.
- Correspondence: Seong-yong Cho. Department of Occupational and Environmental Medicine, Soonchunhyang University Gumi Hospital, 179 1gongdan-ro, Gumi 39371, Korea. 97blueciel@naver.com
• Received: December 11, 2022 • Revised: March 29, 2023 • Accepted: April 3, 2023
Copyright © 2023 Korean Society of Occupational & Environmental Medicine
This is an Open Access article distributed under the terms of the Creative Commons Attribution Non-Commercial License (https://creativecommons.org/licenses/by-nc/4.0/) which permits unrestricted non-commercial use, distribution, and reproduction in any medium, provided the original work is properly cited.
Abstract
-
Background Prolonged use of visual display terminal (VDT) can cause eyestrain, dry eyes, blurred vision, double vision, headache and musculoskeletal symptoms (neck, shoulder, and wrist pain). VDT working hours among workers have greatly increased during the coronavirus disease 2019 (COVID-19) pandemic. Therefore, this study aimed to investigate the relationship between VDT working hours and headache/eyestrain in wage workers using data from the sixth Korean Working Conditions Survey (KWCS) (2020–2021) conducted during the COVID-19 pandemic.
-
Methods We analyzed the sixth KWCS data of 28,442 wage workers aged 15 years or older. The headache/eyestrain that occurred in the last year was assessed. The VDT work group included workers who use VDT always, almost always, and three-fourth of the working hours, while the non-VDT work group included workers who use VDT half of the working hours, one-fourth of the working hours, almost never, and never. To analyze the relationship between VDT working hours and headache/eyestrain, the odds ratios (ORs) and 95% confidence interval (CI) were calculated using logistic regression analysis.
-
Results Among the non-VDT work group, 14.4% workers experienced headache/eyestrain, whereas 27.5% workers of the VDT work group experienced these symptoms. For headache/eyestrain, the VDT work group showed adjusted OR of 1.94 (95% CI: 1.80–2.09), compared with the non-VDT work group, and the group that always used VDT showed adjusted OR of 2.54 (95% CI: 2.26–2.86), compared with the group that never used VDT.
-
Conclusions This study suggests that during the COVID-19 pandemic, as VDT working hours increased, the risk of headache/eyestrain increased for Korean wage workers.
BACKGROUND
A visual display terminal (VDT) is a screening device that displays various data using a cathode ray tube, liquid crystal display, or gas plasma.1 It includes computer, tablets, e-readers, smartphones, and other electronic gadget.2 Prolonged use of VDT can cause ocular symptoms (eyestrain, dry eyes, blurred vision, and double vision), headache, and musculoskeletal symptoms (neck, shoulder, and wrist pain).3,4,5
The coronavirus disease 2019 (COVID-19), first reported in December 2019, led to an increase in the rates of non-contact work and work from home. Consequently, the VDT working hours among workers greatly increased during the COVID-19 pandemic.6,7 The lockdown forced most people to continue using the internet and internet-based services to communicate and interact and work from home.8 A comparison between the first (2006) and sixth Korean Working Conditions Survey (KWCS) (2020–2021) revealed that the proportion of workers who always used VDT throughout their working hours increased from 7.9% to 14.7%. Additionally, the proportion of workers reporting headache/eyestrain was 13.4% in 2006 and 19.0% during 2020–2021.
Previous studies examining the association between VDT working hours and headache/eyestrain have mainly been conducted with adolescents or information technology (IT) workers, whereas studies targeting the general workforce are limited. Moreover, it is necessary to investigate the scale of the health problems that occurred during the COVID-19 pandemic.
To date, few studies have evaluated the risk of headache/eyestrain with respect to VDT working hours during the COVID-19 pandemic. Therefore, this study aimed to investigate the relationship between VDT working hours and headache/eyestrain in wage workers using data from the sixth KWCS (2020–2021) conducted during the COVID-19 pandemic.
METHODS
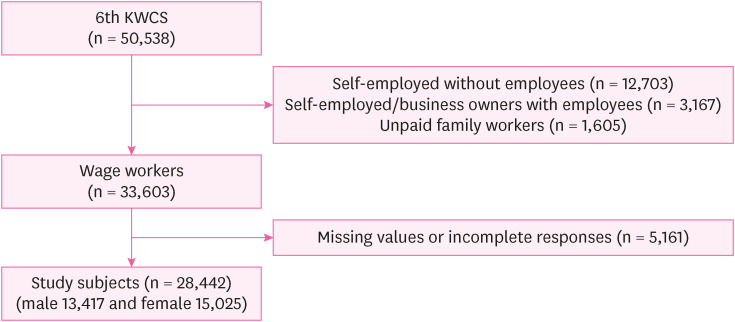
We analyzed data from the sixth KWCS conducted between 2020 and 2021 by the Occupational Safety and Health Research Institute. The KWCS is a large-scale national survey that has been conducted since 2006 to investigate occupational and environmental risk factors, and provide preliminary data for improving working conditions.9 The sixth KWCS included 50,538 employees aged ≥ 15 years, comprising 12,703 self-employed owners without employees, 3,167 self-employed/business owners with employees, 1,605 unpaid family member workers, and 5,161 workers with missing values or incomplete responses who were excluded. Finally, a total of 28,442 wage workers were included as participants in this study (Fig. 1).
Headache/Eyestrain
The headache/eyestrain that occurred in the last year (or from the time when main work was initiated if one had worked for less than 1 year) was assessed. In the KWCS, questions about headache and eyestrain were designed as one item instead of individually.10
Daily VDT working hours
In the sixth KWCS, the participants were divided into 7 groups based on working hours spent using VDT (always, almost always, three-fourth of the working hours, half of the working hours, one-fourth of the working hours, almost never, and never). We categorized the always, almost always, and three-fourth of the working hours groups as the VDT work group and the half of the working hours, one-fourth of the working hours, almost never, and never groups as the non-VDT work group.
Sociodemographic characteristics
Sociodemographic characteristics included age (15–29, 30–39, 40–49, 50–59, and ≥ 60 years), sex, monthly income (< 2.00, 2.00–2.99, 3.00–3.99, and ≥ 4.00 million Won), and education level (elementary school, middle school, high school, and college).
Occupational characteristics
Occupational characteristics included weekly total working hours (≤ 40 hours or > 40 hours a week), working duration (< 5 years, 5–9 years, or ≥ 10 years), employee type (permanent or temporary), number of employees (< 50, 50–299, or ≥ 300), autonomy at work, night work, job stress (never, not so much, sometimes, mostly, or always), and use of communication device in free time in the past month (never, rarely, several times a month, several times a week, or every day), vibration, noise, high temperature, fume, inhalation of organic solvent vapors, secondhand smoking, painful posture, repetitive motion, sleep problem (no or yes) and occupational classification (white, pink or blue collar). In the questionnaire of the sixth KWCS, communication devices were e-mail, telephone and video conferencing, text messages, social media, and other applications (apps). This also included VDTs such as mobile phones, tablets, and computers.
Data related to the sociodemographic and occupational characteristics and headache/eyestrain, were collected. Chi-square and t-tests were conducted to analyze the distribution and mean of independent variables. Odds ratios (ORs) and 95% confidence intervals (CIs) for headache/eyestrain by VDT working hours were calculated using logistic regression analysis after adjusting sociodemographic and occupational characteristics. All statistical analyses were performed using SPSS 28.0 (IBM Inc., Armonk, NY, USA).
This study’s protocol was reviewed and approved by the Institutional Review Board (IRB) of Soonchunhyang University Gumi Hospital (IRB No. 2022-12). Informed consent was obtained from all participants when they were enrolled.
RESULTS
In the KWCS questionnaire contents, participants were divided into 7 groups based on working hours spent using VDT (always, almost always, three-fourth of the working hours, half of the working hours, one-fourth of the working hours, almost never, and never). Among these groups, the proportions of workers who always used VDT were 7.9%, 9.7%, 8.5%, 9.3%, 14.2%, and 14.7% in the first (2006), second (2010), third (2011), fourth (2014), fifth (2017), and sixth (2020–2021) KWCSs, respectively, showing a gradual increase. The proportion of workers who experienced headache/eye strain was 13.4% in the first (2006) KWCS and 19.0% in the sixth (2020–2021) KWCS (Fig. 2).
Fig. 2

Proportions of workers who always used VDT and experienced headache/eyestrain in the Korean Working Conditions Survey.
VDT: visual display terminal.
Among the 28,442 workers included in the final analysis, 5,419 (19.1%) experienced headache/eyestrain, whereas 23,023 (80.9%) did not experience the symptoms. Most workers who experienced headache/eyestrain were aged 40–49 years old (22.2%), and a higher proportion of women (19.8%) than men (18.2%) experienced symptoms. Most workers (25.3%) who experienced symptoms were in the highest income group (≥ 4.00 million Won), while the lowest proportion (14.9%) of those who experienced symptoms was in the lowest income group (< 2.00 million Won). Additionally, 17.2% and 22.1% of workers who were in the elementary school and college groups, respectively experienced symptoms. Among those who worked ≤ 40 hours weekly, 18.5% experienced headache/eyestrain, while 20.5% of those who worked > 40 hours weekly experienced symptoms. Among those who had been working for no more than 1 year, 15.1% experienced headache/eyestrain, while 23.7% of those who had been working for ≥ 10 years experienced symptoms. Among permanent and temporary employees, 20.6% and 13.4% employees, respectively experienced symptoms. Most workers (26.0%) who were in the company with the largest number of employees (≥ 300) experienced symptoms, whereas the lowest proportion (16.5%) of those who were in the company with the smallest number of employees (< 50) experienced symptoms. Among workers who had autonomy at work, 21.8% experienced symptoms, whereas 18.7% of workers who did not have autonomy at work experienced symptoms. Among workers who worked night shifts, 18.4% experienced headache/eyestrain, whereas 27.2% of workers who did not work at night experienced symptoms. Among workers who always had work-related stress experienced symptoms, 40.2% experienced symptoms, whereas 12.6% of workers who never had work-related stress experienced headache/eyestrain. Among the group that used communication devices several times a month in their free time, 26.8% experienced headache/eyestrain. Among workers who exposed vibration, noise, high temperature, fume, organic solvent, secondhand smoking, painful posture repetitive motion, sleep problem experienced symptoms (22.6%, 27.3%, 24.0%, 26.3%, 31.2%, 44.3%, 26.5%, 21.9%, 39.5%), respectively. And white collar workers were more experienced symptoms (24.6%) than pink collar (13.2%) and blue collar (15.8%) (Table 1).
Table 1
Proportions of headache/eyestrain by sociodemographic and occupational characteristics
Among the non-VDT work group, 14.4% experienced headache/eyestrain, whereas 27.5% of the VDT work group experienced the symptoms. Among those who worked > 40 hours weekly, the proportions of headache/eyestrain in the VDT and non-VDT work groups were 30.9% and 16.1%, respectively. Among those who worked ≤ 40 hours weekly, the proportions were 26.5% and 13.6%, respectively. Regarding daily VDT working hours, the proportion of headache/eyestrains were 14.1%, 14.9%, 16.8%, 19.7%, 26.7%, and 30.5% in workers who had never used VDT, used VDT for one-fourth, half, and three-fourth of their working hours, almost always used VDT, and always used VDT, respectively (Table 2).
Table 2
Associations between headache/eyestrain and weekly total working hours, daily VDT working hours
The VDT work group showed adjusted OR of 1.94 (95% CI: 1.80–2.09) for headache/eyestrain, compared with the non-VDT work group. The group that always used VDT showed adjusted OR of 2.54 (95% CI: 2.26–2.86), compared with the group that never used VDT (Table 3). The group that always used VDT showed adjusted ORs of 2.52 (95% CI: 2.17–2.92) and 2.63 (95% CI: 2.14–3.24) for headache/eyestrain, compared to the group that never used VDT in the ≤ 40 hours weekly and > 40 hours weekly groups, respectively (Table 4).
Table 3
Adjusted ORs and 95% CIs for headache/eyestrain according to VDT work and daily VDT working hours
Model 1: adjusted for age and sex.
Model 2: adjusted for age, sex, monthly income, education, weekly total working hours, working duration, employee type, number of employees, autonomy at work, night work, job stress, use of communication device in free time, vibration, noise, high temperature, fume, inhalation of organic solvent vapors, secondhand smoking, painful posture, repetitive motion, sleep problem and occupational classification.
VDT: visual display terminal; OR: odds ratio; CI: confidence interval.
Table 4
Adjusted ORs and 95% CIs for headache/eyestrain by daily VDT working hours and weekly working hours
Model 1: adjusted for age and sex.
Model 2: adjusted for age, sex, monthly income, education, working duration, employee type, number of employees, autonomy at work, night work, job stress, use of communication device in free time and vibration, noise, high temperature, fume, inhalation of organic solvent vapors, secondhand smoking, painful posture, repetitive motion, sleep problem and occupational classification.
VDT: visual display terminal; OR: odds ratio; CI: confidence interval.
DISCUSSION
The first case of COVID-19 was reported in December 2019; thereafter, the virus spread globally. The duration of daily VDT use by the general population increased by approximately 2.4 hours during the COVID-19 pandemic.11 In a study of 435 participants, VDT use increased during lockdown in 387 (89%) participants.12 The frequency and severity of dry eyes and headaches also increased.13 Moreover, VDT working hours among wage workers greatly increased compared to before the pandemic, resulting in an increase in the number of wage workers who experienced eyestrain.13,14,15 In this study, 14.4% of the non-VDT work group experienced headache/eyestrain, whereas 27.5% of the VDT work group experienced the symptoms. The risk of headache/eyestrain in the group who always used VDT was 2.21 times higher than that in the group who never used VDT. As the daily VDT working hours increased, the risk of headache/eyestrain also increased.
A previous study that assessed 2,216 IT staff reported that the risk of tension-type headaches in the group who used VDT for at least 8 hours was 1.63 times higher than that in the group who used VDT for < 8 hours.16 Vertical head movements, hyperextension, and repeated rotation of the neck during VDT work sessions can cause headache through neck muscle contraction and strain.17,18,19,20,21 In studies that examined 954 adolescents, the risk of migraine in those who used VDT for at least 4 hours was 2.03 times higher than that in those who used VDT for < 4 hours.21,22 Migraine is attributable to the activation of the cerebrovascular system, trigeminal nerve, and central nervous system.23 Bright light from VDT can cause headaches and migraine by activating the trigeminal nerve, including the trigeminal ganglion and nucleus, ventral posteromedial nucleus, thalamus, anterior cingulate, and visual cortices.24,25 This study analyzed headache and eyestrain as one item; hence, it is challenging to objectively compare figures with those in previous studies. However, the increase in headache/eyestrain with increase in VDT use corresponds to findings reported in previous studies.
Eyestrain is also known as asthenopia,26,27 and it can be classified into 2 types. The first is based on external symptoms related to dry eyes, including burning, irritation, tearing, and dryness.27 In a Japanese study that included 102,582 participants aged between 40 and 74 years, the risk of dry eyes in participants who used VDT for at least 5 hours a day increased by 1.58 and 1.56 times in men and women, respectively, compared with that in those who used VDT for less than 1 hour.15 Another study that included 4,393 Japanese young and middle-aged office workers reported that the risk of dry eyes in the group that used VDT daily for > 4 hours was 1.68 times higher than that in the group that used VDT daily for < 2 hours.28 Using VDT remarkably reduces blink rates, thereby reducing tear supplement time and increasing tear evaporation rate. This causes external symptoms of eyestrain, such as dry eyes, foreign body sensation, and itchiness.29
The second is based on internal symptoms including tension behind the eyes, eye pain, blurred vision, and double vision.27 During VDT work, workers’ eyes continuously move and try to repeatedly focus on the blurred pixel on the screen. This process causes eye tension and tired eyes, resulting in impairment of control function, convergence and internal symptoms of eyestrain.30,31 Furthermore, headache is associated with eyestrain and can further aggravate the symptoms.32,33 Based on the results of this study, we deduce that headache/eyestrain is caused by reduced blink rates, tension of eye muscles, irritation by light, and continuously repeated movement of the head and neck during VDT work.34,35,36
Unlike previous studies, this study classified working hours into daily VDT working hours and weekly total working hours to investigate the risk of headache/eyestrain.3,37,38 In a study that investigated 721 wage workers, the ORs for severe or disabling headache among individuals working ≥ 55 hours a week, compared with those working between 35 and 45 hours a week, were 1.38 and 1.63, respectively.39 In other words, the longer the weekly total working hours, the higher the risk of headaches due to repetitive contraction of the neck and shoulders.39 However, unlike previous studies, this study showed that the ORs for headache/eyestrain increased as daily VDT working hours increased, regardless of weekly total working hours.40,41 We conclude that headache/eyestrain is associated more with daily rather than with weekly total VDT working hours.
This study has a few limitations. First, we were unable to demonstrate a direct causal relationship between VDT work and headache/eyestrain, because this was a cross-sectional study that used the KWCS data. Second, since this study used a self-reported questionnaire survey, there may be information bias due to subjective responses. Third, this study did not evaluate work environmental factors, such as the location of VDT, inappropriate lighting, glare, or abnormality of room humidity that may influence the development of headache/eyestrain.42,43 Fourth, medical history was not included in the KWCS data. History of eye disease, contact lens use, and the presence of diabetes or autoimmune diseases have been reported as risk factors for headache/eyestrain.44,45,46
Despite the limitations, to the best of our knowledge, this is the first study to investigate the relationship between VDT working hours and headache/eyestrain using data from the KWCS, a large-scale national survey project.47,48 Moreover, since this study reported the risk of headache/eyestrain according to VDT working hours during the COVID-19 pandemic, the findings can be used as baseline data for future studies on the COVID-19-related occupational and environmental health outcomes.49,50 The Occupational Safety and Health Act and the Ministry of Employment and Labor Notice developed work management guidelines for VDT workers.1 As the COVID-19 pandemic persists, the number of VDT workers with headache/eyestrain is increasing. Strategies to prevent headache/eyestrain are necessary for workers who use VDT for long periods. We recommend a follow-up study that analyzes the relationship between VDT working hours and headache/eyestrain in the post-COVID-19 era.
CONCLUSIONS
This study suggests that as VDT working hours increase, the risk of headache/eyestrain increases for Korean wage workers during the COVID-19 pandemic. Additional longitudinal and structured studies are required to clarify the association between VDT work and headache/eyestrain risk and investigate the methods for improving workers’ health.
Acknowledgements
The author is grateful to all the workers who are still working hard on the site.
Abbreviations
CI
confidence interval
COVID-19
coronavirus disease 2019
KWCS
Korean Working Conditions Survey
IT
information technology
OR
odds ratio
VDT
visual display terminal
-
Funding: This work was supported by the Soonchunhyang University Research Fund.
-
Competing interests: The authors declare that they have no competing interests.
-
Authors contributions:
NOTES
- 1. Ministry of Government Legislation (KR). Work management guidelines for workers handling video display terminals (VDT). Updated 2020]. Accessed December 8, 2022]. https://www.law.go.kr/ .
- 2. Imran K, Khan MI, Zaib HM, Nazir F, Khan NA, Khalid A. Risk factors of computer vision syndrome and its prevention. Pakistan J Medical Health Sci 2023;17(1):475–478.Article
- 3. Parihar JK, Jain VK, Chaturvedi P, Kaushik J, Jain G, Parihar AK. Computer and visual display terminals (VDT) vision syndrome (CVDTS). Med J Armed Forces India 2016;72(3):270–276. 27546968.ArticlePubMedPMC
- 4. Faucett J, Rempel D. VDT-related musculoskeletal symptoms: interactions between work posture and psychosocial work factors. Am J Ind Med 1994;26(5):597–612. 7832208.ArticlePubMed
- 5. Rossignol AM, Morse EP, Summers VM, Pagnotto LD. Video display terminal use and reported health symptoms among Massachusetts clerical workers. J Occup Med 1987;29(2):112–118. 3819890.PubMed
- 6. Kniffin KM, Narayanan J, Anseel F, Antonakis J, Ashford SP, Bakker AB, et al. COVID-19 and the workplace: implications, issues, and insights for future research and action. Am Psychol 2021;76(1):63–77. 32772537.ArticlePubMed
- 7. Nagata T, Ito D, Nagata M, Fujimoto A, Ito R, Odagami K, et al. Anticipated health effects and proposed countermeasures following the immediate introduction of telework in response to the spread of COVID-19: the findings of a rapid health impact assessment in Japan. J Occup Health 2021;63(1):e12198. 33527667.ArticlePubMedPMCPDF
- 8. De’ R, Pandey N, Pal A. Impact of digital surge during COVID-19 pandemic: a viewpoint on research and practice. Int J Inf Manage 2020;55:102171. 32836633.ArticlePubMedPMC
- 9. Choi Y, Park J. The Korean Working Conditions Survey (KWCS): a review on the utilization of the survey database. J Korean Soc Occup Environ Hyg 2019;29(4):431–441.
- 10. Kim YH, Koh S, Cho KM, Chae J, Oh HJ, Chang SJ. Effects of working postures on headache/eye strain in Korean waged workers: the 5th Working Condition Survey (2017). J Korean Soc Occup Environ Hyg 2022;32(2):116–128.
- 11. Neti N, Prabhasawat P, Chirapapaisan C, Ngowyutagon P. Provocation of dry eye disease symptoms during COVID-19 lockdown. Sci Rep 2021;11(1):24434. 34952901.ArticlePubMedPMCPDF
- 12. Bahkir FA, Grandee SS. Impact of the COVID-19 lockdown on digital device-related ocular health. Indian J Ophthalmol 2020;68(11):2378–2383. 33120622.ArticlePubMedPMC
- 13. Agarwal R, Tripathi A, Khan IA, Agarwal M. Effect of increased screen time on eyes during COVID-19 pandemic. J Family Med Prim Care 2022;11(7):3642–3647. 36387628.ArticlePubMedPMC
- 14. Salinas-Toro D, Cartes C, Segovia C, Alonso MJ, Soberon B, Sepulveda M, et al. High frequency of digital eye strain and dry eye disease in teleworkers during the coronavirus disease (2019) pandemic. Int J Occup Saf Ergon 2022;28(3):1787–1792. 34082647.ArticlePubMed
- 15. Hanyuda A, Sawada N, Uchino M, Kawashima M, Yuki K, Tsubota K, et al. Physical inactivity, prolonged sedentary behaviors, and use of visual display terminals as potential risk factors for dry eye disease: JPHC-NEXT study. Ocul Surf 2020;18(1):56–63. 31563549.ArticlePubMed
- 16. Li C, Zhang L, Zhou J, Fan Z, Wang Y, Wang X, et al. Prevalence of primary headache disorders among information technology staff in China: the negative effects of computer use and other correlative factors. BMC Public Health 2020;20(1):443. 32248815.ArticlePubMedPMCPDF
- 17. Collins M, Brown B, Bowman K, Carkeet A. Workstation variables and visual discomfort associated with VDTs. Appl Ergon 1990;21(2):157–161. 15676772.ArticlePubMed
- 18. Reddy SC, Low CK, Lim YP, Low LL, Mardina F, Nursaleha MP. Computer vision syndrome: a study of knowledge and practices in university students. Nepal J Ophthalmol 2013;5(2):161–168. 24172549.ArticlePubMedPDF
- 19. LaBan MM, Meerschaert JR. Computer-generated headache. Brachiocephalgia at first byte. Am J Phys Med Rehabil 1989;68(4):183–185. 2765210.PubMed
- 20. Saueressig IB, Xavier MK, Oliveira VM, Pitangui AC, Araújo RC. Primary headaches among adolescents and their association with excessive computer use. Rev Dor 2015;16(4):244–248.Article
- 21. Montagni I, Guichard E, Carpenet C, Tzourio C, Kurth T. Screen time exposure and reporting of headaches in young adults: a cross-sectional study. Cephalalgia 2016;36(11):1020–1027. 26634831.ArticlePubMedPDF
- 22. Xavier MK, Pitangui AC, Silva GR, Oliveira VM, Beltrão NB, Araújo RC. Prevalence of headache in adolescents and association with use of computer and videogames. Cien Saude Colet 2015;20(11):3477–3486. 26602725.PubMed
- 23. Lambert GA, Zagami AS. The mode of action of migraine triggers: a hypothesis. Headache 2009;49(2):253–275. 18793210.ArticlePubMed
- 24. Friedman DI, De ver Dye T. Migraine and the environment. Headache 2009;49(6):941–952. 19545255.ArticlePubMed
- 25. Moulton EA, Becerra L, Borsook D. An fMRI case report of photophobia: activation of the trigeminal nociceptive pathway. Pain 2009;145(3):358–363. 19674842.ArticlePubMedPMC
- 26. Sheedy JE. The physiology of eyestrain. J Mod Opt 2007;54(9):1333–1341.Article
- 27. Sheedy JE, Hayes JN, Engle J. Is all asthenopia the same? Optom Vis Sci 2003;80(11):732–739. 14627938.ArticlePubMedPDF
- 28. Uchino M, Schaumberg DA, Dogru M, Uchino Y, Fukagawa K, Shimmura S, et al. Prevalence of dry eye disease among Japanese visual display terminal users. Ophthalmology 2008;115(11):1982–1988. 18708259.ArticlePubMed
- 29. Freudenthaler N, Neuf H, Kadner G, Schlote T. Characteristics of spontaneous eyeblink activity during video display terminal use in healthy volunteers. Graefes Arch Clin Exp Ophthalmol 2003;241(11):914–920. 14586592.ArticlePubMedPDF
- 30. Shrestha GS, Mohamed FN, Shah DN. Visual problems among video display terminal (VDT) users in Nepal. J Optom 2011;4(2):56–62.ArticlePMC
- 31. Yoo JS, Yoon JW, Kim JD. Influence of VDT work on accommodative function. J Korean Ophthalmol Soc 1992;33(7):693–397.
- 32. Nguyen E, Inger H, Jordan C, Rogers D. Ocular causes for headache. Semin Pediatr Neurol 2021;40:100925. 34749915.ArticlePubMed
- 33. Friedman DI. Headache and the eye. Curr Pain Headache Rep 2008;12(4):296–304. 18625108.ArticlePubMedPDF
- 34. Park CJ, Yoo JS, Kim JH. Changes of accommodative function in VDT workers in relation to rest. J Korean Ophthalmol Soc 1994;35(7):790–794.
- 35. Daum KM, Good G, Tijerina L. Symptoms in video display terminal operators and the presence of small refractive errors. J Am Optom Assoc 1988;59(9):691–697. 3183284.PubMed
- 36. Gobba FM, Broglia A, Sarti R, Luberto F, Cavalleri A. Visual fatigue in video display terminal operators: objective measure and relation to environmental conditions. Int Arch Occup Environ Health 1988;60(2):81–87. 3346085.ArticlePubMedPDF
- 37. Chlasta-Twardzik E, Górecka-Nitoń A, Nowińska A, Wylęgała E. The influence of work environment factors on the ocular surface in a one-year follow-up prospective clinical study. Diagnostics (Basel) 2021;11(3):392. 33668951.ArticlePubMedPMC
- 38. Fjaervoll K, Fjaervoll H, Magno M, Nøland ST, Dartt DA, Vehof J, et al. Review on the possible pathophysiological mechanisms underlying visual display terminal-associated dry eye disease. Acta Ophthalmol 2022;100(8):861–877. 35441459.ArticlePubMedPMCPDF
- 39. Sato K, Hayashino Y, Yamazaki S, Takegami M, Ono R, Otani K, et al. Headache prevalence and long working hours: the role of physical inactivity. Public Health 2012;126(7):587–593. 22721815.ArticlePubMed
- 40. Tiwari RR. Eyestrain in working children of footwear making units of Agra, India. Indian Pediatr 2013;50(4):411–413. 23255679.ArticlePubMedPDF
- 41. Ruliati LP, Maisal FM, Junias MS, Santi LE. Ergonomic analysis of work fatigue and eyestrain among wig makers at PT. SCI Indonesia Kupang City. Proceedings of the 4th International Symposium on Health Research (ISHR 2019); 2019 November 27–30; Bali, Indonesia. Amsterdam, The Netherlands: Atlantis Press; 2020;p. 434–439.
- 42. Gowrisankaran S, Sheedy JE. Computer vision syndrome: a review. Work 2015;52(2):303–314. 26519133.ArticlePubMed
- 43. Lin CJ, Feng WY, Chao CJ, Tseng FY. Effects of VDT workstation lighting conditions on operator visual workload. Ind Health 2008;46(2):105–111. 18413962.ArticlePubMed
- 44. Kojima T. Contact lens-associated dry eye disease: recent advances worldwide and in Japan. Invest Ophthalmol Vis Sci 2018;59(14):DES102–DES108. 30481813.ArticlePubMed
- 45. Dessie A, Adane F, Nega A, Wami SD, Chercos DH. Computer vision syndrome and associated factors among computer users in Debre Tabor Town, Northwest Ethiopia. J Environ Public Health 2018;2018:4107590. 30305823.ArticlePubMedPMCPDF
- 46. Bilgic AA, Kocabeyoglu S, Dikmetas O, Tan C, Karakaya J, Irkec M. Influence of video display terminal use and meibomian gland dysfunction on the ocular surface and tear neuromediators. Int Ophthalmol 2022;43(5):1537–1544. 36239837.ArticlePubMedPDF
- 47. Palm P, Risberg EH, Mortimer MP, Palmerud GP, Toomingas AP, Tornqvist EW. Computer use, neck and upper-extremity symptoms, eyestrain and headache among female and male upper secondary school students. Scand J Work Environ Health Suppl 2007;(3):33–41.
- 48. Ganne P, Najeeb S, Chaitanya G, Sharma A, Krishnappa NC. Digital eye Strain epidemic amid COVID-19 pandemic - a cross-sectional survey. Ophthalmic Epidemiol 2021;28(4):285–292. 33369521.ArticlePubMed
- 49. Balci R, Aghazadeh F. The effect of work-rest schedules and type of task on the discomfort and performance of VDT users. Ergonomics 2003;46(5):455–465. 12745696.ArticlePubMed
- 50. Ye Z, Abe Y, Kusano Y, Takamura N, Eida K, Takemoto T, et al. The influence of visual display terminal use on the physical and mental conditions of administrative staff in Japan. J Physiol Anthropol 2007;26(2):69–73. 17435346.ArticlePubMed
REFERENCES
REFERENCES
Figure & Data
REFERENCES
Citations
Citations to this article as recorded by 
- Occupational exposure to video display terminals: a systematic review of ocular and visual health effects and associated risk factors
Eva Artime-Ríos, Mar Seguí-Crespo, Begoña Doménech-Amigot, Mar Sánchez-Brau, Ana Suárez-Sánchez, José María Ramada-Rodilla
Journal of Occupational Health.2026;[Epub] CrossRef - Association between occupational exposure, musculoskeletal disorders, occupational depression, and workplace violence in Korean workers: a nationwide large-scale study
Shiva Raj Acharya, Jeevan Bhatta, Rajitha Kawshalya Mailan Arachchige Don
Global Health Journal.2026; 10(1): 26. CrossRef - Association Between Work Intensity and Eye Fatigue among Workers
Wan-Kee Kim
The Korean Journal of Vision Science.2025; 27(4): 345. CrossRef - Effects of Night Shifts and Long Working Hours on Eye Fatigue and Work-Related Stress
Wan-Kee Kim, Tae-Hyeong Kim, Eun-Hee Lee
The Korean Journal of Vision Science.2025; 27(4): 269. CrossRef
 Cite
Cite- Figure
-
- Related articles
-
- Association between working ≥10 hours per day and satisfaction with work environment among wage workers in Korea: a cross-sectional study using data from the 7th Korean Working Conditions Survey
- Association between sudden work recall and psychological health issues: a cross-sectional analysis of the 6th Korean Working Conditions Survey
- Health effects of weekend work on Korean workers: based on the 6th Korean Working Conditions Survey
- Association between single-person household wage workers in South Korea and insomnia symptoms: the 6th Korean Working Conditions Survey (KWCS)
Relationship between visual display terminal working hours and headache/eyestrain in Korean wage workers during the COVID-19 pandemic: the sixth Korean Working Conditions Survey

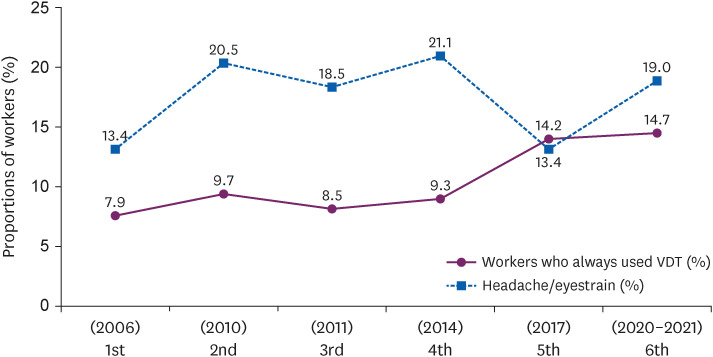
Fig. 1 Flow chart of the selection of study participants.KWCS: Korean Working Conditions Survey.
Fig. 2 Proportions of workers who always used VDT and experienced headache/eyestrain in the Korean Working Conditions Survey.VDT: visual display terminal.
Fig. 1
Fig. 2
Relationship between visual display terminal working hours and headache/eyestrain in Korean wage workers during the COVID-19 pandemic: the sixth Korean Working Conditions Survey
| Variables | Headache/Eyestrain | Total (n = 28,442) | |||
|---|---|---|---|---|---|
| Yes (n = 5,419) | No (n = 23,023) | ||||
| Age (years) | 47.33 ± 13.01 | 47.47 ± 14.46 | 47.44 ± 14.20 | 0.504a | |
| 15–29 | 407 (13.0) | 2,712 (87.0) | 3,119 (100.0) | < 0.001b | |
| 30–39 | 1,219 (20.4) | 4,771 (90.0) | 5,990 (100.0) | ||
| 40–49 | 1,535 (22.2) | 5,386 (78.0) | 6,921 (100.0) | ||
| 50–59 | 1,315 (19.7) | 5,350 (80.0) | 6,665 (100.0) | ||
| ≥ 60 | 943 (16.4) | 4,804 (84.0) | 5,747 (100.0) | ||
| Sex | < 0.001 | ||||
| Male | 2,441 (18.2) | 10,976 (82.0) | 13,417 (100.0) | ||
| Female | 2,978 (19.8) | 12,047 (80.0) | 15,025 (100.0) | ||
| Monthly income (million Won) | < 0.001 | ||||
| < 2.00 | 1,365 (14.9) | 7,787 (85.0) | 9,152 (100.0) | ||
| 2.00–2.99 | 1,859 (19.3) | 7,789 (81.0) | 9,648 (100.0) | ||
| 3.00–3.99 | 1,190 (21.0) | 4,484 (79.0) | 5,674 (100.0) | ||
| ≥ 4.00 | 1,005 (25.3) | 2,963 (75.0) | 3,968 (100.0) | ||
| Education | < 0.001 | ||||
| Elementary | 276 (17.2) | 1,330 (83.0) | 1,606 (100.0) | ||
| Middle | 226 (13.9) | 1,403 (86.0) | 1,629 (100.0) | ||
| High | 1,518 (15.4) | 8,328 (85.0) | 9,846 (100.0) | ||
| College | 3,399 (22.1) | 19,962 (78.0) | 15,361 (100.0) | ||
| Weekly total working hours | 40.27 ± 10.89 | 38.49 ± 12.26 | 38.83 ± 12.03 | < 0.001 | |
| ≤ 40 | 3,765 (18.5) | 16,606 (82.0) | 20,371 (100.0) | < 0.001 | |
| > 40 | 1,654 (20.5) | 6,417 (80.0) | 8,071 (100.0) | ||
| Working duration (years) | < 0.001 | ||||
| < 5 | 2,573 (16.5) | 13,053 (84.0) | 15,626 (100.0) | ||
| 5–9 | 1,233 (20.5) | 4,790 (80.0) | 6,023 (100.0) | ||
| ≥ 10 | 1,613 (23.7) | 5,180 (86.0) | 6,793 (100.0) | ||
| Employee type | < 0.001 | ||||
| Permanent | 4,583 (20.6) | 17,623 (79.0) | 22,206 (100.0) | ||
| Temporary | 836 (13.4) | 5,400 (87.0) | 6,236 (100.0) | ||
| Number of employees | < 0.001 | ||||
| < 50 | 3,212 (16.5) | 16,213 (84.0) | 19,425 (100.0) | ||
| 50–299 | 1,103 (23.1) | 3,671 (77.0) | 4,774 (100.0) | ||
| ≥ 300 | 1,104 (26.0) | 3,139 (74.0) | 4,243 (100.0) | ||
| Autonomy at work | < 0.001 | ||||
| No | 4,747 (18.7) | 20,612 (81.0) | 25,359 (100.0) | ||
| Yes | 672 (21.8) | 2,411 (78.0) | 3,083 (100.0) | ||
| Night work | < 0.001 | ||||
| No | 4,807 (18.4) | 21,381 (82.0) | 26,188 (100.0) | ||
| Yes | 612 (27.2) | 1,642 (73.0) | 2,254 (100.0) | ||
| Job stress | < 0.001 | ||||
| Never | 173 (12.6) | 1,204 (87.0) | 1,377 (100.0) | ||
| Not so much | 640 (11.9) | 4,739 (88.0) | 5,379 (100.0) | ||
| Sometimes | 2,358 (17.8) | 10,865 (82.0) | 13,223 (100.0) | ||
| Mostly | 1,669 (23.8) | 5,352 (76.0) | 7,021 (100.0) | ||
| Always | 579 (40.2) | 863 (60.0) | 1,442 (100.0) | ||
| Use of communication device in free time | < 0.001 | ||||
| Never | 1,904 (14.6) | 11,149 (85.0) | 13,050 (100.0) | ||
| Rarely | 1,496 (22.0) | 5,292 (78.0) | 6,788 (100.0) | ||
| Several times a month | 400 (26.8) | 1,091 (73.0) | 1,491 (100.0) | ||
| Several times a week | 556 (22.1) | 1,963 (78.0) | 2,519 (100.0) | ||
| Every day | 1,063 (23.1) | 3,531 (77.0) | 4,594 (100.0) | ||
| Vibration | < 0.001 | ||||
| No | 4,901 (18.7) | 21,247 (81.3) | 26,148 (100.0) | ||
| Yes | 518 (22.6) | 1,776 (77.4) | 2,294 (100.0) | ||
| Noise | < 0.001 | ||||
| No | 5,064 (18.7) | 22,080 (81.3) | 27,144 (100.0) | ||
| Yes | 355 (27.3) | 943 (72.7) | 1,298 (100.0) | ||
| High temperature | < 0.001 | ||||
| No | 5,192 (18.9) | 22,306 (81.1) | 27,498 (100.0) | ||
| Yes | 227 (24.0) | 717 (76.0) | 944 (100.0) | ||
| Fume | < 0.001 | ||||
| No | 5,049 (18.7) | 21,984 (81.3) | 27,033 (100.0) | ||
| Yes | 370 (26.3) | 1,039 (73.7) | 23,023 (100.0) | ||
| Inhalation of organic solvent vapors | < 0.001 | ||||
| No | 5,303 (18.9) | 22,767 (81.1) | 28,070 (100.0) | ||
| Yes | 116 (31.2) | 256 (68.8) | 372 (100.0) | ||
| Secondhand smoking | < 0.001 | ||||
| No | 5,337 (18.9) | 22,920 (81.1) | 28,257 (100.0) | ||
| Yes | 82 (44.3) | 103 (55.7) | 185 (100.0) | ||
| Painful posture | < 0.001 | ||||
| No | 4,368 (17.8) | 20,104 (82.2) | 24,472 (100.0) | ||
| Yes | 1,051 (26.5) | 2,919 (73.5) | 3,970 (100.0) | ||
| Repetitive motion | < 0.001 | ||||
| No | 3,028 (17.3) | 14,504 (82.7) | 17,532 (100.0) | ||
| Yes | 2,391 (21.9) | 8,517 (78.1) | 10,910 (100.0) | ||
| Sleep problem | < 0.001 | ||||
| No | 4,227 (16.6) | 21,201 (83.4) | 25,428 (100.0) | ||
| Yes | 1,192 (39.5) | 1,822 (60.5) | 3,014 (100.0) | ||
| Occupational classification | < 0.001 | ||||
| White collar | 3,076 (24.6) | 9,441 (75.4) | 12,517 (100.0) | ||
| Pink collar | 879 (13.2) | 5,750 (86.8) | 6,626 (100.0) | ||
| Blue collar | 1,467 (15.8) | 7,832 (84.2) | 9,299 (100.0) | ||
| Variables | Headache/Eyestrain | Total (n = 28,442) | ||||
|---|---|---|---|---|---|---|
| Yes (n = 5,419) | No (n = 23,023) | |||||
| VDT work | < 0.001 | |||||
| Non-VDT work group | 2,637 (14.4) | 15,703 (85.6) | 18,340 (100.0) | |||
| VDT work group | 2,787 (27.5) | 7,320 (72.5) | 10,102 (100.0) | |||
| Weekly total working hour | ||||||
| Non-VDT work group | < 0.001 | |||||
| ≤ 40 | 1,728 (13.6) | 10,949 (86.4) | 12,677 (100.0) | |||
| > 40 | 909 (16.1) | 4,754 (83.9) | 5,663 (100.0) | |||
| VDT work group | < 0.001 | |||||
| ≤ 40 | 2,037 (26.5) | 5,657 (73.5) | 7,694 (100.0) | |||
| > 40 | 745 (30.9) | 1,663 (69.1) | 2,408 (100.0) | |||
| Daily VDT working hour | < 0.001 | |||||
| Never | 1,218 (14.1) | 7,416 (85.9) | 8,634 (100.0) | |||
| Almost never | 629 (13.4) | 4,049 (86.6) | 4,678 (100.0) | |||
| One-fourth of the working hours | 440 (14.9) | 2,505 (85.1) | 2,945 (100.0) | |||
| Half of the working hours | 350 (16.8) | 1,733 (83.2) | 2,083 (100.0) | |||
| Three-fourth of the working hours | 344 (19.7) | 1,398 (80.3) | 1,742 (100.0) | |||
| Almost always | 783 (26.7) | 2,151 (73.3) | 2,934 (100.0) | |||
| Always | 1,655 (30.5) | 3,771 (69.5) | 5,426 (100.0) | |||
| Category | OR (95% CI) | |||
|---|---|---|---|---|
| Crude | Model 1 | Model 2 | ||
| VDT work | ||||
| Non-VDT work group | 1.00 | 1.00 | 1.00 | |
| VDT work group | 2.38 (2.25–2.51) | 2.56 (2.41–2.71) | 1.94 (1.80–2.09) | |
| Daily VDT working hours | ||||
| Never | 1.00 | 1.00 | 1.00 | |
| Almost never | 1.03 (0.93–1.14) | 1.10 (1.00–1.21) | 1.07 (0.96–1.19) | |
| One-fourth of the working hours | 1.30 (1.17–1.49) | 1.46 (1.31–1.63) | 1.25 (1.10–1.42) | |
| Half of the working hours | 1.22 (1.08–1.38) | 1.39 (1.23–1.57) | 1.20 (1.03–1.38) | |
| Three-fourth of the working hours | 1.80 (1.59–2.03) | 2.06 (1.82–2.33) | 1.64 (1.41–1.90) | |
| Almost always | 2.35 (2.13–2.58) | 2.70 (2.44–2.98) | 2.13 (1.87–2.41) | |
| Always | 3.01 (2.78–3.26) | 3.52 (3.23–3.84) | 2.54 (2.26–2.86) | |
| Daily VDT working hours | OR (95% CI) | |||||
|---|---|---|---|---|---|---|
| Weekly total working hours ≤ 40 | Weekly total working hours > 40 | |||||
| Crude | Model 1 | Model 2 | Crude | Model 1 | Model 2 | |
| Never | 1.00 | 1.00 | 1.00 | 1.00 | 1.00 | 1.00 |
| Almost never | 0.99 (0.87–1.12) | 1.08 (0.95–1.22) | 0.99 (0.87–1.14) | 1.07 (0.91–1.25) | 1.10 (0.94–1.30) | 1.22 (1.02–1.45) |
| One-fourth of the working hours | 1.23 (1.08–1.41) | 1.44 (1.27–1.65) | 1.11 (0.95–1.31) | 1.38 (1.16–1.65) | 1.49 (1.25–1.78) | 1.55 (1.26–1.90) |
| Half of the working hours | 1.39 (1.21–1.60) | 1.65 (1.43–1.90) | 1.29 (1.08–1.54) | 0.88 (0.69–1.12) | 0.96 (0.75–1.24) | 0.93 (0.70–1.23) |
| Three-fourth of the working hours | 2.02 (1.76–2.33) | 2.42 (2.10–2.80) | 1.77 (1.48–2.11) | 1.34 (1.05–1.71) | 1.46 (1.14–1.87) | 1.20 (0.90–1.60) |
| Almost always | 2.41 (2.15–2.70) | 2.91 (2.58–3.28) | 2.07 (1.77–2.42) | 2.36 (1.97–2.82) | 2.57 (2.14–3.09) | 2.27 (1.81–2.85) |
| Always | 3.07 (2.79–3.39) | 3.77 (3.39–4.19) | 2.52 (2.17–2.92) | 3.13 (2.69–3.63) | 3.50 (3.00–4.10) | 2.63 (2.14–3.24) |
Table 1 Proportions of headache/eyestrain by sociodemographic and occupational characteristics
Data were presented as mean ± standard deviation or number (%).
aThe
Table 2 Associations between headache/eyestrain and weekly total working hours, daily VDT working hours
VDT: visual display terminal.
aThe
Table 3 Adjusted ORs and 95% CIs for headache/eyestrain according to VDT work and daily VDT working hours
Model 1: adjusted for age and sex.
Model 2: adjusted for age, sex, monthly income, education, weekly total working hours, working duration, employee type, number of employees, autonomy at work, night work, job stress, use of communication device in free time, vibration, noise, high temperature, fume, inhalation of organic solvent vapors, secondhand smoking, painful posture, repetitive motion, sleep problem and occupational classification.
VDT: visual display terminal; OR: odds ratio; CI: confidence interval.
Table 4 Adjusted ORs and 95% CIs for headache/eyestrain by daily VDT working hours and weekly working hours
Model 1: adjusted for age and sex.
Model 2: adjusted for age, sex, monthly income, education, working duration, employee type, number of employees, autonomy at work, night work, job stress, use of communication device in free time and vibration, noise, high temperature, fume, inhalation of organic solvent vapors, secondhand smoking, painful posture, repetitive motion, sleep problem and occupational classification.
VDT: visual display terminal; OR: odds ratio; CI: confidence interval.

