
Articles
- Page Path
- HOME > Ann Occup Environ Med > Volume 35; 2023 > Article
- Original Article Correlation of commute time with the risk of subjective mental health problems: 6th Korean Working Conditions Survey (KWCS)
-
Hyo Choon Lee1
 , Eun Hye Yang1, Soonsu Shin1, Seoung Ho Moon1, Nan Song2, Jae-Hong Ryoo1,3
 -
Annals of Occupational and Environmental Medicine 2023;35:e9.
DOI: https://doi.org/10.35371/aoem.2023.35.e9
Published online: May 11, 2023
1Department of Occupational & Environmental Medicine, Kyung Hee University Hospital, Seoul, Korea.
2Department of Pharmacy, Chungbuk National University, Cheongju, Korea.
3Department of Occupational & Environmental Medicine, College of Medicine Kyung Hee University, Seoul, Korea.
- Correspondence: Jae-Hong Ryoo. Department of Occupational and Environmental Medicine, Kyung Hee University Hospital, and Department of Occupational and Environmental Medicine, School of Medicine, Kyung Hee University, 26 Kyungheedae-ro, Dongdaemoon-gu, Seoul 02447, Korea. armani131@naver.com
• Received: January 2, 2023 • Revised: March 13, 2023 • Accepted: April 13, 2023
Copyright © 2023 Korean Society of Occupational & Environmental Medicine
This is an Open Access article distributed under the terms of the Creative Commons Attribution Non-Commercial License (https://creativecommons.org/licenses/by-nc/4.0/) which permits unrestricted non-commercial use, distribution, and reproduction in any medium, provided the original work is properly cited.
Abstract
-
Background Studies conducted so far on the link between commute time and mental health among Koreans remain insufficient. In this study, we attempted to identify the relationship between commute time and subjective mental health using the 6th Korean Working Conditions Survey (KWCS).
-
Methods Self-reported commute time was divided into four groups: ≤ 30 (group 1), 30–60 (group 2), 60–120 (group 3), and > 120 minutes (group 4). Subjective depression was defined as a score of 50 points or less on the WHO-5 well-being index. Subjective anxiety and fatigue were defined as answering ‘yes’ to the questionnaire on whether they had experienced it over the past year. The analysis of variance, t-test, and χ2 test was used to analyze the differences among the characteristics of the study participants according to commute time, depression, anxiety, and fatigue. Odds ratios (ORs) and 95% confidence intervals (CIs) for depression, anxiety, and fatigue according to commute time were calculated using multivariate logistic regression models adjusted for sex, age, monthly income, occupation, company size, weekly working hours, and shift work status.
-
Results Long commute times showed increased ORs and graded increasing trends for depression, anxiety, and fatigue. The ORs for depression increased significantly in group 2 (1.06 [1.01–1.11]), group 3 (1.23 [1.13–1.33]), and group 4 (1.31 [1.09–1.57]) compared to group 1 (reference). The ORs for anxiety increased significantly in group 2 (1.17 [1.06–1.29]), group 3 (1.43 [1.23–1.65]) and group 4 (1.89 [1.42–2.53]). The ORs for fatigue increased significantly in group 2 (1.09 [1.04–1.15]), group 3 (1.32 [1.21–1.43]), and group 4 (1.51 [1.25–1.82]).
-
Conclusions This study highlights that the risk of depression, anxiety, and fatigue increases with commute time.
BACKGROUND
Most workers, except for telecommuters, commute daily. The method and time of commuting varies depending on the situation of the workers. Commute has many effects on individual well-being, because it is regular and repetitive.1,2 Satisfaction with commute considerably impacts overall happiness.3
Commute time tends to inevitably increase because of the growth of cities and increase in suburban residency caused by rising housing prices.4,5 According to data from Statistics Korea, the average Korean commute time in 2020 was approximately 61.6 min per round trip per day—a slight increase from 55 minutes in 2005.5 This is the longest commute time among OECD countries, and it is more than twice the OECD average.6
Long commutes have various adverse effects on workers. For example, long commute times can increase the risk of sleep disorders7,8 and mental problems,9,10,11,12,13 such as mental strain, depression, anxiety, and fatigue. Workers with longer commute times complain of more subjective health symptoms14 and their productivity is lower than that of workers with shorter commutes.15
Mental health is an important factor for individual well-being, and its importance has recently been emphasized. Many studies have examined the relationship between commute time and mental health. A study conducted at 10 epidemiological investigation centers in South America found that the risk of depression increased by 0.5 percent as commute time increased by 10 minutes.9 A retrospective cohort study in Australia showed a decrease in the Mental Health Inventory score for individuals commuting for more than 6 hours compared to those who commute less than 2 hours a week.10 In the United States, the longer the commute, the higher is the blood concentration of cortisol, a stress hormone.16 Other cross-sectional studies have also reported that commute time adversely affects subjective mental health.11
However, previous studies did not consider shift work status that could affect mental health17,18 and had relatively small sample sizes. In addition, although depression, anxiety, and fatigue are common mental health problems,19,20 comprehensive studies on the relationship between commute time and these mental health problems in Korea are insufficient. Therefore, this study attempted to investigate the correlation of commute time with the risk of subjective mental health problems using the 6th Korean Working Conditions Survey (KWCS).
METHODS
This study was conducted based on data from the 6th KWCS. The KWCS investigates the overall work environment, including the form of work, employment pattern, type of occupation and business, exposure to risk factors, and job stability. The KWCS has been conducted every three years since 2006, and the 6th KWCS was conducted from October 2020 to April 2021.
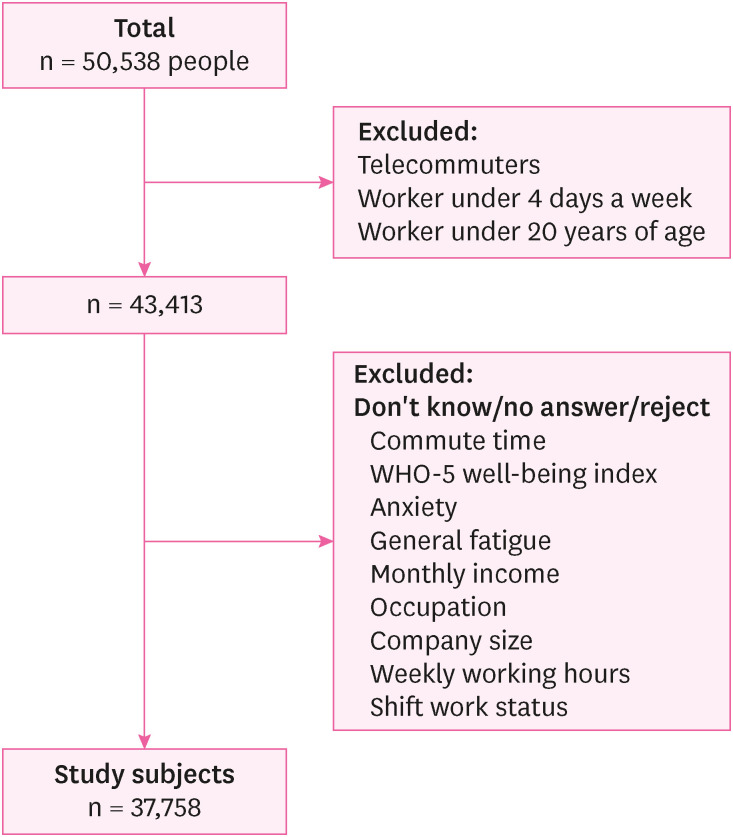
First, we selected 43,413 out of 50,538 workers, excluding telecommuters, workers under four days a week, and those under 20 years of age. Among them, participants who answered “I don’t know,” “no answer,” or “reject” following questionnaire were excluded: commute time, WHO-5 well-being index, anxiety, general fatigue, monthly income, occupation, company size, weekly working hours and shift work status. Finally, data from 37,758 workers were analyzed (Fig. 1).
Self-reported commute times were divided into four groups: ≤ 30 (group 1), 30–60 (group 2), 60–120 (group 3), and > 120 minutes (group 4). The commute time includes a daily round trip per day. Subjective depression was defined as a score of 50 points or less on the WHO-5 well-being index.21 Subjective anxiety and general fatigue were defined as answering ‘yes’ to the questionnaire on whether they had experienced it over the past year.
Age was divided into five groups:20–29, 30–39, 40–49, 50–59, and ≥ 60 years. The monthly income was divided into four groups: < 2, 2–3, 3–4, ≥ 4 million Korean Won (KRW). According to the Korean Standard Classification of Occupations in the 6th KWCS, the occupations of the study population were divided into 11 types: We divided the occupations of the study participants into three categories: white collar workers (mangers, professions occupation, clerical occupation), pink collar workers (service occupation, sales occupation) and blue collar workers (craft and related occupation, plant and machine operatives, other occupations in agriculture, forestry and fishing, other elementary occupation) Based on the number of workers, the company was divided into three groups: < 50, 50–300, ≥ 300 workers. Based on their responses, shift work status was classified as yes or no. Weekly working hours was presented as the average value.
The analysis of variance, t-test, and χ2 test was used to analyze the differences among the characteristics of the study participants according to commute time, depression, anxiety, and fatigue. Data are expressed as numbers (percentage) for categorical variables and as means ± standard deviation for continuous variable.
Odds ratios (ORs) and 95% confidence intervals (CIs) for depression, anxiety, and fatigue according to commute time were calculated using multivariate logistic regression models adjusted for sex, age, monthly income, occupation, company size, weekly working hours, and shift work status.
All statistical analyses were performed using IBM SPSS (version 19 for Windows; IBM Corp., Armonk, NY, USA), and a p-value < 0.05 was considered statistically significant.
The Institutional Review Board (IRB) of Kyung Hee University Hospital approved the study protocol and data analysis (IRB File No. KHUH 2022-05-022). The IRB eliminated the requirement for informed consent because the researchers used a de-identified database retrospectively for the current study.
RESULTS
The baseline characteristics of the commute time groups are shown in Table 1. Data from 37,758 workers (17,871 men and 19,887 women) were analyzed. Men, workers in their thirties and forties, high-income workers, white collar workers, workers at companies with more than 300 employees, shift workers had long commute times. The longer the commute time, the less the average weekly working hours.
Table 1
Comparison of baseline characteristics among groups with varying commute times (n = 37,758)
The baseline characteristics of individuals with and without depression, anxiety, and fatigue are shown in Table 2. 12,363 of 37,758 workers had depression, 2,135 had anxiety, and 9,982 had fatigue. Workers over the age of 50, low-income workers, blue collar workers, workers at companies with less than 50 employees, and shift workers had more depression. Workers over the age of 30, workers at companies with more than 300 employees, and shift workers had more anxiety. Women, workers over the age of 50, low-income workers, blue collar workers, workers at companies with less than 50 employees, and shift workers had more fatigue. Workers with mental health problems such as depression, anxiety, and fatigue had longer average weekly working hours.
Table 2
Comparison of baseline characteristics between individuals with non-mental health problem and mental health problem (n = 37,758)
The ORs and 95% CIs of the multivariate logistic regression models for depression, anxiety, and fatigue according to commute time are shown in Table 3. In all cases, long commute times showed significantly increased ORs and a graded increasing trend in relation to depression, anxiety, and fatigue. The ORs for depression increased significantly in group 2 (OR: 1.06; 95% CI: 1.01–1.11), group 3 (OR: 1.23; 95% CI: 1.13–1.33), and group 4 (OR: 1.31; 95% CI: 1.09–1.57) compared to group 1 (reference). The ORs for anxiety increased significantly in group 2 (OR: 1.17; 95 CI: 1.06–1.29), group 3 (OR: 1.43; 95% CI: 1.23–1.65) and group 4 (OR: 1.89; 95% CI: 1.42–2.53). The ORs for fatigue increased significantly in group 2 (OR: 1.09; 95% CI: 1.04–1.15), group 3 (OR: 1.32; 95% CI: 1.21–1.43) and group 4 (OR: 1.51; 95% CI: 1.25–1.82).
Table 3
Odds ratios and 95% confidence intervals of depression, anxiety, and fatigue according to commute time in both sex group
In the stratification analyses by sex, the ORs for depression increased significantly in group 2 (OR: 1.08; 95% CI: 1.01–1.16), group 3 (OR: 1.39; 95% CI: 1.23–1.56), and group 4 (OR: 1.48; 95% CI: 1.11–1.97) in women. The ORs for anxiety increased significantly in group 3 (OR: 1.35; 95% CI: 1.11–1.66), and group 4 (OR: 1.72; 95% CI: 1.17–2.53) in men, and in group2 (OR: 1.21; 95% CI: 1.05–1.38), groups 3 (OR: 1.49; 95% CI: 1.21–1.84) and group 4 (OR: 2.09; 95% CI: 1.34–3.26) in women. The ORs for fatigue increased significantly in groups 2 (OR: 1.09; 95% CI: 1.01–1.18), group 3 (OR: 1.25; 95% CI: 1.12–1.40), and group 4 (OR: 1.36; 95% CI: 1.06–1.73) in men, and in groups 2 (OR: 1.08; 95% CI: 1.01–1.16), group 3 (OR: 1.38; 95% CI: 1.22–1.56), and group 4 (OR: 1.70; 95% CI: 1.27–2.30) in women. In all cases except depression in men, the multivariate adjusted model showed a significantly graded relationship between commute time and depression, anxiety, and fatigue.
DISCUSSION
This large cross-sectional study highlights that long commute time is significantly associated with depression, anxiety, and fatigue. These results are consistent with previous studies. Wang et al.9 found that the risk of depression increased by 0.5 percent as commute time increased by 10 minutes. Milner et al.10 showed a decrease in the Mental Health Inventory score for individuals commuting for more than 6 hours compared to those who commute less than 2 hours a week. Murphy et al.11 have also reported that commute time adversely affects subjective mental health. These results suggest that an increase in commute time has adverse effect on workers’ mental health and implicate that reducing commute time can contribute to improving workers' mental health.
The adverse effects of long commute times on workers’ mental health can be divided into psychological and physiological causes. A long commute time can reduce the quality of life by reducing the time for family, and leisure activities, such as exercise and hobbies, and it can make workers depressed.10,22 And long commute time can cause insufficient sleep and sleep disorders,8 and these sleep problems can be associated with fatigue,23 anxiety and depression.24,25 It also reduces the time to recover from daily stress and may be wasted, which can adversely affect workers’ mental health.10,26
Dysfunction of the hypothalamic-pituitary-adrenal (HPA) axis can be considered a physiological mechanism. Salivary cortisol increases as commute time increases, and this increased cortisol in the body can cause HPA axis dysfunction, which is associated with depression.16,27 In addition, workers are exposed to traffic noise while commuting, which adversely affects their mental health.28
In Korea, long commute time is intertwined with various and complex social issues. In 2022, 50.5% of Korea’s population lives in the Seoul metropolitan area (Seoul, Gyeonggi, Incheon), which is 11.8% of the total land area, an increase of 3.4% from 47.1% in 2002.29,30 This population structure concentrated in the Seoul metropolitan area can cause traffic jams by increasing population density, which can cause long commute times.31 In fact, 62.0% of workers outside the Seoul metropolitan area had less than 60 minutes of commute time on a round trip a day, while only 35.9% in the Seoul metropolitan area.32 And due to the high housing prices in Korea’s metropolitan cities, especially in Seoul, deciding where to live far away from work is also a reason for the long commute.33 In 2018, 37.9% of the total population in the Seoul metropolitan area lived in Seoul, while the proportion of workers in Seoul accounted for 45.5%, indicating that there was a severe job-housing imbalance between central cities and suburbs.29,33,34 In addition, in Korea, children’s education is an important factor influencing the choice of residential location, and migration to excellent school districts can worsen the job-housing imbalance and cause long commute time.35,36
In our results, women’s commute time was shorter than men’s, but women’s mental health was more adversely affected by long commute time than men's. Women complained of more depression as the commute time increased, and statistically significant, but men did not. Both men and women complained of more anxiety and fatigue as the commute time increased and were statistically significant, but it was found that women were more affected. Roberts et al.37 suggested that women are more sensitive to commute time because of their greater responsibility for daily household duties (such as childcare and housework). Even though gender roles in families have undergone significant change, women are still perceived as being largely responsible for household duties.8 Women consider these household duties when making decisions about commute. In addition, repeated stops for duties like childcare pick-up and drop-off and grocery shopping during the commute increase the stress of commute by imposing greater time restrictions and reducing time flexibility.37
In this study, shift workers complained of more depression, anxiety, and fatigue. These results are consistent with those of previous studies. A meta-analysis of seven longitudinal studies found that shift work increases the overall risk of adverse mental health outcomes. In particular, shift workers had a 33% higher risk of experiencing depressive symptoms than non-shift workers.17 A review of 23 studies suggests that the effects of shift work on mental health include sleep disorders, increased depression and anxiety, increased suicidal thoughts and substance abuse, cognitive decline, and the resulting dissatisfaction with overall life.18
The strength of this study is that as far as we know, it was the first try in Korea to investigate the relationship between worker’s commute time and comprehensive mental health. This study was conducted using KWCS data that can represent general workers in Korea. In addition, we considered shift work status that can affect mental health,17,18 which was not mentioned in previous studies.
This study had several limitations. First, because this was a cross-sectional study, it was difficult to determine a causal relationship. Second, it was not possible to consider the psychiatric histories of the study participants. Third, since it is a self-administered questionnaire, the possibility that information on commute time, depression, anxiety, and fatigue was incorrectly collected cannot be excluded. Fourth, commute means and traffic congestion, known to affect mental health in previous studies, could not be considered. Previous studies have shown a significant difference in the stress experienced by workers depending on the means of commute.11 Active commuting with exercise, such as walking and cycling, has a positive effect on mental health, including depression.38 On the other hand, commuting by car or public transportation had adverse impact on mental health, and the impact was greater when there was a traffic jam.9
CONCLUSIONS
We identified a significant correlation between workers’ commute time and subjective mental health status in Korea. These results suggest that reducing commute time can improve workers' mental health. However, long commute time are associated with various and complex social issues. Comprehensive policies are needed on excessive population density and rising housing prices in the metropolitan areas, and educational imbalances between regions.
Abbreviations
CI
confidence interval
HPA
hypothalamic-pituitary-adrenal
IRB
Institutional Review Board
KWCS
Korean Working Conditions Survey
OR
odds ratio
-
Funding: This work was supported by a grant from Kyung Hee University in 2023 (KHU-20230913). The funding organization had no role in the design or performance of this study. This research was supported by “Regional Innovation Strategy (RIS)” through the National Research Foundation of Korea (NRF) funded by the Ministry of Education (MOE) (2021RIS-001).
-
Competing interests: The authors declare that they have no competing interests.
-
Author Contributions:
NOTES
- 1. Handy S, Thigpen C. Commute quality and its implications for commute satisfaction: Exploring the role of mode, location, and other factors. Travel Behav Soc 2019;16:241–248.Article
- 2. Zhu Z, Li Z, Chen H, Liu Y, Zeng J. Subjective well-being in China: how much does commuting matter? Transportation 2019;46(4):1505–1524.ArticlePDF
- 3. Olsson LE, Gärling T, Ettema D, Friman M, Fujii S. Happiness and satisfaction with work commute. Soc Indic Res 2013;111(1):255–263. 23378683.ArticlePubMedPMC
- 4. Wei J, Wang Q, Gao W. How commuting time affects employees’ income in China’s urbanization process. Sustainability (Basel) 2022;14(23):15977.Article
- 5. Statistics Korea. An Indicator of the Quality of Life of the People: Commute Time. Daejeon, Korea: Statistics Korea; 2022.
- 6. The Organization for Economic Cooperation and Development. Time spent travelling to and from work. Updated 2016]. Accessed November 17, 2022]. https://www.oecd.org/els/family/LMF2_6_Time_spent_travelling_to_and_from_work.pdf .
- 7. Hori D, Sasahara S, Oi Y, Doki S, Andrea CS, Takahashi T, et al. Relationships between insomnia, long working hours, and long commuting time among public school teachers in Japan: a nationwide cross-sectional diary study. Sleep Med 2020;75:62–72. 32853920.ArticlePubMed
- 8. Kim S, Kim Y, Lim SS, Ryoo JH, Yoon JH. Long commute time and sleep problems with gender difference in work–life balance: a cross-sectional study of more than 25,000 workers. Saf Health Work 2019;10(4):470–475. 31890330.ArticlePubMedPMC
- 9. Wang X, Rodríguez DA, Sarmiento OL, Guaje O. Commute patterns and depression: evidence from eleven Latin American cities. J Transp Health 2019;14:100607. 31853443.ArticlePubMedPMC
- 10. Milner A, Badland H, Kavanagh A, LaMontagne AD. Time spent commuting to work and mental health: evidence from 13 waves of an Australian cohort study. Am J Epidemiol 2017;186(6):659–667. 28453601.ArticlePubMed
- 11. Murphy LD, Cobb HR, Rudolph CW, Zacher H. Commuting demands and appraisals: a systematic review and meta-analysis of strain and wellbeing outcomes. Organ Psychol Rev 2022;13(1):11–43.Article
- 12. Baek S, Yoon J, Won J. Mediating effect of work–family conflict on the relationship between long commuting time and workers’ anxiety and insomnia. Saf Health Work 2022;14(1):100–106. 36941934.ArticlePubMedPMC
- 13. Kageyama T, Nishikido N, Kobayashi T, Kurokawa Y, Kaneko T, Kabuto M. Long commuting time, extensive overtime, and sympathodominant state assessed in terms of short-term heart rate variability among male white-collar workers in the Tokyo megalopolis. Ind Health 1998;36(3):209–217. 9701898.ArticlePubMed
- 14. Urhonen T, Lie A, Aamodt G. Associations between long commutes and subjective health complaints among railway workers in Norway. Prev Med Rep 2016;4:490–495. 27660744.ArticlePubMedPMC
- 15. Zenou Y. How do firms redline workers? J Urban Econ 2002;52(3):391–408.Article
- 16. Evans GW, Wener RE. Rail commuting duration and passenger stress. Health Psychol 2006;25(3):408–412. 16719613.ArticlePubMed
- 17. Torquati L, Mielke GI, Brown WJ, Burton NW, Kolbe-Alexander TL. Shift work and poor mental health: a meta-analysis of longitudinal studies. Am J Public Health 2019;109(11):e13–e20.ArticlePubMedPMC
- 18. Brown JP, Martin D, Nagaria Z, Verceles AC, Jobe SL, Wickwire EM. Mental health consequences of shift work: an updated review. Curr Psychiatry Rep 2020;22(2):7. 31955278.ArticlePubMedPDF
- 19. Kalin NH. The critical relationship between anxiety and depression. Am J Psychiatry 2020;177(5):365–367. 32354270.ArticlePubMed
- 20. Watanabe N, Stewart R, Jenkins R, Bhugra DK, Furukawa TA. The epidemiology of chronic fatigue, physical illness, and symptoms of common mental disorders: a cross-sectional survey from the second British National Survey of Psychiatric Morbidity. J Psychosom Res 2008;64(4):357–362. 18374734.ArticlePubMed
- 21. Topp CW, Østergaard SD, Søndergaard S, Bech P. The WHO-5 Well-Being Index: a systematic review of the literature. Psychother Psychosom 2015;84(3):167–176. 25831962.ArticlePubMedPDF
- 22. Christian TJ. Trade-offs between commuting time and health-related activities. J Urban Health 2012;89(5):746–757. 22689293.ArticlePubMedPMCPDF
- 23. Caldwell JA, Caldwell JL, Thompson LA, Lieberman HR. Fatigue and its management in the workplace. Neurosci Biobehav Rev 2019;96:272–289. 30391406.ArticlePubMed
- 24. Chapman DP, Presley-Cantrell LR, Liu Y, Perry GS, Wheaton AG, Croft JB. Frequent insufficient sleep and anxiety and depressive disorders among U.S. community dwellers in 20 states, 2010. Psychiatr Serv 2013;64(4):385–387. 23543168.ArticlePubMed
- 25. Alvaro PK, Roberts RM, Harris JK. A systematic review assessing bidirectionality between sleep disturbances, anxiety, and depression. Sleep (Basel) 2013;36(7):1059–1068.ArticlePubMedPMC
- 26. Roth T. Insomnia: definition, prevalence, etiology, and consequences. J Clin Sleep Med 2007;3(5):Suppl. S7–10. 17824495.ArticlePubMedPMCPDF
- 27. Vreeburg SA, Hoogendijk WJ, van Pelt J, Derijk RH, Verhagen JC, van Dyck R, et al. Major depressive disorder and hypothalamic-pituitary-adrenal axis activity: results from a large cohort study. Arch Gen Psychiatry 2009;66(6):617–626. 19487626.ArticlePubMed
- 28. Hegewald J, Schubert M, Freiberg A, Romero Starke K, Augustin F, Riedel-Heller SG, et al. Traffic noise and mental health: a systematic review and meta-analysis. Int J Environ Res Public Health 2020;17(17):6175. 32854453.ArticlePubMedPMC
- 29. Statistics Korea. Population by District, Gender. Daejeon, Korea: Statistics Korea; 2023.
- 30. Statistics Korea. Current Status of Administrative Districts. Daejeon, Korea: Statistics Korea; 2022.
- 31. Nagatani T. The physics of traffic jams. Rep Prog Phys 2002;65(9):1331–1386.Article
- 32. Statistics Korea. Commuting Population by Time Required and Means of Transportation. Daejeon, Korea: Statistics Korea; 2011.
- 33. Jun MJ, Lee J. The effects of commuter’s job and housing accessibility on commuting time in the Seoul metropolitan area. J Korean Reg Dev Assoc 2020;32(2):119–136.
- 34. Statistics Korea. Number of Businesses and Number of Employees by Size of Employees. Daejeon, Korea: Statistics Korea; 2022.
- 35. Chae S, Cho TH. Comparative analysis on the determinants of residential area selection in original residents and immigrants. J Korean Data Anal Soc 2013;15(4):2281–2296.
- 36. Kim G, Kim K, Kim J. Influence of school age population demand on apartment prices: focused on the school district in Seoul. Korean Policy Sci Rev 2016;20(4):157–171.
- 37. Roberts J, Hodgson R, Dolan P. “It’s driving her mad”: gender differences in the effects of commuting on psychological health. J Health Econ 2011;30(5):1064–1076. 21855154.ArticlePubMed
- 38. Marques A, Peralta M, Henriques-Neto D, Frasquilho D, Rubio Gouveira É, Gomez-Baya D. Active commuting and depression symptoms in adults: a systematic review. Int J Environ Res Public Health 2020;17(3):1041. 32041331.ArticlePubMedPMC
REFERENCES
REFERENCES
Figure & Data
REFERENCES
Citations
Citations to this article as recorded by 
- Effect of traffic congestion on mental health in Riyadh, Saudi Arabia
Khalid A. B. Abdulrahman, Abdullah A. AL-Mohsen, Ammar Y. AL Qahtani, Sultan H. Alkhashan, Fahad A. Giraud, Faisal S. Alquayed, Yousef A. Alanazi
Journal of Family Medicine and Primary Care.2026; 15(1): 200. CrossRef - Self-Reported Impact of Road Traffic Congestion on Persons Commuting to and From Work
Mandreker Bahall, Arvani Chaitram, Aravinda Deonarine, Arnalda Diptee, Arel Mieres, Anushka Moosay, Arianna Ramsahai, Ariana Sagam, George Legall
Cureus.2026;[Epub] CrossRef - Psychometric Design and Validation of the Urban Mobility Experiences Scale
Jaime Wenceslao Parra-Moroyoqui, Francisco Isaías Rivera-Meza, José Leonardo Jiménez-Ortiz, Omar Arodi Flores-Laguna, Guillermo Cano-Verdugo, Gener José Avilés-Rodríguez
Urban Science.2026; 10(3): 126. CrossRef - Long commuting time and mental health inequalities: Middle-income vulnerability in a 14-wave panel study
Kazuya Ogawa, Keiichi Shimatani, Kaori Endo, Norimichi Suzuki
Journal of Transport & Health.2026; 49: 102319. CrossRef - Study on the influence of commuting time on workers' health status and its mechanism
Yu Gan, Jing Zhang
Journal of Transport & Health.2025; 41: 102010. CrossRef - Association between commute time and loneliness: An analysis based on 2023 Seoul survey data
Baek-Yong Choi, Ji-Hyeon Lee, Seok-Yoon Son, Seung-Woo Ryoo, Jin-Young Min, Kyoung-Bok Min
Journal of Transport & Health.2025; 43: 102059. CrossRef - Six years of car driving experience: impact of psychological status, sleep, fatigue and quality of life in female drivers in Saudi Arabia: an online survey study
Thamir Al-khlaiwi, Dena S. Alsuhaibani, Hoor K. Aloraini, Jana I. Alhazmi, Razan A. Almohanna, Sara A. Alsheikh, Turkia A. Alsheik, Norah Alrashoud, Muhammad Iqbal
BMC Public Health.2025;[Epub] CrossRef - Association between sudden work recall and psychological health issues: a cross-sectional analysis of the 6th Korean Working Conditions Survey
Dong-Woo Kim, June-Hee Lee, In-Ho Lee, Kyung-Jae Lee
Annals of Occupational and Environmental Medicine.2025; 37: e33. CrossRef - How Does the Spatial Structure of the Furniture Industry Shape Urban Residents’ Health? Evidence from China Labor-Force Dynamics Survey and POI Data
Zigui Chen, Yuning Liu, Xiangdong Dai, Chao Chen, Zhenjun Wang, Andrew Wu
Sustainability.2025; 18(1): 345. CrossRef - Effects of Commuting Time of wage workers on Work-Family Conflict as a Living Environment Factor Using the 7th Working Environment Survey
In Ho Lee, Jeong Beom Lee
Journal of The Korean Society of Living Environmental System.2025; 32(6): 769. CrossRef
 Cite
CiteCorrelation of commute time with the risk of subjective mental health problems: 6th Korean Working Conditions Survey (KWCS)

Fig. 1 Diagram showing the process of selecting study subjects.
Fig. 1
Correlation of commute time with the risk of subjective mental health problems: 6th Korean Working Conditions Survey (KWCS)
| Characteristics | Total | Commute time (minutes) | |||||
|---|---|---|---|---|---|---|---|
| Group 1 (≤ 30 minutes) (n = 20,778) | Group 2 (30–60 minutes) (n = 12,645) | Group 3 (60–120 minutes) (n = 3,749) | Group 4 (> 120 minutes) (n = 586) | ||||
| Sex | < 0.001 | ||||||
| Male | 17,871 (47.33) | 8,956 (50.11) | 6,326 (35.40) | 2,219 (12.42) | 370 (2.07) | ||
| Female | 19,887 (52.67) | 11,822 (59.45) | 6,319 (31.77) | 1,530 (7.69) | 216 (1.09) | ||
| Age (years) | < 0.001 | ||||||
| 20–29 | 3,590 (9.51) | 1,834 (51.09) | 1,289 (35.91) | 403 (11.23) | 64 (1.78) | ||
| 30–39 | 7,191 (19.04) | 3,259 (45.32) | 2,782 (38.69) | 997 (13.86) | 153 (2.13) | ||
| 40–49 | 8,958 (23.72) | 4,349 (48.55) | 3,346 (37.35) | 1,078 (12.03) | 185 (2.07) | ||
| 50–59 | 9,837 (26.05) | 5,576 (55.68) | 3,277 (33.31) | 855 (8.69) | 129 (1.31) | ||
| ≥ 60 | 8,182 (21.67) | 5,760 (70.40) | 1,951 (23.85) | 416 (5.08) | 55 (0.67) | ||
| Household monthly incomea (KRW) | < 0.001 | ||||||
| < 2,000,000 | 10,410 (27.57) | 7,147 (68.66) | 2,634 (25.30) | 556 (5.34) | 73 (0.70) | ||
| 2,000,000–3,000,000 | 12,591 (33.35) | 6,841 (54.33) | 4,364 (34.66) | 1,217 (9.67) | 169 (1.34) | ||
| 3,000,000–4,000,000 | 8,386 (22.21) | 4,114 (49.06) | 3,125 (37.26) | 989 (11.79) | 158 (1.88) | ||
| ≥ 4,000,000 | 6,371 (16.87) | 2,676 (42.00) | 2,522 (39.59) | 987 (15.49) | 186 (2.92) | ||
| Occupational classification | < 0.001 | ||||||
| White collar workers | 13,978 (37.02) | 5,724 (40.95) | 5,628 (40.26) | 2,217 (15.86) | 409 (2.93) | ||
| Pink collar workers | 11,479 (30.40) | 7,483 (65.19) | 3,311 (28.84) | 616 (5.37) | 69 (0.60) | ||
| Blue collar workers | 12,301 (32.58) | 7,571 (61.55) | 3,706 (30.13) | 916 (7.45) | 108 (0.88) | ||
| Company size | < 0.001 | ||||||
| < 50 workers | 29,214 (77.37) | 17,591 (60.21) | 9,047 (30.97) | 2,275 (7.79) | 301 (1.03) | ||
| 50–300 workers | 4,468 (11.83) | 1,754 (39.26) | 1,869 (41.83) | 717 (16.05) | 128 (2.86) | ||
| ≥ 300 workers | 4,076 (10.80) | 1,433 (35.16) | 1,729 (42.42) | 757 (18.57) | 157 (3.85) | ||
| Weekly working hours (hours) | 43.13 ± 11.87 | 43.48 ± 13.32 | 42.91 ± 10.11 | 42.17 ± 9.05 | 41.70 ± 7.08 | < 0.001 | |
| Shift work status | < 0.001 | ||||||
| Yes | 2,447 (6.48) | 1,344 (50.39) | 894 (35.88) | 183 (11.73) | 26 (2.00) | ||
| No | 35,311 (93.52) | 19,434 (61.54) | 11,751 (30.13) | 3,566 (7.40) | 560 (0.92) | ||
| Characteristics | Total | Non-depression (n = 25,395) | Depression (n = 12,363) | Non-anxiety (n = 35,623) | Anxiety (n = 2,135) | Non-fatigue (n = 27,776) | Fatigue (n = 9,982) | ||||
|---|---|---|---|---|---|---|---|---|---|---|---|
| Sex | 0.052 | 0.798 | < 0.001 | ||||||||
| Male | 17,871 (47.33) | 11,973 (67.00) | 5,898 (33.00) | 16,893 (94.53) | 978 (5.47) | 13,420 (75.09) | 4,451 (24.91) | ||||
| Female | 19,887 (52.67) | 13,422 (67.49) | 6,465 (32.51) | 18,730 (94.18) | 1,157 (5.82) | 14,356 (72.19) | 5,531 (27.81) | ||||
| Age (years) | < 0.001 | < 0.001 | < 0.001 | ||||||||
| 20–29 | 3,590 (9.51) | 2,705 (75.35) | 885 (24.65) | 3,447 (96.02) | 143 (3.98) | 3,010 (83.84) | 580 (16.16) | ||||
| 30–39 | 7,191 (19.04) | 5,176 (71.98) | 2,015 (28.02) | 6,773 (94.19) | 418 (5.81) | 5,663 (78.75) | 1,528 (21.25) | ||||
| 40–49 | 8,958 (23.72) | 6,265 (69.94) | 2,693 (30.06) | 8,422 (94.02) | 536 (5.98) | 6,640 (74.12) | 2,318 (25.88) | ||||
| 50–59 | 9,837 (26.05) | 6,561 (66.70) | 3,276 (33.30) | 9,264 (94.18) | 573 (5.82) | 6,979 (70.95) | 2,858 (29.05) | ||||
| ≥ 60 | 8,182 (21.67) | 4,688 (57.30) | 3,494 (42.70) | 7,717 (94.32) | 465 (5.68) | 5,484 (67.03) | 2,698 (32.97) | ||||
| Household monthly incomea (KRW) | < 0.001 | 0.322 | < 0.001 | ||||||||
| < 2,000,000 | 10,410 (27.57) | 6,184 (59.40) | 4,226 (40.60) | 9,824 (94.37) | 586 (5.63) | 7,469 (71.75) | 2,941 (28.25) | ||||
| 2,000,000–3,000,000 | 12,591 (33.35) | 8,661 (68.79) | 3,930 (31.21) | 11,903 (94.54) | 688 (5.46) | 9,373 (74.44) | 3,218 (25.56) | ||||
| 3,000,000–4,000,000 | 8,386 (22.21) | 5,927 (70.68) | 2,459 (29.32) | 7,915 (94.38) | 471 (5.62) | 6,181 (73.71) | 2,205 (26.29) | ||||
| ≥ 4,000,000 | 6,371 (16.87) | 4,623 (72.56) | 1,748 (27.44) | 5,981 (93.88) | 390 (6.12) | 4,753 (74.60) | 1,618 (25.40) | ||||
| Occupational classification | < 0.001 | 0.064 | < 0.001 | ||||||||
| White collar workers | 13,978 (37.02) | 10,247 (73.31) | 3,731 (26.69) | 13,137 (93.98) | 841 (6.02) | 11,013 (78.79) | 2,965 (21.21) | ||||
| Pink collar workers | 11,479 (30.40) | 7,761 (67.61) | 3,718 (32.39) | 10,851 (94.53) | 628 (5.47) | 8,400 (73.18) | 3,079 (26.82) | ||||
| Blue collar workers | 12,301 (32.58) | 7,387 (60.05) | 4,914 (39.95) | 11,635 (94.59) | 666 (5.41) | 8,363 (67.99) | 3,938 (32.01) | ||||
| Company size | < 0.001 | < 0.001 | 0.002 | ||||||||
| < 50 workers | 29,214 (77.37) | 19,253 (65.90) | 9,961 (34.10) | 27,647 (94.64) | 1,567 (5.36) | 21,369 (73.15) | 7,845 (26.85) | ||||
| 50–300 workers | 4,468 (11.83) | 3,137 (70.21) | 1,331 (29.79) | 4,201 (94.02) | 267 (5.98) | 3,365 (75.31) | 1,103 (24.69) | ||||
| ≥ 300 workers | 4,076 (10.80) | 3,005 (73.72) | 1,071 (26.28) | 3,775 (92.62) | 301 (7.38) | 3,042 (74.63) | 1,034 (25.37) | ||||
| Weekly working hours (hours) | 43.13 ± 11.87 | 42.80 ± 11.16 | 43.81 ± 13.19 | < 0.001 | 43.06 ± 11.83 | 44.34 ± 12.41 | < 0.001 | 42.55 ± 11.37 | 44.74 ± 13.02 | < 0.001 | |
| Shift work status | 0.004 | 0.010 | < 0.001 | ||||||||
| Yes | 2,447 (6.48) | 1,620 (66.20) | 827 (33.80) | 2,280 (93.18) | 167 (6.82) | 1,712 (69.96) | 735 (30.04) | ||||
| No | 35,311 (93.52) | 23,775 (67.33) | 11,536 (32.67) | 33,343 (94.43) | 1,968 (5.57) | 26,064 (73.81) | 9,247 (26.19) | ||||
| Commute time (minutes) | Overall (n = 37,758) | Male (n = 17,871) | Female (n = 19,887) | ||||
|---|---|---|---|---|---|---|---|
| Unadjusted | Multivariate adjusted | Unadjusted | Multivariate adjusted | Unadjusted | Multivariate adjusted | ||
| Depression | |||||||
| Group 1 (≤ 30 minutes) | 1 (Reference) | 1 (Reference) | 1 (Reference) | 1 (Reference) | 1 (Reference) | 1 (Reference) | |
| Group 2 (30–60 minutes) | 0.90 (0.86–0.94) | 1.06 (1.01–1.11) | 0.87 (0.82–0.94) | 1.02 (0.95–1.10) | 0.92 (0.86–0.98) | 1.08 (1.01–1.16) | |
| Group 3 (60–120 minutes) | 0.95 (0.88–1.02) | 1.23 (1.13–1.33) | 0.86 (0.78–0.95) | 1.10 (0.99–1.22) | 1.07 (0.96–1.20) | 1.39 (1.23–1.56) | |
| Group 4 (> 120 minutes) | 0.95 (0.88–1.02) | 1.31 (1.09–1.57) | 0.85 (0.68–1.07) | 1.17 (0.93–1.48) | 1.10 (0.83–1.46) | 1.48 (1.11–1.97) | |
| 0.003 | < 0.001 | < 0.001 | 0.045 | 0.799 | < 0.001 | ||
| Anxiety | |||||||
| Group 1 (≤ 30 minutes) | 1 (Reference) | 1 (Reference) | 1 (Reference) | 1 (Reference) | 1 (Reference) | 1 (Reference) | |
| Group 2 (30–60 minutes) | 1.16 (1.06–1.28) | 1.17 (1.06–1.29) | 1.09 (0.95–1.26) | 1.12 (0.97–1.30) | 1.24 (1.09–1.41) | 1.21 (1.05–1.38) | |
| Group 3 (60–120 minutes) | 1.42 (1.24–1.63) | 1.43 (1.23–1.65) | 1.32 (1.09–1.60) | 1.35 (1.11–1.66) | 1.57 (1.28–1.93) | 1.49 (1.21–1.84) | |
| Group 4 (> 120 minutes) | 1.92 (1.44–2.55) | 1.89 (1.42–2.53) | 1.72 (1.17–2.51) | 1.72 (1.17–2.53) | 2.29 (1.49–3.53) | 2.09 (1.34–3.26) | |
| < 0.001 | < 0.001 | < 0.001 | < 0.001 | < 0.001 | < 0.001 | ||
| Fatigue | |||||||
| Group 1 (≤ 30 minutes) | 1 (Reference) | 1 (Reference) | 1 (Reference) | 1 (Reference) | 1 (Reference) | 1 (Reference) | |
| Group 2 (30–60 minutes) | 0.96 (0.92–1.01) | 1.09 (1.04–1.15) | 1.00 (0.93–1.08) | 1.09 (1.01–1.18) | 0.95 (0.89–1.02) | 1.08 (1.01–1.16) | |
| Group 3 (60–120 minutes) | 1.05 (0.97–1.13) | 1.32 (1.21–1.43) | 1.06 (0.95–1.18) | 1.25 (1.12–1.40) | 1.10 (0.98–1.24) | 1.38 (1.22–1.56) | |
| Group 4 (> 120 minutes) | 1.14 (0.95–1.37) | 1.51 (1.25–1.82) | 1.10 (0.87–1.39) | 1.36 (1.06–1.73) | 1.32 (0.99–1.75) | 1.70 (1.27–2.30) | |
| 0.446 | < 0.001 | 0.285 | < 0.001 | 0.310 | < 0.001 | ||
Table 1 Comparison of baseline characteristics among groups with varying commute times (n = 37,758)
Categorical data presented as number (%); continuous data presented as mean ± standard deviation.
KRW = Korean won.
a2 million KRW = 1,559 US dollars, 3 million KRW = 2,338 US dollars, 4 million KRW = 3,118 US dollars.
Table 2 Comparison of baseline characteristics between individuals with non-mental health problem and mental health problem (n = 37,758)
Categorical data presented as number (%); continuous data presented as mean ± standard deviation.
KRW = Korean won
a2 million KRW = 1,559 US dollars, 3 million KRW = 2,338 US dollars, 4 million KRW = 3,118 US dollars.
Table 3 Odds ratios and 95% confidence intervals of depression, anxiety, and fatigue according to commute time in both sex group
Multivariate adjusted model: adjusted for sex, age, monthly income, occupation, company size, weekly working hours, and shift work status.

