
Articles
- Page Path
- HOME > Ann Occup Environ Med > Volume 37; 2025 > Article
- Original Article Commuting time and musculoskeletal pain in the relationship with working time: a cross-sectional study
-
Hoje Ryu1,2
 , Seong-Sik Cho1,2,*, Jung Il Kim1,2,*, Sun-Haeng Choi3, Nathan Kim1
 -
Annals of Occupational and Environmental Medicine 2025;37:e4.
DOI: https://doi.org/10.35371/aoem.2025.37.e4
Published online: February 19, 2025
1Department of Occupational and Environmental Medicine, Dong-A University Hospital, Busan, Korea
2Department of Occupational and Environmental Medicine, Dong-A University College of Medicine, Busan, Korea
3Department of Occupational and Environmental Medicine, Chungbuk National University Hospital, Cheongju, Korea
- *Corresponding author: Seong-Sik Cho Department of Occupational and Environmental Medicine, Dong-A University College of Medicine, 32 Daesingongwon-ro, Seo-gu, Busan 49201, Korea E-mail: sscho@dau.ac.kr
- *Jung Il Kim Department of Occupational and Environmental Medicine, Dong-A University College of Medicine, 32 Daesingongwon-ro, Seo-gu, Busan 49201, Korea E-mail: kimji@dau.ac.kr
• Received: July 1, 2024 • Revised: July 30, 2024 • Accepted: August 18, 2024
© 2025 Korean Society of Occupational & Environmental Medicine
This is an Open Access article distributed under the terms of the Creative Commons Attribution Non-Commercial License (https://creativecommons.org/licenses/by-nc/4.0/) which permits unrestricted non-commercial use, distribution, and reproduction in any medium, provided the original work is properly cited.
Abstract
-
Background Commuting is essential for working life; however, prolonged travel times can negatively affect health, particularly musculoskeletal pain. This study aims to examine the relationship between commuting time and musculoskeletal pain (back, upper extremity, and lower extremity pain), in the context of working time.
-
Methods This cross-sectional study used data from the Sixth Korean Working Conditions Survey conducted in Korea between October 2020 and April 2021. Variables such as commuting time, weekly working hours, and shift work were assessed using the survey questions. Musculoskeletal pain was determined based on self-reported pains in the previous year. The covariates included demographics, employment status, ergonomic risks, and job stress. The association between commuting time and musculoskeletal pain stratified by weekly working hours or shift work was analyzed by survey-weighted logistic regression analysis.
-
Results This study found a significant association between longer commuting times and increased prevalence of musculoskeletal pain, particularly back, upper extremity, and lower extremity pain. When commuting time was ≤60, 61–120, >120 minutes, the odds ratio was 1.00, 1.33 (95% confidence interval [CI]: 1.16–1.52), and 2.41 (95% CI: 1.77–3.29) for back pain; 1.00, 1.29 (95% CI: 1.13–1.46), and 2.27 (95% CI: 1.71–3.00) for upper extremity pain; and 1.00, 1.24 (95% CI: 1.05–1.45), and 1.53 (95% CI: 1.13–2.08) for lower extremity pain, respectively. Furthermore, except for upper extremity pain, this trend was amplified when participants were concurrently exposed to long working hours, and for lower extremity pain, this trend was aggravated among shift workers.
-
Conclusions Long commuting time may be a risk factor for musculoskeletal pain, and its’ effects could be aggravated when combined with long working hours or shift work. This study observed the detrimental impact of prolonged commuting on musculoskeletal health, particularly among employees with extended working hours or shift work.
BACKGROUND
For many individuals, commuting is an integral part of their daily routines, representing a significant portion of their waking hours and exerting a significant impact on their well-being. Prolonged commuting times have been associated with increased stress levels, potentially exacerbating conditions, such as depression and anxiety.1-3 In addition, prolonged periods of standing or sitting while commuting, under cramped or uncomfortable conditions, can contribute to poor posture and musculoskeletal discomfort.4 Moreover, long commuting time often translates to reduced time for familial engagements and personal activities, thereby disrupting work-life balance and overall quality of life.5-7 Such commuting-related stress and discomfort can extend into the work environment and lead to reduced productivity, low job satisfaction, and increased absenteeism.8-10
Concurrently, prolonged working hours pose significant health risks, such as fatigue, obesity, and cardiovascular disease, while also contributing to mental health issues such as stress, depression, and sleep disturbances.11-13 Individuals working long hours often have limited time and opportunities for physical activity, which is crucial for maintaining musculoskeletal health.14 Reduced physical activity can lead to weakened muscles, a lack of flexibility, and increased susceptibility to musculoskeletal disorders.15,16 Moreover, disruption of circadian rhythms induced by shift work can lead to sleep disturbances and increased inflammation, further exacerbating chronic pain.17,18 Such disruptions in circadian rhythms are also associated with impaired alertness and concentration, which can increase the risk of workplace accidents and injuries.19-22
Musculoskeletal pain is a prevalent health issue and a significant public health concern.23 Occupationally related risk factors include prolonged sitting, repetitive movements, awkward postures, and heavy physical workload.24,25 In addition, psychosocial factors such as job strain and dissatisfaction can also contribute to musculoskeletal pain.26,27 The implications of musculoskeletal pain in the working population are significant. In addition to discomfort and reduced quality of life, musculoskeletal pain can lead to absenteeism, reduced productivity, and increased healthcare costs.28-30 For workers, this may result in decreased job satisfaction, impaired job performance, and restricted engagement in physical and recreational activities.31-33
Daily commuting, a common ritual for millions of working individuals, presents a dichotomous scenario. Although it facilitates access to employment and opportunities, prolonged commuting times have raised concerns about the associated potential adverse health effects. Therefore, this study focuses on a particular aspect of health, that is, musculoskeletal pain (including back pain, upper extremity pain, and lower extremity pain), and explores its relationship with daily commuting time in the context of weekly working hours and shift work. We hypothesized that longer commuting times are associated with a higher prevalence of musculoskeletal pain and that this association would be more pronounced in populations with longer weekly working hours or those engaged in shift work. This study aimed to provide valuable insights into the potential health risks associated with extended commuting in the context of working hours and shift work by examining these factors.
METHODS
In this secondary cross-sectional study, we obtained data from the Sixth Korean Working Conditions Survey (KWCS) conducted by the Institute of Occupational Safety and Health Research of the Korea Occupational Safety and Health Agency. The survey was conducted between October 2020 and April 2021 in 17 cities and metropolitan areas in Korea, targeting economically active individuals aged ≥15 years. The KWCS benchmarks the European Working Conditions Survey (EWCS), ensuring comparability between their items. The contents of the survey included sociodemographic factors, general working conditions such as various occupational exposures, and the health status of the participants, including self-rated health and sleep disturbances. The survey weight of the present study was determined based on sample design, non-response rates, and post-stratification weights.
The total sample size for the sixth KWCS was 50,538. This study included only paid employees; therefore, non-paid family workers (n=1,749), self-employed with employees (n=2,444), and self-employed without employees (n=7,827) were excluded. In addition, we excluded individuals who worked fewer than 35 hours per week (n=6,074), to include only those with sufficient working hours. For each survey item, there were respondents who answered “don’t know/no opinion” or “refused.” Therefore, they were excluded from the analysis. Finally, the population size for the analysis was 28,496 for back pain, 28,490 for upper extremity pain, and 28,487 for lower extremity pain in the fully adjusted model (Model 2).
Estimates of commuting time were calculated from responses to the question “In total, how many min per day do you usually spend traveling from home to work and back?” Subsequently, the participants were classified into three groups: ≤60 minutes, 61–120 minutes, and >120 minutes. The question “How many hours do you actually work at your workplace in a week or a month?” was used to calculate weekly working hours by adding responses for the main and other (side) jobs. Working hours were categorized into three groups: 35–40 hours, 41–52 hours, and >52 hours per week. Shift work was evaluated using the question “Do you work shifts?” The respondents who replied “yes” were assigned to shift workers, whereas those who replied “no” were assigned to non-shift workers.
Musculoskeletal pain was assessed using the question, “Over the last 12 months, did you have any of the following health problems?” The items of health problems were presented as “Backache” for back pain, “Muscular pains in shoulders, neck and/or upper limbs (arms, elbows, wrists, hands, etc.)” for upper extremity pain, and “Muscular pains in lower limbs (hips, legs, knees, feet, etc.)” for lower extremity pain. Those who responded “yes” were considered to have musculoskeletal pain, whereas those who responded “no” were considered to have no musculoskeletal pain.
Ergonomic factors were evaluated using the question, “Please tell me, using the same scale, does your main paid job involve?” “Tiring or painful positions (except standing or sitting)” was for awkward postures, “carrying or moving heavy loads” was for heavy physical workload, “standing” was for prolonged standing, and “repetitive hand or arm movements” was for repetitive movements. Responses of “all of the time,” “almost all of the time,” “around 3/4 of the time,” “around half of the time,” or “around 1/4 of the time” were regarded as exposed to ergonomic factors, whereas “almost never” or “never” were regarded as not exposed to ergonomic factors.
We included the following variables as covariates in our study: sex, age, education level, monthly income, employment status, occupation, ergonomic factors (awkward postures, heavy physical workload, prolonged standing, repetitive movements), and job stress (low job control, effort-reward imbalance, and organizational injustice). Age was categorized into five groups: 15–29, 30–39, 40–49, 50–59, and ≥60 years. Education level was classified into three groups: middle school or lower, high school, and college or higher. Income was divided into four quartiles according to the participants' net monthly earnings: lowest, low-middle, high-middle, and highest. Employment status was categorized as regular, temporary, or daily. “Low job control was assessed using the question,” “Can you influence decisions that are important for your work?” Responses of “rarely” or “never” were considered as “yes,” whereas responses of “always” or “most of the time” or “sometimes” were considered as “no.” Effort-reward imbalance was estimated by the question, “Considering all your efforts and achievements in your job, do you feel that you get paid appropriately?” Responses of “tend to disagree” or “strongly disagree” were regarded as “effort-reward imbalance,” whereas responses of “strongly agree,” “tend to agree,” or “neither agree nor disagree” were considered as “no effort–reward imbalance.” Organizational injustice was evaluated using the question, “Are you treated fairly at your workplace?” Responses of “rarely” or “never” were treated as “yes,” whereas responses of “always” or “most of the time” or “sometimes” were considered as “no.”
The distributions of the sociodemographic and occupational variables in the population are presented as numbers and percentages according to commuting time. The prevalence of back pain, upper extremity pain, and lower extremity pain according to commuting time was calculated. Participants were stratified according to weekly working hours and shift work, and the prevalence of back, upper extremity, and lower extremity pain was assessed by commuting time in the stratum of weekly working hours and shift work. The association between commuting time and back, upper extremity, and lower extremity pain stratified by working hours and shift work was analyzed using multiple logistic regression analysis. Odds ratios (ORs) and 95% confidence intervals (CIs) were calculated to assess associations. Age, sex, education, income, occupation, and employment status were adjusted for in Model 1, and working hours, shift work, awkward postures, heavy physical workload, prolonged standing, repetitive movements, effort-reward imbalance, low job control, organizational injustice were additionally adjusted for in Model 2. All statistical analyses were performed using Stata version 18.0 (Stata Corp., College Station, TX, USA).
The datasets generated and/or analyzed during the current study are available in the Occupational Safety and Health Research Institute (OSHRI) repository, https://www.kosha.or.kr/oshri/researchField/downWorkingEnvironmentSurvey.do.
This study used publicly available data from the KWCS and was approved by the Institutional Review Board of Dong-A (approval no. 2-1040709-AB-N-01-202402-HR-008-02).
RESULTS
Table 1 presents the distribution of the study population characteristics according to the daily commute time. The proportion of men (61.2%) was higher than that of women (38.8%). Regarding age, the largest proportion was observed in the 40–49 years age group (26.5%), whereas the smallest proportion was observed in the ≥60 years age group (9.6%). The group with college or higher education accounted for the largest proportion (64.7%). In terms of employment status, most of the workers belonged to the regular employment group (89.2%). The proportion of the occupational group was largest in the manual group (33.1%) and smallest in the sales and service group (14.6%). In terms of long commutes (>2 hours), the proportion was higher in men (3.6%) than in women (2.5%). Regarding age, the largest proportion was observed in the 40–49 years age group (3.7%), and the smallest in the ≥60 years age group (2.0%). Regarding education, long commuters accounted for the largest proportion among those with college or higher education (3.9%) and the smallest proportion in the high school group (1.9%). As the income group increased, commuting time increased. Regarding employment status, the proportion of long commutes was higher in the regular (3.3%) and daily (3.3%) groups than in the temporary group (2.2%). Participants in professional and managerial occupations accounted for the largest proportion of long commutes (5.4%), whereas those in sales and service occupations accounted for the smallest proportion (1.4%). The shorter the weekly working hours, the greater the proportion of long commuting times. Additionally, the proportion of long commuting times was greater among non-shift workers (3.4%) than among shift workers (1.5%).
Table 2 shows the prevalence of back, upper extremity, and lower extremity pain according to commuting time, stratified by weekly working hours or shift work. In terms of daily commuting time, the prevalence of back and upper extremity pain increased as commuting time increased, whereas lower extremity pain showed no significant difference. When stratified by weekly working hours, the prevalence of back and upper extremity pain was the highest when weekly working hours exceeded 52 hours and commuting time exceeded 2 hours: 46.4% for back pain and 46.6% for upper extremity pain. The prevalence of lower extremity pain was highest when weekly working hours exceeded 52 hours and commuting time was 61–120 minutes (26.0%). When stratified by shift work, the prevalence of all types of musculoskeletal pain was highest among individuals who engaged in shift work with commuting times exceeding 2 hours: 43.2% for back pain, 40.7% for upper extremity pain, and 40.3% for lower extremity pain.
Table 3 and Fig. 1 demonstrate the association between daily commuting time and back pain, upper extremity pain, and lower extremity pain, stratified by weekly working hours or shift work. For all types of musculoskeletal pain, the likelihood of experiencing those symptoms increased as commuting time increased; the OR was 1.00, 1.33 (95% CI: 1.16–1.52), and 2.41 (95% CI: 1.77–3.29) for back pain; 1.00, 1.29 (95% CI: 1.13–1.46), and 2.27 (95% CI: 1.71–3.00) for upper extremity pain; and 1.00, 1.24 (95% CI: 1.05–1.45), and 1.53 (95% CI: 1.13–2.08) for lower extremity pain. In addition, when stratified by weekly working hours, the OR tended to increase as commuting time increased in all strata, except for upper extremity pain. On the shift work table, for lower extremity pain, the OR was highest when exposed to shift work and long commuting time (>2 hours) simultaneously. However, for back pain and upper extremity pain, the OR was highest in the stratum with no shift work and commuting time exceeding 2 hours. Although the OR was high for simultaneous exposure to long commuting times and long working hours or shift work, the results need to be interpreted with caution because the sample sizes for some strata were too small, and the CIs were therefore wide.
The supplementary tables show stratified analysis for the control of ergonomic risks. Supplementary Tables 1 and 2 present the prevalence of back pain according to awkward postures and heavy physical workload by daily commuting time stratified by weekly working hours or shift work. Supplementary Tables 3–5 demonstrate the prevalence of upper extremity pain according to awkward postures, heavy physical workload, and repetitive movements by daily commuting time stratified by weekly working hours or shift work. Supplementary Tables 6 and 7 show the prevalence of lower extremity pain according to awkward postures and prolonged standing by daily commuting time stratified by weekly working hours or shift work.
DISCUSSION
This study examined the relationship between commuting time and musculoskeletal pain (back, upper extremity, and lower extremity pain), with particular emphasis on co-exposure to long working hours and shift work. A consistent trend of increased OR was seen for all types of musculoskeletal pain as commuting time increased. Even when ergonomic factors were adjusted in the analysis, the trend did not change. The OR for back and lower extremity pain was the highest when commuting time exceeded 2 hours and weekly work hours exceeded 40 hours. In addition, when stratified by shift work, the OR for lower extremity pain was highest when simultaneously exposed to shift work and long commuting time (>2 hours).
Several mechanisms may explain these findings. Maintaining a static posture during commuting can cause musculoskeletal pain, and this physical burden can further increase with longer commuting times.34 Long commuting times indicate less time for sleep and recovery. Workers with long commutes have fewer opportunities for muscle and joint healing, which may increase the prevalence of musculoskeletal pain.35 In addition, psychosocial stressors associated with extended commuting, such as traffic congestion and time pressure, can contribute to the development or exacerbation of musculoskeletal pain.36
Prolonged static posture or overuse of muscles and joints owing to long working hours can contribute to an increased risk of musculoskeletal injury.37 Similar to long commute times, long working hours deprive workers of the time to rest and sleep, hindering injury recovery.38 Shift work can exacerbate inflammation by increasing the C-reactive protein levels, which may increase the risk of musculoskeletal pain.18 Moreover, shift work-induced circadian rhythm disruption may exacerbate sleep disturbances, further impeding recovery and increasing susceptibility to musculoskeletal pain.39,40 Consequently, owing to these pathways, co-exposure to long commuting times, long working hours, or shift work can amplify the detrimental effects of long commuting times on musculoskeletal pain.
Our results are consistent with those of previous studies. A previous study investigated the association between daily commutes and subjective health complaints among 628 full-time bank employees in Dhaka.41 In a previous study, musculoskeletal pain was investigated using seven items: headache, migraine, neck pain, lower back pain, upper back pain, arm pain, shoulder pain, and leg pain. The OR for musculoskeletal pain significantly increased when the average commute time exceeded 30 minutes. However, the participants in this previous study comprised only office workers, and the impact of simultaneous exposure to weekly working hours or shift work was not considered. Another study investigated the relationship between commuting time and work-related lows by using data from the sixth KWCS.42 The results of this previous study showed that the OR significantly increased when the commuting time was more than 40 minutes, and if a worker was participating in sports and leisure activities, the OR increased significantly when the commuting time was more than 60 minutes. However, this previous study only evaluated work-related lower back pain among patients with musculoskeletal pain and did not consider the effects of weekly working hours or shift work.
In our study, we used data from a sample representing the working population of South Korea, enabling a stratified analysis with sufficient statistical power. However, our study has several limitations. First, as all assessments of commuting time, working hours, shift work, and musculoskeletal pain were based on the participants’ subjective responses, a potential information bias may be introduced. Second, the mode of commuting may also affect workers’ health, but information about the modes of commuting was not assessed; thus, the influence of the commuting mode was not analyzed. However, regardless of commuting mode, long commuting time may be an ergonomic burden, such as long standing and sitting, or awkward postures owing to cramped space. Third, other risk factors of musculoskeletal disorders according to occupational characteristics and types of shift work were not considered. These factors may provide an additional explanation for why the OR for upper extremity pain was highest in workers who work less than 40 hours per week and commuting time exceeded 2 hours, and the OR for back pain and upper extremity pain was highest among non-shift workers. Finally, as this was a cross-sectional study, the relationships between exposure prior to health outcomes could not be established.
CONCLUSIONS
Long commuting time may be a risk factor for musculoskeletal pain, which could be further exacerbated by long working hours and shift work. These findings suggest that commuting time should be considered an important factor in health management, especially for those who work long hours or shifts. In future research, longitudinal studies using objective measures are needed.
Abbreviations
CI
confidence interval
EWCS
European Working Conditions Survey
KWCS
Korean Working Conditions Survey
OR
odds ratio
OSHRI
Occupational Safety and Health Research Institute
-
Funding
This study is supported by Dong-A University research fund.
-
Competing interests
The authors declare that they have no competing interests.
-
Author contributions
Conceptualization: Ryu H, Cho SS, Kim JI. Formal analysis: Ryu H, Cho SS. Funding acquisition: Cho SS. Methodology: Ryu H, Cho SS. Writing - original draft: Ryu H. Cho SS. Writing - review & editing: Cho SS, Kim JI, Choi SH, Kim N.
-
Acknowledgments
The authors would like to thank the Occupational Safety and Health Research Institute (OSHRI) and the Korea Occupational Safety and Health Agency (KOSHA) for providing us with raw data from the Sixth Korean Working Conditions Survey (KWCS).
NOTES
SUPPLEMENTARY MATERIAL
Supplementary Table 1.
Prevalence of back pain according to daily commuting time with/without awkward postures (including stratified analysis by weekly working hours and shift work)
Supplementary Table 2.
Prevalence of back pain according to daily commuting time with/without heavy physical workload (including stratified analysis by weekly working hours and shift work)
Supplementary Table 3.
Prevalence of upper extremity pain according to daily commuting time with/without awkward postures (including stratified analysis by weekly working hours and shift work)
Supplementary Table 4.
Prevalence of upper extremity pain according to daily commuting time with/without heavy physical workload (including stratified analysis by weekly working hours and shift work)
Supplementary Table 5.
Prevalence of upper extremity pain according to daily commuting time with/without repetitive movements (including stratified analysis by weekly working hours and shift work)
Supplementary Table 6.
Prevalence of lower extremity pain according to daily commuting time with/without awkward postures (including stratified analysis by weekly working hours and shift work)
Supplementary Table 7.
Prevalence of lower extremity pain according to daily commuting time with/without prolonged standing (including stratified analysis by weekly working hours and shift work)
Fig. 1.

Association between daily commuting time and musculoskeletal pain stratified by weekly working hours or shift work. (A) Association between daily commuting time and back pain according to weekly working hours. (B) Association between daily commuting time and back pain according to shift work. (C) Association between daily commuting time and upper extremity pain according to weekly working hours. (D) Association between daily commuting time and upper extremity pain according to shift work. (E) Association between daily commuting time and lower extremity pain according to weekly working hours. (F) Association between daily commuting time and lower extremity pain according to shift work.
Table 1.
Characteristics of the study participants according to daily commuting time
Table 2.
The prevalence of back pain, upper extremity pain, and lower extremity pain by daily commuting time, weekly working hours, and shift work (including stratified analysis by weekly working hours and shift work)
Table 3.
Musculoskeletal pains and their association with daily commuting time, weekly working hours, and shift work by logistic regression analysis (including stratified analysis by weekly working hours and shift work)
|
Odds ratio (95% confidence interval) |
|||||||||
|---|---|---|---|---|---|---|---|---|---|
|
Back pain |
Upper extremity pain |
Lower extremity pain |
|||||||
| Unadjusted | Model 1a | Model 2b | Unadjusted | Model 1a | Model 2b | Unadjusted | Model 1a | Model 2b | |
| Daily commuting time (minutes) | |||||||||
| ≤60 | 1.00 | 1.00 | 1.00 | 1.00 | 1.00 | 1.00 | 1.00 | 1.00 | 1.00 |
| 61–120 | 1.17 (1.04–1.32) | 1.33 (1.17–1.51) | 1.33 (1.16–1.52) | 1.07 (0.96–1.20) | 1.29 (1.14–1.46) | 1.29 (1.13–1.46) | 1.02 (0.88–1.18) | 1.23 (1.05–1.44) | 1.24 (1.05–1.45) |
| >120 | 1.74 (1.34–2.26) | 2.24 (1.67–3.00) | 2.41 (1.77–3.29) | 1.50 (1.17–1.92) | 2.07 (1.57–2.72) | 2.27 (1.71–3.00) | 1.00 (0.76–1.31) | 1.30 (0.98–1.73) | 1.53 (1.13–2.08) |
| Weekly working hours | |||||||||
| 35–40 | 1.00 | 1.00 | 1.00 | 1.00 | 1.00 | 1.00 | 1.00 | 1.00 | 1.00 |
| 41–52 | 1.48 (1.35–1.63) | 1.41 (1.27–1.56) | 1.36 (1.23–1.52) | 1.31 (1.19–1.43) | 1.23 (1.12–1.36) | 1.19 (1.08–1.32) | 1.45 (1.29–1.63) | 1.32 (1.17–1.49) | 1.26 (1.11–1.43) |
| >52 | 1.89 (1.64–2.17) | 1.50 (1.29–1.76) | 1.44 (1.24–1.69) | 1.90 (1.66–2.17) | 1.58 (1.37–1.82) | 1.54 (1.33–1.78) | 2.12 (1.81–2.49) | 1.69 (1.41–2.02) | 1.65 (1.38–1.97) |
| Shift work | |||||||||
| (–) | 1.00 | 1.00 | 1.00 | 1.00 | 1.00 | 1.00 | 1.00 | 1.00 | 1.00 |
| (+) | 1.34 (1.17–1.52) | 1.18 (1.02–1.36) | 1.2 (1.04–1.39) | 1.24 (1.10–1.41) | 1.06 (0.92–1.22) | 1.09 (0.95–1.25) | 1.62 (1.39–1.90) | 1.36 (1.14–1.63) | 1.39 (1.17–1.66) |
| Weekly working hours | |||||||||
| 35–40 hours | |||||||||
| Commuting time (minutes) | |||||||||
| ≤60 | 1.00 | 1.00 | 1.00 | 1.00 | 1.00 | 1.00 | 1.00 | 1.00 | 1.00 |
| 61–120 | 1.12 (0.96–1.29) | 1.3 (1.11–1.52) | 1.32 (1.13–1.55) | 1.04 (0.91–1.19) | 1.27 (1.10–1.47) | 1.29 (1.11–1.51) | 0.99 (0.82–1.18) | 1.23 (1.01–1.49) | 1.27 (1.04–1.54) |
| >120 | 1.90 (1.37–2.64) | 2.43 (1.68–3.49) | 2.55 (1.75–3.71) | 1.72 (1.28–2.32) | 2.36 (1.70–3.27) | 2.52 (1.82–3.48) | 1.13 (0.81–1.57) | 1.42 (1.00–2.01) | 1.63 (1.12–2.36) |
| 41–52 hours | |||||||||
| Commuting time (minutes) | |||||||||
| ≤60 | 1.45 (1.31–1.61) | 1.44 (1.29–1.60) | 1.37 (1.22–1.53) | 1.30 (1.18–1.44) | 1.25 (1.13–1.39) | 1.20 (1.08–1.34) | 1.45 (1.28–1.64) | 1.37 (1.20–1.56) | 1.29 (1.12–1.47) |
| 61–120 | 2.02 (1.61–2.54) | 2.07 (1.61–2.67) | 1.87 (1.43–2.45) | 1.60 (1.28–2.01) | 1.75 (1.37–2.23) | 1.60 (1.23–2.09) | 1.58 (1.17–2.14) | 1.69 (1.22–2.33) | 1.50 (1.08–2.09) |
| >120 | 2.43 (1.54–3.82) | 2.85 (1.73–4.69) | 2.83 (1.70–4.70) | 1.52 (0.97–2.39) | 1.89 (1.14–3.12) | 2.04 (1.19–3.50) | 1.21 (0.71–2.05) | 1.50 (0.86–2.61) | 1.73 (1.01–2.97) |
| > 52 hours | |||||||||
| Commuting time (minutes) | |||||||||
| ≤60 | 1.85 (1.59–2.16) | 1.65 (1.41–1.94) | 1.46 (1.24–1.73) | 1.84 (1.60–2.12) | 1.68 (1.45–1.96) | 1.60 (1.37–1.86) | 2.05 (1.71–2.44) | 1.81 (1.49–2.19) | 1.66 (1.37–2.01) |
| 61–120 | 2.37 (1.67–3.36) | 2.21 (1.51–3.24) | 1.85 (1.25–2.73) | 2.13 (1.52–3.00) | 1.99 (1.38–2.86) | 1.73 (1.20–2.51) | 2.67 (1.82–3.91) | 2.40 (1.58–3.66) | 2.08 (1.35–3.21) |
| >120 | 3.39 (1.38–8.32) | 3.25 (1.14–9.26) | 2.79 (0.88–8.87) | 2.56 (1.05–6.27) | 2.54 (0.92–7.01) | 2.17 (0.75–6.26) | 2.65 (1.01–6.96) | 2.51 (0.88–7.18) | 2.08 (0.67–6.46) |
| Shift work | |||||||||
| (–) | |||||||||
| Commuting time (minutes) | |||||||||
| ≤60 | 1.00 | 1.00 | 1.00 | 1.00 | 1.00 | 1.00 | 1.00 | 1.00 | 1.00 |
| 61–120 | 1.16 (1.03–1.32) | 1.32 (1.16–1.50) | 1.31 (1.15–1.51) | 1.06 (0.94–1.19) | 1.28 (1.12–1.45) | 1.28 (1.12–1.46) | 0.99 (0.85–1.14) | 1.19 (1.02–1.40) | 1.19 (1.01–1.40) |
| >120 | 1.76 (1.34–2.31) | 2.25 (1.65–3.07) | 2.45 (1.77–3.38) | 1.52 (1.17–1.96) | 2.10 (1.58–2.80) | 2.34 (1.75–3.12) | 0.93 (0.69–1.24) | 1.21 (0.89–1.65) | 1.43 (1.03–1.98) |
| (+) | |||||||||
| Commuting time (minutes) | |||||||||
| ≤60 | 1.32 (1.16–1.51) | 1.22 (1.06–1.40) | 1.18 (1.02–1.37) | 1.22 (1.07–1.39) | 1.09 (0.95–1.25) | 1.09 (0.94–1.25) | 1.53 (1.30–1.79) | 1.35 (1.14–1.61) | 1.32 (1.10–1.57) |
| 61–120 | 1.71 (1.11–2.63) | 1.78 (1.08–2.93) | 1.78 (1.09–2.92) | 1.53 (1.02–2.30) | 1.53 (0.95–2.46) | 1.49 (0.92–2.41) | 2.12 (1.27–3.56) | 2.08 (1.14–3.78) | 2.10 (1.15–3.82) |
| >120 | 2.62 (1.20–5.71) | 2.54 (1.09–5.88) | 2.10 (0.87–5.10) | 1.81 (0.83–3.94) | 1.69 (0.74–3.83) | 1.35 (0.56–3.25) | 4.52 (2.10–9.74) | 4.38 (1.77–10.85) | 3.85 (1.47–10.08) |
aModel 1: Adjusted for sex, age, education, income, occupation, employment status, commuting time (not adjusted in the commuting time table), working hours (not adjusted in the weekly working hours table), shift work (not adjusted in the shift work table), low job control, effort-reward imbalance, and organizational injustice.
bbModel 2: Adjusted for sex, age, education, income, occupation, employment status, commuting time (not adjusted in the commuting time table), working hours (not adjusted in the weekly working hours table), shift work (not adjusted in the shift work table), low job control, effort-reward imbalance, organizational injustice, awkward postures, heavy physical workload, prolonged standing, and repetitive movements.
- 1. Milner A, Badland H, Kavanagh A, LaMontagne AD. Time spent commuting to work and mental health: evidence from 13 waves of an Australian cohort study. Am J Epidemiol 2017;186(6):659–67.ArticlePubMed
- 2. Nomoto M, Hara A, Kikuchi K. Effects of long-time commuting and long-hour working on lifestyle and mental health among school teachers in Tokyo, Japan. J Hum Ergol (Tokyo) 2015;44(1):1–9.PubMed
- 3. Baek SU, Yoon JH, Won JU. Mediating effect of work-family conflict on the relationship between long commuting time and workers' anxiety and insomnia. Saf Health Work 2023;14(1):100–6.ArticlePubMed
- 4. Kimura M, Kamada H, Tsukagoshi Y, Tomaru Y, Nakagawa S, Tanaka K, et al. Influence of commuting methods on low back pain and musculoskeletal function of the lower limbs in elementary school children: a cross-sectional study. J Orthop Sci 2022;27(5):1120–5.ArticlePubMed
- 5. Christian TJ. Trade-offs between commuting time and health-related activities. J Urban Health 2012;89(5):746–57.ArticlePubMedPMCPDF
- 6. Han L, Peng C, Xu Z. The effect of commuting time on quality of life: evidence from China. Int J Environ Res Public Health 2022;20(1):573.ArticlePubMedPMC
- 7. Jung J, Ko K, Park JB, Lee KJ, Cho YH, Jeong I. Association between commuting time and subjective well-being in relation to regional differences in Korea. J Korean Med Sci 2023;38(15):e118.ArticlePubMedPMCPDF
- 8. Wang X, Gong J, Wang C. How does commute time affect labor supply in urban China? Implications for active commuting. Int J Environ Res Public Health 2020;17(13):4631.ArticlePubMedPMC
- 9. Atis GS, Ozic AB, Bukruk T, Ozkaya E, Yorulmazlar OK. The association between commuting, mood and job performance: the structural equation modelling approach. Int J Occup Saf Ergon 2022;28(4):2599–605.ArticlePubMed
- 10. van Ommeren JN, Gutiérrez-i-Puigarnau E. Are workers with a long commute less productive? An empirical analysis of absenteeism. Reg Sci Urban Econ 2011;41(1):1–8.Article
- 11. Bannai A, Tamakoshi A. The association between long working hours and health: a systematic review of epidemiological evidence. Scand J Work Environ Health 2014;40(1):5–18.ArticlePubMed
- 12. Alicandro G, Bertuccio P, Sebastiani G, La Vecchia C, Frova L. Long working hours and cardiovascular mortality: a census-based cohort study. Int J Public Health 2020;65(3):257–66.ArticlePubMedPDF
- 13. Park S, Kook H, Seok H, Lee JH, Lim D, Cho DH, et al. The negative impact of long working hours on mental health in young Korean workers. PLoS One 2020;15(8):e0236931.ArticlePubMedPMC
- 14. Miko HC, Zillmann N, Ring-Dimitriou S, Dorner TE, Titze S, Bauer R. Effects of physical activity on health. Gesundheitswesen 2020;82(S 03):S184–95.ArticlePubMedPMC
- 15. Barchek AR, Baez SE, Hoch MC, Hoch JM. The relationship between musculoskeletal injury and objectively measured physical activity levels: a critically appraised topic. J Sport Rehabil 2020;29(2):243–7.ArticlePubMed
- 16. Weyh C, Pilat C, Kruger K. Musculoskeletal disorders and level of physical activity in welders. Occup Med (Lond) 2020;70(8):586–92.ArticlePubMedPDF
- 17. Boivin DB, Boudreau P, Kosmadopoulos A. Disturbance of the circadian system in shift work and its health impact. J Biol Rhythms 2022;37(1):3–28.ArticlePubMedPMCPDF
- 18. Matre D, Christensen JO, Mork PJ, Ferreira P, Sand T, Nilsen KB. Shift work, inflammation and musculoskeletal pain-The HUNT Study. Occup Med (Lond) 2021;71(9):422–7.ArticlePubMedPDF
- 19. Ganesan S, Magee M, Stone JE, Mulhall MD, Collins A, Howard ME, et al. The impact of shift work on sleep, alertness and performance in healthcare workers. Sci Rep 2019;9(1):4635.ArticlePubMedPMCPDF
- 20. Leso V, Fontana L, Caturano A, Vetrani I, Fedele M, Iavicoli I. Impact of shift work and long working hours on worker cognitive functions: current evidence and future research needs. Int J Environ Res Public Health 2021;18(12):6540.ArticlePubMedPMC
- 21. Ryu J, Jung-Choi K, Choi KH, Kwon HJ, Kang C, Kim H. Associations of shift work and its duration with work-related injury among electronics factory workers in South Korea. Int J Environ Res Public Health 2017;14(11):1429.ArticlePubMedPMC
- 22. Kecklund G, Axelsson J. Health consequences of shift work and insufficient sleep. BMJ 2016;355:i5210.ArticlePubMed
- 23. Arvidsson I, Gremark Simonsen J, Lindegard-Andersson A, Bjork J, Nordander C. The impact of occupational and personal factors on musculoskeletal pain: a cohort study of female nurses, sonographers and teachers. BMC Musculoskelet Disord 2020;21(1):621.ArticlePubMedPMCPDF
- 24. Dzakpasu FQ, Carver A, Brakenridge CJ, Cicuttini F, Urquhart DM, Owen N, et al. Musculoskeletal pain and sedentary behaviour in occupational and non-occupational settings: a systematic review with meta-analysis. Int J Behav Nutr Phys Act 2021;18(1):159.ArticlePubMedPMCPDF
- 25. Nygaard NB, Thomsen GF, Rasmussen J, Skadhauge LR, Gram B. Ergonomic and individual risk factors for musculoskeletal pain in the ageing workforce. BMC Public Health 2022;22(1):1975.ArticlePubMedPMCPDF
- 26. Amiri S, Behnezhad S. Is job strain a risk factor for musculoskeletal pain? A systematic review and meta-analysis of 21 longitudinal studies. Public Health 2020;181:158–67.ArticlePubMed
- 27. Vargas-Prada S, Coggon D. Psychological and psychosocial determinants of musculoskeletal pain and associated disability. Best Pract Res Clin Rheumatol 2015;29(3):374–90.ArticlePubMedPMC
- 28. Saragiotto BT, Maher CG, Yamato TP, Costa LO, Menezes Costa LC, Ostelo RW, et al. Motor control exercise for chronic non-specific low-back pain. Cochrane Database Syst Rev 2016;2016(1):CD012004.ArticlePubMedPMC
- 29. Daneshmandi H, Choobineh AR, Ghaem H, Alhamd M, Fakherpour A. The effect of musculoskeletal problems on fatigue and productivity of office personnel: a cross-sectional study. J Prev Med Hyg 2017;58(3):E252–8.PubMedPMC
- 30. Dagenais S, Caro J, Haldeman S. A systematic review of low back pain cost of illness studies in the United States and internationally. Spine J 2008;8(1):8–20.ArticlePubMed
- 31. Sell L, Lund HL, Holtermann A, Sogaard K. The interactions between pain, pain-related fear of movement and productivity. Occup Med (Lond) 2014;64(5):376–81.ArticlePubMed
- 32. Kim D. Effect of musculoskeletal pain of care workers on job satisfaction. J Phys Ther Sci 2018;30(1):164–8.ArticlePubMedPMC
- 33. Hawker GA. The assessment of musculoskeletal pain. Clin Exp Rheumatol 2017;35 Suppl 107(5):8–12.PubMed
- 34. Pickard O, Burton P, Yamada H, Schram B, Canetti EF, Orr R. Musculoskeletal disorders associated with occupational driving: a systematic review spanning 2006-2021. Int J Environ Res Public Health 2022;19(11):6837.ArticlePubMedPMC
- 35. Niu J, An Y, Xu M, Zhang L, Liu J, Feng X, et al. Do sleep and psychological factors influence musculoskeletal pain among nurses? Work 2023;75(4):1455–65.ArticlePubMed
- 36. Ali M, Ahsan GU, Uddin Z, Hossain A. Road traffic delays in commuting workplace and musculoskeletal health among sedentary workers: a cross-sectional study in Dhaka city. J Occup Health 2021;63(1):e12289.ArticlePubMedPMCPDF
- 37. Lee JG, Kim GH, Jung SW, Kim SW, Lee JH, Lee KJ. The association between long working hours and work-related musculoskeletal symptoms of Korean wage workers: data from the fourth Korean working conditions survey (a cross-sectional study). Ann Occup Environ Med 2018;30:67.ArticlePubMedPMCPDF
- 38. Caruso CC, Bushnell T, Eggerth D, Heitmann A, Kojola B, Newman K, et al. Long working hours, safety, and health: toward a National Research Agenda. Am J Ind Med 2006;49(11):930–42.ArticlePubMed
- 39. Dudek M, Meng QJ. Running on time: the role of circadian clocks in the musculoskeletal system. Biochem J 2014;463(1):1–8.ArticlePubMedPDF
- 40. Zhou M, Yang S, Guo Y, Wang D, Qiu W, Wang B, et al. Shift work and the risk of knee osteoarthritis among Chinese workers: a retrospective cohort study. Scand J Work Environ Health 2020;46(2):152–60.ArticlePubMed
- 41. Ali M, Uddin Z, Ahsan GU, Hossain A. Association between daily commute and subjective health complaints among the office workers in an urban community. Heliyon 2021;7(8):e07841.ArticlePubMedPMC
- 42. Jung J, Park JB, Lee KJ, Seo Y, Jeong I. Association between commuting time and work-related low back pain with respect to sports and leisure activities in Korean workers. Ind Health 2024;62(2):133–42.ArticlePubMedPMC
REFERENCES
Figure & Data
REFERENCES
Citations
Citations to this article as recorded by 
- Association between shift work and brain age gap: a neuroimaging study using MRI-based brain age prediction algorithms
Youjin Kim, Joon Yul Choi, Evgeny Petrovskiy, Wanhyung Lee
Frontiers in Aging Neuroscience.2025;[Epub] CrossRef - Bidirectional genetic associations between chronotype and shift work: A Mendelian randomization study
Youjin Kim, Jongin Lee, Jeehee Min, Min Young Park, Seung-Yeon Lee, Seunghyun Lee, Wanhyung Lee
Chronobiology International.2025; 42(12): 1736. CrossRef
 Cite
CiteCommuting time and musculoskeletal pain in the relationship with working time: a cross-sectional study
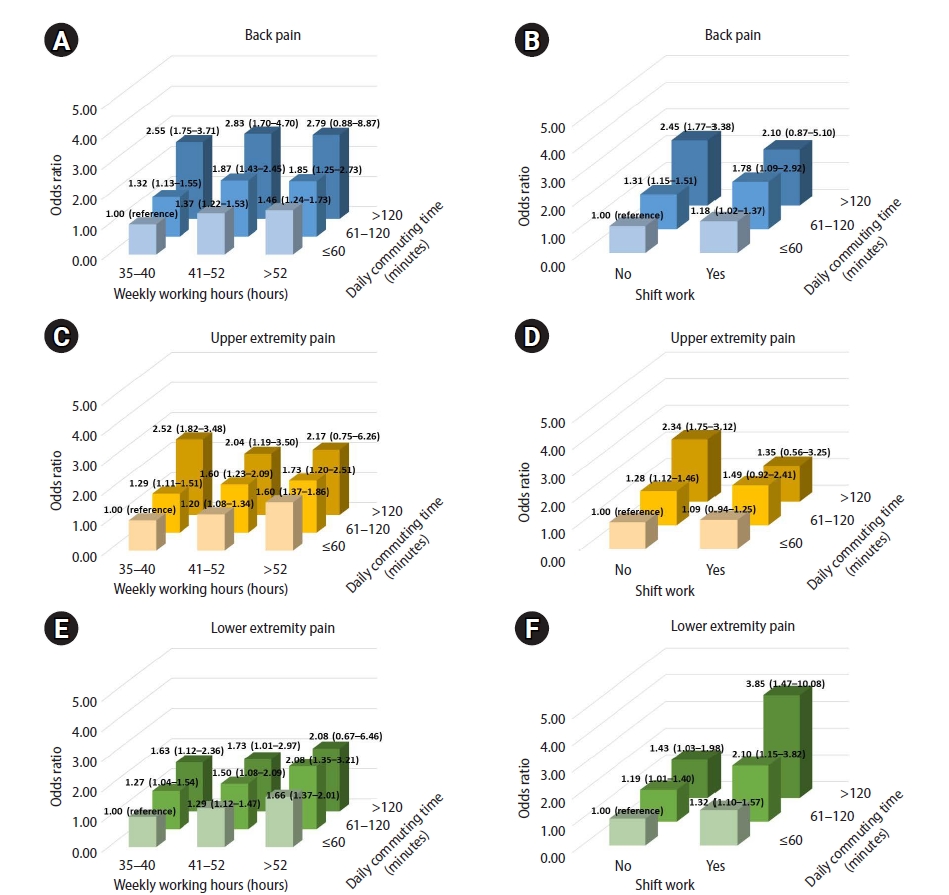
Fig. 1. Association between daily commuting time and musculoskeletal pain stratified by weekly working hours or shift work. (A) Association between daily commuting time and back pain according to weekly working hours. (B) Association between daily commuting time and back pain according to shift work. (C) Association between daily commuting time and upper extremity pain according to weekly working hours. (D) Association between daily commuting time and upper extremity pain according to shift work. (E) Association between daily commuting time and lower extremity pain according to weekly working hours. (F) Association between daily commuting time and lower extremity pain according to shift work.
Fig. 1.
Commuting time and musculoskeletal pain in the relationship with working time: a cross-sectional study
| Characteristic | Total | Daily commuting time (minutes) |
|||
|---|---|---|---|---|---|
| ≤60 | 61–120 | >120 | p-value | ||
| Sex | <0.001 | ||||
| Male | 18,649 (61.2) | 14,462 (77.5) | 3,507 (18.8) | 681 (3.6) | |
| Female | 11,809 (38.8) | 9,898 (83.8) | 1,621 (13.7) | 290 (2.5) | |
| Age group (years) | 0.001 | ||||
| 15–29 | 4,928 (16.2) | 3,951 (80.2) | 807 (16.4) | 170 (3.4) | |
| 30–39 | 7,624 (25.0) | 5,931 (77.8) | 1,455 (19.1) | 238 (3.1) | |
| 40–49 | 8,074 (26.5) | 6,388 (79.1) | 1,386 (17.2) | 300 (3.7) | |
| 50–59 | 6,906 (22.7) | 5,634 (81.6) | 1,069 (15.5) | 203 (2.9) | |
| ≥60 | 2,926 (9.6) | 2,456 (83.9) | 411 (14.0) | 59 (2.0) | |
| Education | <0.001 | ||||
| Middle school or less | 1,348 (4.4) | 1,130 (83.8) | 189 (14.0) | 29 (2.1) | |
| High school | 9,400 (30.9) | 8,097 (86.1) | 1,125 (12.0) | 178 (1.9) | |
| College or higher | 19,661 (64.7) | 15,100 (76.8) | 3,801 (19.3) | 760 (3.9) | |
| Income | <0.001 | ||||
| Lowest | 2,324 (8.0) | 2,054 (88.4) | 228 (9.8) | 42 (1.8) | |
| Low middle | 11,358 (39.2) | 9,466 (83.3) | 1,625 (14.3) | 267 (2.4) | |
| High middle | 8,482 (29.3) | 6,762 (79.7) | 1,469 (17.3) | 251 (3.0) | |
| Highest | 6,826 (23.5) | 4,896 (71.7) | 1,580 (23.2) | 350 (5.1) | |
| Employment status | 0.020 | ||||
| Regular | 27,181 (89.2) | 21,661 (79.7) | 4,632 (17.0) | 888 (3.3) | |
| Temporary | 2,355 (7.7) | 1,977 (83.9) | 326 (13.8) | 52 (2.2) | |
| Daily | 922 (3.0) | 722 (78.3) | 170 (18.4) | 30 (3.3) | |
| Occupation | <0.001 | ||||
| Professional and managerial | 8,237 (27.0) | 6,103 (74.1) | 1,689 (20.5) | 445 (5.4) | |
| Clerical (office work) | 7,700 (25.3) | 5,872 (76.3) | 1,536 (19.9) | 292 (3.8) | |
| Sales and service | 4,450 (14.6) | 3,892 (87.4) | 498 (11.2) | 60 (1.4) | |
| Manual | 10,072 (33.1) | 8,493 (84.3) | 1,405 (13.9) | 174 (1.7) | |
| Weekly working hours | <0.001 | ||||
| 1–34 | 0 (0) | 0 (0) | 0 (0) | 0 (0) | |
| 35–40 | 20,235 (66.4) | 15,922 (78.7) | 3,579 (17.7) | 734 (3.6) | |
| 41–52 | 7,887 (25.9) | 6,458 (81.9) | 1,227 (15.6) | 202 (2.6) | |
| 53–60 | 1,798 (5.9) | 1,522 (84.6) | 247 (13.7) | 29 (1.6) | |
| >60 | 539 (1.8) | 458 (85.0) | 76 (14.0) | 5 (1.0) | |
| Shift work | <0.001 | ||||
| No | 27,195 (89.5) | 21,584 (79.4) | 4,692 (17.3) | 919 (3.4) | |
| Yes | 3,174 (10.5) | 2,711 (85.4) | 414 (13.1) | 49 (1.5) | |
| Awkward postures | <0.001 | ||||
| No | 20,143 (66.2) | 15,698 (77.9) | 3,666 (18.2) | 779 (3.9) | |
| Yes | 10,288 (33.8) | 8,648 (84.1) | 1,448 (14.1) | 192 (1.9) | |
| Heavy physical workload | 0.002 | ||||
| No | 21,890 (72.0) | 17,345 (79.2) | 3,769 (17.2) | 776 (3.5) | |
| Yes | 8,520 (28.0) | 6,983 (82.0) | 1,344 (15.8) | 193 (2.3) | |
| Prolonged standing | <0.001 | ||||
| No | 12,367 (40.7) | 9,132 (73.8) | 2,603 (21.1) | 632 (5.1) | |
| Yes | 18,052 (59.3) | 15,209 (84.2) | 2,505 (13.9) | 338 (1.9) | |
| Repetitive movements | <0.001 | ||||
| No | 12,234 (40.2) | 9,419 (77.0) | 2,334 (19.1) | 481 (3.9) | |
| Yes | 18,171 (59.8) | 14,900 (82.0) | 2,784 (15.3) | 487 (2.7) | |
| Low job control | <0.001 | ||||
| No | 23,982 (78.9) | 19,071 (79.5) | 4,066 (17.0) | 845 (3.5) | |
| Yes | 6,395 (21.1) | 5,224 (81.7) | 1,049 (16.4) | 122 (1.9) | |
| Effort-reward imbalance | 0.626 | ||||
| No | 26,784 (88.6) | 21,415 (80.0) | 4,532 (16.9) | 837 (3.1) | |
| Yes | 3,446 (11.4) | 2,759 (80.1) | 561 (16.3) | 126 (3.6) | |
| Organizational injustice | 0.873 | ||||
| No | 27,664 (91.2) | 22,110 (79.9) | 4,679 (16.9) | 875 (3.2) | |
| Yes | 2,657 (8.8) | 2,127 (80.1) | 437 (16.4) | 93 (3.5) | |
| Back pain |
Upper extremity pain |
Lower extremity pain |
||||||||||
|---|---|---|---|---|---|---|---|---|---|---|---|---|
| Total | (–) | (+) | p-value | Total | (–) | (+) | p-value | Total | (–) | (+) | p-value | |
| Daily commuting time (minutes) | ||||||||||||
| ≤60 | 24,335 (80.0) | 18,724 (76.9) | 5,611 (23.1) | <0.001 | 24,327 (80.0) | 17,550 (72.1) | 6,777 (27.9) | 0.002 | 24,328 (80.0) | 21,016 (86.4) | 3,312 (13.6) | 0.966 |
| 61–120 | 5,123 (16.8) | 3,793 (74.0) | 1,330 (26.0) | 5,121 (16.8) | 3,622 (70.7) | 1,500 (29.3) | 5,124 (16.8) | 4,416 (86.2) | 708 (13.8) | |||
| >120 | 970 (3.2) | 637 (65.7) | 333 (34.3) | 968 (3.2) | 613 (63.3) | 355 (36.7) | 970 (3.2) | 838 (86.4) | 132 (13.6) | |||
| Weekly working hours | ||||||||||||
| 35–40 | 20,485 (66.4) | 16,143 (78.8) | 4,342 (21.2) | <0.001 | 20,473 (66.3) | 15,151 (74.0) | 5,322 (26.0) | <0.001 | 20,475 (66.3) | 18,086 (88.3) | 2,389 (11.7) | <0.001 |
| 41–52 | 7,988 (25.9) | 5,710 (71.5) | 2,278 (28.5) | 7,985 (25.9) | 5,473 (68.5) | 2,512 (31.5) | 7,989 (25.9) | 6,703 (83.9) | 1,286 (16.1) | |||
| >52 | 2,400 (7.8) | 1,591 (66.3) | 809 (33.7) | 2,399 (7.8) | 1,440 (60.0) | 959 (40.0) | 2,398 (7.8) | 1,873 (78.1) | 525 (21.9) | |||
| Shift work | ||||||||||||
| (–) | 27,568 (89.6) | 21,096 (76.5) | 6,472 (23.5) | <0.001 | 27,557 (89.6) | 19,835 (72.0) | 7,722 (28.0) | <0.001 | 27,561 (89.6) | 23,996 (87.1) | 3,565 (12.9) | <0.001 |
| (+) | 3,213 (10.4) | 2,279 (70.9) | 934 (29.1) | 3,212 (10.4) | 2,164 (67.4) | 1,048 (32.6) | 3,210 (10.4) | 2,586 (80.6) | 624 (19.4) | |||
| Weekly working hours | ||||||||||||
| 35–40 hours | ||||||||||||
| Commuting time (minutes) | ||||||||||||
| ≤60 | 15,907 (78.7) | 12,675 (79.7) | 3,232 (20.3) | <0.001 | 15,900 (78.7) | 11,866 (74.6) | 4,034 (25.4) | <0.001 | 15,898 (78.7) | 14,044 (88.3) | 1,854 (11.7) | 0.774 |
| 61–120 | 3,574 (17.7) | 2,783 (77.9) | 791 (22.1) | 3,572 (17.7) | 2,641 (73.9) | 931 (26.1) | 3,575 (17.7) | 3,163 (88.5) | 412 (11.5) | |||
| >120 | 734 (3.6) | 494 (67.3) | 240 (32.7) | 733 (3.6) | 462 (63.0) | 271 (37.0) | 733 (3.6) | 638 (87.1) | 95 (12.9) | |||
| 41–52 hours | ||||||||||||
| Commuting time (minutes) | ||||||||||||
| ≤60 | 6,449 (81.9) | 4,705 (73.0) | 1,744 (27.0) | 0.003 | 6,448 (81.9) | 4,467 (69.3) | 1,981 (30.7) | 0.160 | 6,452 (81.9) | 5,414 (83.9) | 1,038 (16.1) | 0.662 |
| 61–120 | 1,226 (15.6) | 809 (66.0) | 417 (34.0) | 1,227 (15.6) | 794 (64.7) | 433 (35.3) | 1,227 (15.6) | 1,015 (82.7) | 212 (17.3) | |||
| >120 | 202 (2.6) | 125 (61.8) | 77 (38.2) | 202 (2.6) | 133 (65.9) | 69 (34.1) | 202 (2.6) | 174 (86.3) | 28 (13.8) | |||
| >52 hours | ||||||||||||
| Commuting time (minutes) | ||||||||||||
| ≤60 | 1,979 (84.7) | 1,344 (67.9) | 635 (32.1) | 0.200 | 1,980 (84.7) | 1,218 (61.5) | 762 (38.5) | 0.569 | 1,979 (84.7) | 1,558 (78.7) | 421 (21.3) | 0.358 |
| 61–120 | 323 (13.8) | 201 (62.4) | 122 (37.6) | 323 (13.8) | 187 (58.0) | 136 (42.0) | 323 (13.8) | 239 (74.0) | 84 (26.0) | |||
| >120 | 35 (1.5) | 19 (53.6) | 16 (46.4) | 34 (1.5) | 18 (53.4) | 16 (46.6) | 35 (1.5) | 26 (74.1) | 9 (25.9) | |||
| Shift work | ||||||||||||
| Commuting time (minutes) | ||||||||||||
| (–) | ||||||||||||
| ≤60 | 21,562 (85.4) | 16,713 (77.5) | 4,849 (22.5) | <0.001 | 21,556 (79.4) | 15,644 (72.6) | 5,912 (27.4) | 0.003 | 21,556 (79.4) | 18,752 (87.0) | 2,804 (13.0) | 0.880 |
| 61–120 | 4,687 (13.1) | 3,503 (74.7) | 1,184 (25.3) | 4,685 (17.3) | 3,349 (71.5) | 1,336 (28.5) | 4,688 (17.3) | 4,086 (87.2) | 602 (12.8) | |||
| >120 | 918 (1.5) | 608 (66.2) | 310 (33.8) | 917 (3.4) | 583 (63.6) | 334 (36.4) | 918 (3.4) | 806 (87.8) | 112 (12.2) | |||
| (+) | ||||||||||||
| ≤60 | 2,710 (85.4) | 1,959 (72.3) | 751 (27.7) | 0.179 | 2,709 (85.4) | 1,854 (68.4) | 855 (31.6) | 0.358 | 2,708 (85.4) | 2,205 (81.4) | 503 (18.6) | 0.055 |
| 61–120 | 414 (13.0) | 277 (66.8) | 137 (33.2) | 415 (13.1) | 263 (63.4) | 152 (36.6) | 414 (13.1) | 314 (75.9) | 100 (24.1) | |||
| >120 | 49 (1.5) | 28 (56.8) | 21 (43.2) | 49 (1.5) | 29 (59.3) | 20 (40.7) | 49 (1.5) | 29 (59.7) | 20 (40.3) | |||
| Odds ratio (95% confidence interval) |
|||||||||
|---|---|---|---|---|---|---|---|---|---|
| Back pain |
Upper extremity pain |
Lower extremity pain |
|||||||
| Unadjusted | Model 1 |
Model 2 |
Unadjusted | Model 1 |
Model 2 |
Unadjusted | Model 1 |
Model 2 |
|
| Daily commuting time (minutes) | |||||||||
| ≤60 | 1.00 | 1.00 | 1.00 | 1.00 | 1.00 | 1.00 | 1.00 | 1.00 | 1.00 |
| 61–120 | 1.17 (1.04–1.32) | 1.33 (1.17–1.51) | 1.33 (1.16–1.52) | 1.07 (0.96–1.20) | 1.29 (1.14–1.46) | 1.29 (1.13–1.46) | 1.02 (0.88–1.18) | 1.23 (1.05–1.44) | 1.24 (1.05–1.45) |
| >120 | 1.74 (1.34–2.26) | 2.24 (1.67–3.00) | 2.41 (1.77–3.29) | 1.50 (1.17–1.92) | 2.07 (1.57–2.72) | 2.27 (1.71–3.00) | 1.00 (0.76–1.31) | 1.30 (0.98–1.73) | 1.53 (1.13–2.08) |
| Weekly working hours | |||||||||
| 35–40 | 1.00 | 1.00 | 1.00 | 1.00 | 1.00 | 1.00 | 1.00 | 1.00 | 1.00 |
| 41–52 | 1.48 (1.35–1.63) | 1.41 (1.27–1.56) | 1.36 (1.23–1.52) | 1.31 (1.19–1.43) | 1.23 (1.12–1.36) | 1.19 (1.08–1.32) | 1.45 (1.29–1.63) | 1.32 (1.17–1.49) | 1.26 (1.11–1.43) |
| >52 | 1.89 (1.64–2.17) | 1.50 (1.29–1.76) | 1.44 (1.24–1.69) | 1.90 (1.66–2.17) | 1.58 (1.37–1.82) | 1.54 (1.33–1.78) | 2.12 (1.81–2.49) | 1.69 (1.41–2.02) | 1.65 (1.38–1.97) |
| Shift work | |||||||||
| (–) | 1.00 | 1.00 | 1.00 | 1.00 | 1.00 | 1.00 | 1.00 | 1.00 | 1.00 |
| (+) | 1.34 (1.17–1.52) | 1.18 (1.02–1.36) | 1.2 (1.04–1.39) | 1.24 (1.10–1.41) | 1.06 (0.92–1.22) | 1.09 (0.95–1.25) | 1.62 (1.39–1.90) | 1.36 (1.14–1.63) | 1.39 (1.17–1.66) |
| Weekly working hours | |||||||||
| 35–40 hours | |||||||||
| Commuting time (minutes) | |||||||||
| ≤60 | 1.00 | 1.00 | 1.00 | 1.00 | 1.00 | 1.00 | 1.00 | 1.00 | 1.00 |
| 61–120 | 1.12 (0.96–1.29) | 1.3 (1.11–1.52) | 1.32 (1.13–1.55) | 1.04 (0.91–1.19) | 1.27 (1.10–1.47) | 1.29 (1.11–1.51) | 0.99 (0.82–1.18) | 1.23 (1.01–1.49) | 1.27 (1.04–1.54) |
| >120 | 1.90 (1.37–2.64) | 2.43 (1.68–3.49) | 2.55 (1.75–3.71) | 1.72 (1.28–2.32) | 2.36 (1.70–3.27) | 2.52 (1.82–3.48) | 1.13 (0.81–1.57) | 1.42 (1.00–2.01) | 1.63 (1.12–2.36) |
| 41–52 hours | |||||||||
| Commuting time (minutes) | |||||||||
| ≤60 | 1.45 (1.31–1.61) | 1.44 (1.29–1.60) | 1.37 (1.22–1.53) | 1.30 (1.18–1.44) | 1.25 (1.13–1.39) | 1.20 (1.08–1.34) | 1.45 (1.28–1.64) | 1.37 (1.20–1.56) | 1.29 (1.12–1.47) |
| 61–120 | 2.02 (1.61–2.54) | 2.07 (1.61–2.67) | 1.87 (1.43–2.45) | 1.60 (1.28–2.01) | 1.75 (1.37–2.23) | 1.60 (1.23–2.09) | 1.58 (1.17–2.14) | 1.69 (1.22–2.33) | 1.50 (1.08–2.09) |
| >120 | 2.43 (1.54–3.82) | 2.85 (1.73–4.69) | 2.83 (1.70–4.70) | 1.52 (0.97–2.39) | 1.89 (1.14–3.12) | 2.04 (1.19–3.50) | 1.21 (0.71–2.05) | 1.50 (0.86–2.61) | 1.73 (1.01–2.97) |
| > 52 hours | |||||||||
| Commuting time (minutes) | |||||||||
| ≤60 | 1.85 (1.59–2.16) | 1.65 (1.41–1.94) | 1.46 (1.24–1.73) | 1.84 (1.60–2.12) | 1.68 (1.45–1.96) | 1.60 (1.37–1.86) | 2.05 (1.71–2.44) | 1.81 (1.49–2.19) | 1.66 (1.37–2.01) |
| 61–120 | 2.37 (1.67–3.36) | 2.21 (1.51–3.24) | 1.85 (1.25–2.73) | 2.13 (1.52–3.00) | 1.99 (1.38–2.86) | 1.73 (1.20–2.51) | 2.67 (1.82–3.91) | 2.40 (1.58–3.66) | 2.08 (1.35–3.21) |
| >120 | 3.39 (1.38–8.32) | 3.25 (1.14–9.26) | 2.79 (0.88–8.87) | 2.56 (1.05–6.27) | 2.54 (0.92–7.01) | 2.17 (0.75–6.26) | 2.65 (1.01–6.96) | 2.51 (0.88–7.18) | 2.08 (0.67–6.46) |
| Shift work | |||||||||
| (–) | |||||||||
| Commuting time (minutes) | |||||||||
| ≤60 | 1.00 | 1.00 | 1.00 | 1.00 | 1.00 | 1.00 | 1.00 | 1.00 | 1.00 |
| 61–120 | 1.16 (1.03–1.32) | 1.32 (1.16–1.50) | 1.31 (1.15–1.51) | 1.06 (0.94–1.19) | 1.28 (1.12–1.45) | 1.28 (1.12–1.46) | 0.99 (0.85–1.14) | 1.19 (1.02–1.40) | 1.19 (1.01–1.40) |
| >120 | 1.76 (1.34–2.31) | 2.25 (1.65–3.07) | 2.45 (1.77–3.38) | 1.52 (1.17–1.96) | 2.10 (1.58–2.80) | 2.34 (1.75–3.12) | 0.93 (0.69–1.24) | 1.21 (0.89–1.65) | 1.43 (1.03–1.98) |
| (+) | |||||||||
| Commuting time (minutes) | |||||||||
| ≤60 | 1.32 (1.16–1.51) | 1.22 (1.06–1.40) | 1.18 (1.02–1.37) | 1.22 (1.07–1.39) | 1.09 (0.95–1.25) | 1.09 (0.94–1.25) | 1.53 (1.30–1.79) | 1.35 (1.14–1.61) | 1.32 (1.10–1.57) |
| 61–120 | 1.71 (1.11–2.63) | 1.78 (1.08–2.93) | 1.78 (1.09–2.92) | 1.53 (1.02–2.30) | 1.53 (0.95–2.46) | 1.49 (0.92–2.41) | 2.12 (1.27–3.56) | 2.08 (1.14–3.78) | 2.10 (1.15–3.82) |
| >120 | 2.62 (1.20–5.71) | 2.54 (1.09–5.88) | 2.10 (0.87–5.10) | 1.81 (0.83–3.94) | 1.69 (0.74–3.83) | 1.35 (0.56–3.25) | 4.52 (2.10–9.74) | 4.38 (1.77–10.85) | 3.85 (1.47–10.08) |
Table 1. Characteristics of the study participants according to daily commuting time
Values are presented as number (%).
Table 2. The prevalence of back pain, upper extremity pain, and lower extremity pain by daily commuting time, weekly working hours, and shift work (including stratified analysis by weekly working hours and shift work)
Values are presented as number (%).
Table 3. Musculoskeletal pains and their association with daily commuting time, weekly working hours, and shift work by logistic regression analysis (including stratified analysis by weekly working hours and shift work)
Model 1: Adjusted for sex, age, education, income, occupation, employment status, commuting time (not adjusted in the commuting time table), working hours (not adjusted in the weekly working hours table), shift work (not adjusted in the shift work table), low job control, effort-reward imbalance, and organizational injustice. bModel 2: Adjusted for sex, age, education, income, occupation, employment status, commuting time (not adjusted in the commuting time table), working hours (not adjusted in the weekly working hours table), shift work (not adjusted in the shift work table), low job control, effort-reward imbalance, organizational injustice, awkward postures, heavy physical workload, prolonged standing, and repetitive movements.

