Abstract
-
Background
This study was conducted to determine the association between work-life (WL) balance, effort-reward (ER) imbalance, and depressive mood in Korean wage workers when 2 models were considered simultaneously.
-
Methods
We analyzed 26,014 Korean workers including 13,471 men and 12,543 women from the 4th Korean Working Conditions Survey data. Multiple logistic regression was used to analyze the association between WL, ER status, and the depressive mood of Korean workers. We classified the subjects into a total of 4 groups as follows. Group 1: WL and ER status are both “balanced”, group 2: WL status is “imbalanced” and ER status is “balanced”, group 3: WL status is “balanced” and the ER status is “imbalanced”, group 4: WL and ER status are both “imbalanced.”
-
Results
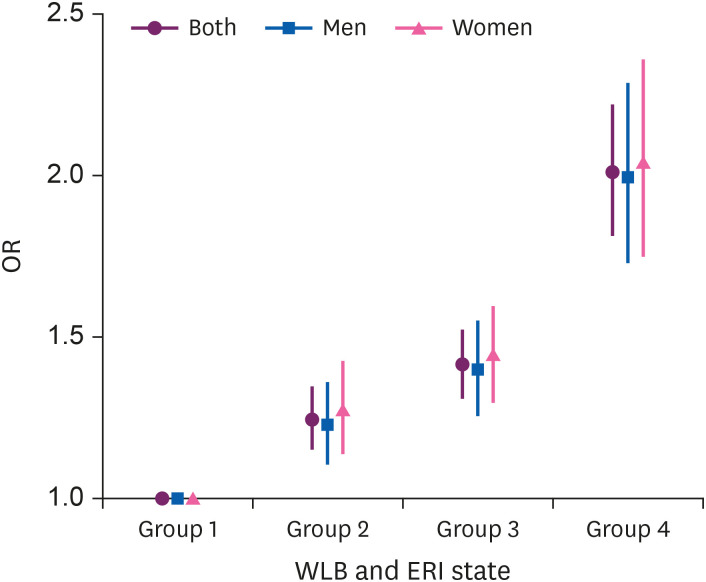
We found significantly increased odds ratios (ORs) for depressive mood in groups 2, 3, and 4 compared with group 1 after adjusting for the general and occupational characteristics of the subjects in both men and women. We also found that the trend of ORs increased gradually from groups 2 to 4 compared with group 1 in both men and women; group 2: OR: 1.23 (95% confidence interval [CI]: 1.12–1.35), group 3: OR: 1.40 (95% CI: 1.27–1.55), group 4: OR: 1.99 (95% CI: 1.74–2.28) compared with group 1 in men; group 2: OR: 1.28 (95% CI: 1.15–1.42), group 3: OR: 1.45 (95% CI: 1.31–1.59), group 4: OR: 2.04 (95% CI: 1.76–2.36) compared with group 1 in women.
-
Conclusions
As a result, we found the association between imbalanced WL, ER status, and depressive mood in Korean workers using 2 models simultaneously. It is important to provide a balanced WL and ER condition to improve the mental health of workers.
-
Keywords: Effort-reward imbalance; Work-life balance; Depressive mood; Depression; Working conditions
BACKGROUND
According to the World Health Organization (WHO), more than 320 million people worldwide had depression in 2015, representing an 18.4% increase in prevalence since 2005 [
1]. Depression has a significant impact on patients' quality of life, resulting in considerable burdens and economic losses to society and individuals [
2].
Depression is also associated with risk of suicide. According to the WHO report, more than 800,000 people die from suicide annually [
1]. In particular, Korea's suicide mortality rate is the second highest among Organization for Economic Cooperation and Development countries [
3]. Suicide is the fifth leading cause of death in the country [
4], and has become a social problem.
Depression can also affect workers' productivity, leading to presenteeism and absenteeism [
5]. Psychosocial factors, neurobiological factors, and genetic factors are known to be involved in the development of depression [
6], and it has recently been found that the working environment can also affect depression. The higher the degree of job stress, the lower the level of social support, and the greater the job insecurity, the greater the risk that workers may experience a major depressive episode [
7]. In addition, much research has been conducted on the effects of effort-reward imbalance (ERI) [
8], work-life balance (WLB) [
9] on physical and mental health and well-being of workers.
ERI refers to a condition of “high cost/low gain” in the workplace [
10]. In other words, it is a situation in which, even though considerable effort has been made, there are relatively few rewards (financial satisfaction, promotion opportunities, self-esteem, respect, and employment stability), and workers experience severe psychological pain that affects mental and physical health [
10]. Since the concept of ERI has been developed, much research has been done examining the idea. Tsutsumi and Kawakami [
11] reported that ERI was highly correlated with various psychosomatic symptoms, including depression, and Van Vegchel et al. [
12] reported that workers who work in an imbalanced effort-reward state suffer from stress. In a meta-analysis study in 2006, various work-stress models, including an ERI model, were identified as important risk factors for mental disorders [
13]. Research has shown that psychiatric symptoms are highly correlated with low job autonomy and inadequate compensation, and the association between the components of ERI and depression is well known [
14].
WLB can be defined as “accomplishment of role-related expectations that are negotiated and shared between an individual and his/her role-related partners in the work and family domains” [
15]. WLB consists of various factors, such as work, daily life, family life, and leisure. Most previous studies have focused on the work–family relationship [
16]. There is relatively little research on the effects of WLB on workers' mental health compared to other occupational and environmental factors. This is because the definition of WLB has not been clearly agreed upon, and WLB has recently been socially noted, resulting in insufficient accumulation of research results [
17]. Furthermore, there has been little research on WLB for Korean workers.
Although the WLB and ERI models are known to influence workers' mental health, there have been no studies in which both models were considered simultaneously.
This study was conducted to find the association between WLB, ERI status, and depressive mood in Korean wage workers when the 2 models were considered simultaneously.
METHODS
Participants
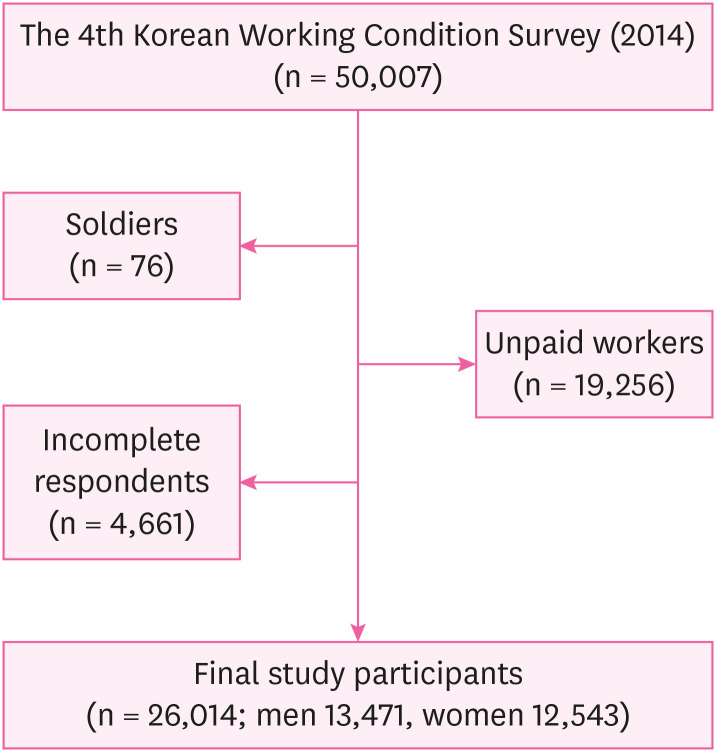
Data were obtained from the fourth Korean Working Conditions Survey (KWCS). The survey has been conducted 4 times since 2006. The fourth KWCS was conducted by Media Research under the supervision of the Occupational Safety and Health Research Institute in 2014. The purpose of the survey was to identify the overall working environment of Korean workers and to utilize the gathered data for the establishment of industrial safety and health policy. The survey subjects were the economically-active population aged 15 or older nationwide, and approximately 50,000 households were sampled. The questionnaire was developed on the basis of the European Working Conditions Survey and the Labor Force Survey. The survey was conducted by professional interviewers who interviewed the subjects individually. In this study, 26,014 wage workers were included in the final analysis (13,471 men and 12,543 women), excluding unpaid workers (19,256), soldiers (76), and respondents who did not fully complete the survey (4,661) (
Fig. 1).
Fig. 1Schematic diagram depicting study population.
Measurements
In this study, depressive mood was defined as a dependent variable according to the 5-item World Health Organization Well-Being Index (WHO-5) well-being index, and the work-life (WL) and effort-reward (ER) status were the independent variables. The control variables were constructed based on the factors reported to be related to the above variables. The specific definitions of the variables are as follows.
Independent variables: “WL” and “ER” status
The “WL” status was determined using the question “Is your working time suitable for family or social life?” Respondents answered with “very appropriate,” “moderate,” “not appropriate,” “not at all appropriate,” “do not know/no answer,” or “reject.” In this study, the answers “very appropriate” and “moderate” were considered to indicate balanced WL status, and the answers “not appropriate” and “not at all appropriate” were considered as indicating imbalanced WL status.
The “ER” status was defined using the question “How much do you agree that you are reasonably compensated for what you are doing?” Respondents answered with “strongly agree,” “generally agree,” “normal,” “generally disagree,” “never agree,” and “no.” In this study, respondents who answered “strongly agree,” “generally agree,” and “normal” were considered to have balanced ER status, and “generally disagree,” “never agree,” and “no” were considered to have imbalanced ER status.
Using the 2 variables (WL and ER) defined above, the subjects were divided into 4 groups as follows. Group 1: WL and ER status are both “balanced,” group 2: WL status is “imbalanced” and ER status is “balanced,” group 3: WL status is “balanced” and the ER status is “imbalanced,” and group 4: WL and ER status are both “imbalanced.” In this study, the analysis was carried out with reference to “balanced” WL and ER status.
Dependent variable: depressive mood
Depressive mood was defined using the WHO-5 well-being index question, “Please select only one item that best suits your feelings over the past 2 weeks.” The WHO-5 items (
Fig. 1) are: 1) ‘I have felt cheerful and in good spirits,’ 2) ‘I have felt calm and relaxed,’ 3) ‘I have felt active and vigorous,’ 4) ‘I woke up feeling fresh and rested,’ and 5) ‘My daily life has been filled with things which are interesting to me.’ The respondents were asked to rate how well each of the 5 statements applied to them during the last fourteen days. Each of the 5 items was scored from 0 (not at all) to 5 (all the time). Therefore, the raw score theoretically ranges from 0 (absence of well-being) to 25 (maximal well-being). Because scales measuring health-related quality of life are conventionally translated to a percentage scale from 0 (absent) to 100 (maximal), we multiplied the raw score by 4. We defined scores above 50 points as normal mood and those below 50 points as suspected depression, based on previous studies [
18].
Control variables
In this study, the control variables included general and occupational characteristics of the study subjects. The general characteristics used were age and health status. Occupational characteristics included education level, income level, job type, job status, shift work status, night work status, long working days, job satisfaction, job stress, support of colleagues, working hours, and mental burden due to the work. The definitions of the control variables are shown in
Table 1.
Table 1The definition of the control variables of the study subjects
|
Control variables |
Definition |
|
Age |
Age are classified with “15–19 years old”, “20–29 years old”, “30–39 years old”, “40–49 years old”, “50–59 years old”, and “60 to over years old”. |
|
health status |
Using the question “What is your overall health status?”, when the answer was “very good” or “good” or “normal”, then we defined it as “good health status”. On the other hand, when the answer was “bad” or “very bad”, then we defined it as “bad health status”. |
|
Education level |
The education level was categorized as middle school graduation, high school graduation, and above college graduation based on the responses to academic achievement. |
|
Income level |
The income level was classified into 0–1,000,000 won, 1,000,000–1,990,000 won, 2,000,000–2,990,000 won, and 3,000,000 won or more based on monthly average income received at work. |
|
Occupational type |
Job categories were categorized into 5 groups based on the responses to the question “Which one is most appropriate for your work (job) in the following job classification?” The first group was the management/professional group, which includes managers, experts, technicians, and semi-specialists. The second group was the white-collar group, and the third group was the service/sales group. The fourth group was the blue-collar group, which includes agriculture/forestry workers, machinery operators/assembly workers, and the fifth group was the laborers. |
|
Employment status |
Employment status was categorized as regular workers, temporary workers, and day laborers according to the term of employment contract. |
|
Shift work |
Shift work was categorized as “I work shifts/I do not work shifts” according to the response to the question about whether or not to do work shifts. |
|
Night work |
Night work was based on the response to the question, “When work at night is defined as working at least 2 hours a night between 10 pm and 5 am, how many days in a month do you work at night?”. If the response was one or more, then it was defined as “I work at night” and if the response was 0. then it was defined as “I do not work at night”. |
|
Long working days |
The number of long working days was categorized as 0 day, 1–10 days, 11 day or more based on the response to the question “How many days in a month do you work over then 10 hours?” |
|
Working condition satisfaction |
The satisfaction level of the working environment was defined as “not satisfied” in the case of responding “not particularly satisfied” or “not satisfied at all”, and it was defined as “satisfied” in the case of responding “very satisfied”, “satisfied” to the question “what do you think about the working environment of your work as a whole?” |
|
Stress from work |
Job stress was defined as “no job stress” when the respondents answered “not so” or “not at all” and it was defined as “with job stress” when respondents answered “always”, “mostly”, “sometimes” to the question of “I am stressed at work”. |
|
Colleague support |
Colleague support was defined as “not supportive” when the respondents answered “not so” or “not at all” to the question of “My colleagues help me and support me” and it was defined as “supportive” when respondents answered “always”, “mostly”, “sometimes” to the same question. |
|
Working hours |
Working hours were classified as over than 40 hours-group and less than 40 hours-group based on the weekly working hours. |
Statistical analysis
In this study, a χ
2 test was used to identify the prevalence of depressive mood according to the general and occupational characteristics of the participants. The distribution of WL and ER status according to depressive mood was described. Hierarchical multivariate logistic regression analysis was used to estimate the association between WL, ER status and depressive mood. In addition, we conducted multivariate logistic regression analysis to determine the association between groups 1–4 and depressive mood. To test whether the independent variables have multicollinearity, the variance inflation factor (VIF) was calculated [
19].
We carried out a sensitivity analysis of the depressive mood according to WL and ER to assess the effect of the different definitions of ER state and how changing this affected the results. We assessed 2 definitions of ER state. Definition 1 was that respondents answered with “normal” were considered to have imbalanced ER status. Definition 2 was that respondents answered with “normal” were considered to have normal ER status.
We calculated the odds ratios (ORs) in the crude model, the minimally adjusted model (model I), and the fully adjusted model (model II). Model I was adjusted for general characteristics, and model II was adjusted for general and occupational characteristics.
All analyses were stratified by gender. All statistical analyses were performed with SAS 9.4 (SAS Institute Inc., Cary, NC, USA), and statistical significance was set at p < 0.05.
Ethics statement
Institutional Review Board of Seoul National University Hospital determined to exempt the review of this study and approved the waiver of written informed consent (IRB No. 2009-002-1152).
RESULTS
The distribution of the general and occupational characteristics of the normal mood and depressive mood subjects is shown in
Table 2. Of the total 26,014 respondents, 13,471 were men (51.8%) and 12,543 were women (48.2%). The number of people with depressive mood was 5,110 (37.9%) for men and 4,856 (38.7%) for women. The mean age of the respondents was 43.8 years (standard deviation [SD]: 12.7) for men and 43.4 years (SD: 13.0) for women.
Table 2 General and occupational characteristics of the participants according to depressive mood
|
Variables |
Men |
Women |
|
Total |
Normal mood |
Depressive mood |
p-value |
Total |
Normal mood |
Depressive mood |
p-value |
|
Total |
13,471 (100.0) |
8,361 (62.1) |
5,110 (37.9) |
< 0.001 |
12,543 (100.0) |
7,687 (61.3) |
4,856 (38.7) |
< 0.001 |
|
Age (year) |
|
|
|
< 0.001 |
|
|
|
< 0.001 |
|
15–19 |
149 (1.1) |
114 (1.4) |
35 (0.7) |
131 (1.0) |
82 (1.1) |
49 (1.0) |
|
20–29 |
1,580 (11.7) |
1,057 (12.6) |
523 (10.2) |
1,884 (15.0) |
1,264 (16.4) |
620 (12.8) |
|
30–39 |
3,689 (27.4) |
2,479 (29.7) |
1,210 (23.7) |
2,882 (23.0) |
1,938 (25.2) |
944 (19.4) |
|
40–49 |
3,726 (27.7) |
2,286 (27.3) |
1,440 (28.2) |
3,820 (30.5) |
2,338 (30.4) |
1,482 (30.5) |
|
50–59 |
2,711 (20.1) |
1,616 (19.3) |
1,095 (21.4) |
2,476 (19.7) |
1,419 (18.5) |
1,057 (21.8) |
|
≥ 60 |
1,616 (12.0) |
809 (9.7) |
807 (15.8) |
1,350 (10.8) |
646 (8.4) |
704 (14.5) |
|
Health condition |
|
|
|
< 0.001 |
|
|
|
< 0.001 |
|
Bad |
368 (2.7) |
143 (1.7) |
225 (4.4) |
533 (4.3) |
194 (2.5) |
339 (7.0) |
|
Good |
13,103 (97.3) |
8,218 (98.3) |
4,885 (95.6) |
12,010 (95.8) |
7,493 (97.5) |
4,517 (93.0) |
|
Education |
|
|
|
< 0.001 |
|
|
|
< 0.001 |
|
Middle school or below |
1,374 (10.2) |
640 (7.7) |
734 (14.4) |
1,724 (13.7) |
801 (10.4) |
923 (19.0) |
|
High school |
4,869 (36.1) |
2,813 (33.6) |
2,056 (40.2) |
5,005 (39.9) |
2,925 (38.1) |
2,080 (42.8) |
|
College or above |
7,228 (53.7) |
4,908 (58.7) |
2,320 (45.4) |
5,814 (46.4) |
3,961 (51.5) |
1,853 (38.2) |
|
Income (/10,000₩/month) |
|
|
|
< 0.001 |
|
|
|
< 0.001 |
|
< 100 |
688 (5.1) |
376 (4.5) |
312 (6.1) |
1,766 (14.1) |
982 (12.8) |
784 (16.1) |
|
100–199 |
2,115 (15.7) |
1,161 (13.9) |
954 (18.7) |
4,641 (37.0) |
2,769 (36.0) |
1,872 (38.6) |
|
200–299 |
3,155 (23.4) |
2,015 (24.1) |
1,140 (22.3) |
2,045 (16.3) |
1,341 (17.5) |
704 (14.5) |
|
≥ 300 |
7,513 (55.8) |
4,809 (57.5) |
2,704 (52.9) |
4,091 (32.6) |
2,595 (33.8) |
1,496 (30.8) |
|
Occupational type |
|
|
|
< 0.001 |
|
|
|
< 0.001 |
|
Management/professional |
2,147 (15.9) |
1,459 (17.5) |
688 (13.5) |
1,917 (15.3) |
1,316 (17.1) |
601 (12.4) |
|
White collar |
3,682 (27.3) |
2,597 (31.1) |
1,085 (21.2) |
3,284 (26.2) |
2,273 (29.6) |
1,011 (20.8) |
|
Service/sales |
2,085 (15.5) |
1,327 (15.9) |
758 (14.8) |
4,701 (37.5) |
2,828 (36.8) |
1,873 (38.6) |
|
Blue collar |
3,499 (26.0) |
2,026 (24.2) |
1,473 (28.8) |
785 (6.3) |
432 (5.6) |
353 (7.3) |
|
Laborer |
2,058 (15.3) |
952 (11.4) |
1,106 (21.6) |
1,856 (14.8) |
838 (10.9) |
1,018 (21.0) |
|
Employment status |
|
|
|
< 0.001 |
|
|
|
< 0.001 |
|
Regular worker |
10,692 (79.4) |
6,897 (82.5) |
3,795 (74.3) |
8,744 (69.7) |
5,599 (72.8) |
3,145 (64.8) |
|
Temporary worker |
1,715 (12.7) |
967 (11.6) |
748 (14.6) |
2,959 (23.6) |
1,696 (22.1) |
1,263 (26.0) |
|
Day laborer |
1,064 (7.9) |
497 (5.9) |
567 (11.1) |
840 (6.7) |
392 (5.1) |
448 (9.2) |
|
Shift work |
|
|
|
< 0.001 |
|
|
|
< 0.001 |
|
No |
11,751 (87.2) |
7,414 (88.7) |
4,337 (84.9) |
11,591 (92.4) |
7,131 (92.8) |
4,460 (91.9) |
|
Yes |
1,720 (12.8) |
947 (11.3) |
773 (15.1) |
952 (7.6) |
556 (7.2) |
396 (8.2) |
|
Night work |
|
|
|
< 0.001 |
|
|
|
< 0.001 |
|
No |
11,408 (84.7) |
7,231 (86.5) |
4,177 (81.7) |
11,776 (93.9) |
7,240 (94.2) |
4,536 (93.4) |
|
Yes |
2,063 (15.3) |
1,130 (13.5) |
933 (18.3) |
767 (6.1) |
447 (5.8) |
320 (6.6) |
|
10 hours ≥ working day (/month) |
|
|
|
< 0.001 |
|
|
|
< 0.001 |
|
0 |
7,935 (58.9) |
5,066 (60.6) |
2,869 (56.1) |
9,186 (73.2) |
5,689 (74.0) |
3,497 (72.0) |
|
1–10 |
3,138 (23.3) |
2,037 (24.4) |
1,101 (21.6) |
1,896 (15.1) |
1,262 (16.4) |
634 (13.1) |
|
≥ 11 |
2,398 (17.8) |
1,258 (15.1) |
1,140 (22.3) |
1,461 (11.7) |
736 (9.6) |
725 (14.9) |
|
Working condition satisfaction |
|
|
|
< 0.001 |
|
|
|
< 0.001 |
|
Not satisfied |
3,482 (25.9) |
1,571 (18.8) |
1,911 (37.4) |
3,007 (24.0) |
1,344 (17.5) |
1,663 (34.3) |
|
Satisfied |
9,989 (74.2) |
6,790 (81.2) |
3,199 (62.6) |
9,536 (76.0) |
6,343 (82.5) |
3,193 (65.8) |
|
Stress from work |
|
|
|
< 0.001 |
|
|
|
< 0.001 |
|
No |
3,220 (23.9) |
2,024 (24.2) |
1,196 (23.4) |
3,278 (26.1) |
1,960 (25.5) |
1,318 (27.1) |
|
Yes |
10,251 (76.1) |
6,337 (75.8) |
3,914 (76.6) |
9,265 (73.9) |
5,727 (74.5) |
3,538 (72.9) |
|
Colleague support |
|
|
|
< 0.001 |
|
|
|
< 0.001 |
|
No |
1,405 (10.4) |
654 (7.8) |
751 (14.7) |
1,529 (12.2) |
699 (9.1) |
830 (17.1) |
|
Yes |
12,066 (89.6) |
7,707 (92.2) |
4,359 (85.3) |
11,014 (87.8) |
6,988 (90.9) |
4,026 (82.9) |
|
Working hour (/week) |
|
|
|
< 0.001 |
|
|
|
< 0.001 |
|
≤ 40 |
6,703 (49.8) |
4,397 (52.6) |
2,306 (45.1) |
7,380 (58.8) |
4,664 (60.7) |
2,716 (55.9) |
|
> 40 |
6,768 (50.2) |
3,964 (47.4) |
2,804 (54.9) |
5,163 (41.2) |
3,023 (39.3) |
2,140 (44.1) |
|
WL |
|
|
|
< 0.001 |
|
|
|
< 0.001 |
|
Balanced |
10,037 (74.5) |
6,603 (79.0) |
3,434 (67.2) |
9,616 (76.7) |
6,191 (80.5) |
3,425 (70.5) |
|
Imbalanced |
3,434 (25.5) |
1,758 (21.0) |
1,676 (32.8) |
2,927 (23.3) |
1,496 (19.5) |
1,431 (29.5) |
|
ER |
|
|
|
< 0.001 |
|
|
|
< 0.001 |
|
Balanced |
10,518 (78.1) |
6,934 (82.9) |
3,584 (70.1) |
9,624 (76.7) |
6,266 (81.5) |
3,358 (69.2) |
|
Imbalanced |
2,953 (21.9) |
1,427 (17.1) |
1,526 (29.9) |
2,919 (23.3) |
1,421 (18.5) |
1,498 (30.9) |
Among all respondents, the WL status was “imbalanced” for 25.5% of men and 23.3% of women. The ER status was “imbalanced” in 21.9% of the men and 23.3% of the women.
The frequency of depressive mood was higher in the workers who are imbalanced WL or imbalanced ER status, over 40 years of age, unhealthy workers, with education below high school, with an income level of < 2,000,000 KRW/month, blue collar workers, laborers, temporary workers, day laborers, workers with shift work, night work, long working days more than 11 days per month, with dissatisfaction with their working conditions, no support from colleagues, working hours of > 40/week.
The distribution of each group of WL and ER relative to depression is shown in
Table 3. The frequency of depressive mood was higher in the groups 2, 3, and 4 for both men and women. There was a statistically significant difference between the normal mood and depressive mood workers in both men and women (
p < 0.001).
Table 3 Depressive mood by WL and ER state
|
WL and ER state |
Total |
Normal mood |
Depressive mood |
p-value |
|
Men |
13,471 (100.0) |
8,361 (100.0) |
5,110 (100.0) |
< 0.001 |
|
Balanced-Balanced |
8,127 (60.3) |
5,579 (66.7) |
2,548 (49.9) |
|
Imbalanced- Balanced |
2,391 (17.8) |
1,355 (16.2) |
1,036 (20.3) |
|
Balanced- Imbalanced |
1,910 (14.2) |
1,024 (12.3) |
886 (17.3) |
|
Imbalanced-Imbalanced |
1,043 (7.7) |
403 (4.8) |
640 (12.5) |
|
Women |
12,543 (100.0) |
7,687 (100.0) |
4,856 (100.0) |
< 0.001 |
|
Balanced-Balanced |
7,588 (60.5) |
5,114 (66.5) |
2,474 (51.0) |
|
Imbalanced-Balanced |
2,036 (16.2) |
1,152 (15.0) |
884 (18.2) |
|
Balanced-Imbalanced |
2,028 (16.2) |
1,077 (14.0) |
951 (19.6) |
|
Imbalanced-Imbalanced |
891 (7.1) |
344 (4.5) |
547 (11.3) |
The results of the hierarchical regression analysis of depressive mood according to the “balanced” or “imbalanced” status of WL and ER are as follows (
Table 4). The adjusted OR of the depressive mood in the “imbalanced” WL status compared to the “balanced” WL status was 1.29 (95% confidence interval [CI]: 1.21–1.37). The adjusted OR of the depressive mood in the “imbalanced” ER group compared to the “balanced” ER group was 1.47 (95% CI: 1.39–1.56).
Table 4 ORs for depressive mood according to WL and ER state using hierarchical multiple regression analysis
|
Variables |
Crude |
Model Ia
|
Model IIb
|
|
WL |
|
|
|
|
Balanced |
Ref. |
Ref. |
Ref. |
|
Imbalanced |
1.59 (1.51–1.67) |
1.61 (1.53–1.69) |
1.29 (1.21–1.37) |
|
ER |
|
|
|
|
Balanced |
Ref. |
Ref. |
Ref. |
|
Imbalanced |
1.92 (1.83–2.02) |
1.83 (1.74–1.93) |
1.47 (1.39–1.56) |
|
Age (year) |
|
|
|
|
15–19 |
|
0.89 (0.70–1.14) |
0.69 (0.52–0.92) |
|
20–29 |
|
Ref. |
Ref. |
|
30–39 |
|
1.03 (0.96–1.12) |
1.08 (0.99–1.18) |
|
40–49 |
|
1.33 (1.24–1.44) |
1.36 (1.25–1.47) |
|
50–59 |
|
1.52 (1.40–1.64) |
1.30 (1.19–1.42) |
|
≥ 60 |
|
2.15 (1.96–2.35) |
1.42 (1.26–1.60) |
|
Sex |
|
|
|
|
Men |
|
Ref. |
Ref. |
|
Women |
|
1.02 (0.97–1.06) |
1.05 (1.00–1.12) |
|
Health condition |
|
|
|
|
Poor |
|
2.08 (1.84–2.35) |
1.68 (1.46–1.93) |
|
Good |
|
Ref. |
Ref. |
|
Education |
|
|
|
|
Middle school or below |
|
|
1.13 (1.02–1.25) |
|
High school |
|
|
Ref. |
|
College or above |
|
|
0.96 (0.90–1.03) |
|
Income (/10,000₩/month) |
|
|
|
|
< 100 |
|
|
1.03 (0.93–1.15) |
|
100–199 |
|
|
1.07 (1.00–1.14) |
|
200–299 |
|
|
1.03 (0.97–1.10) |
|
≥ 300 |
|
|
Ref. |
|
Occupational type |
|
|
|
|
Management/professional |
|
|
1.02 (0.94–1.10) |
|
White collar |
|
|
Ref. |
|
Service/sales |
|
|
1.04 (0.96–1.12) |
|
Blue collar |
|
|
1.08 (1.00–1.19) |
|
Laborer |
|
|
1.45 (1.30–1.61) |
|
Employment status |
|
|
|
|
Regular worker |
|
|
Ref. |
|
Temporary worker |
|
|
0.95 (0.88–1.02) |
|
Day laborer |
|
|
1.09 (0.98–1.21) |
|
Shift work |
|
|
|
|
No |
|
|
0.97 (0.88–1.06) |
|
Yes |
|
|
Ref. |
|
Night work |
|
|
|
|
No |
|
|
Ref. |
|
Yes |
|
|
1.06 (0.97–1.16) |
|
10 hours ≥ working day (/month) |
|
|
|
|
0 |
|
|
Ref. |
|
0–10 |
|
|
0.87 (0.82–0.93) |
|
≥ 11 |
|
|
1.12 (1.04–1.21) |
|
Working condition satisfaction |
|
|
|
|
Not satisfied |
|
|
1.80 (1.70–1.91) |
|
Satisfied |
|
|
Ref. |
|
Stress from work |
|
|
|
|
No |
|
|
Ref. |
|
Yes |
|
|
1.01 (0.96–1.07) |
|
Colleague support |
|
|
|
|
No |
|
|
1.48 (1.37–1.60) |
|
Yes |
|
|
Ref. |
|
Working hour (/week) |
|
|
|
|
≤ 40 |
|
|
Ref. |
|
> 40 |
|
|
1.03 (0.98–1.09) |
Sensitivity analyses according to the different definitions of ER state (
Table 5) showed similar results to the primary analysis (
Table 4).
Table 5 ORs for depressive mood according to WL and the different definitions of ER state (sensitivity analysis)
|
Variables |
Crude |
Model Ia
|
Model IIb
|
|
ER definition 1c
|
|
|
|
|
WL |
|
|
|
|
|
Balanced |
Ref. |
Ref. |
Ref. |
|
|
Imbalanced |
1.54 (1.47–1.62) |
1.56 (1.48–1.64) |
1.28 (1.20–1.36) |
|
ER |
|
|
|
|
|
Balanced |
Ref. |
Ref. |
Ref. |
|
|
Imbalanced |
2.10 (2.00–2.19) |
2.02 (1.92–2.12) |
1.63 (1.54–1.72) |
|
ER definition 2d
|
|
|
|
|
WL |
|
|
|
|
|
Balanced |
Ref. |
Ref. |
Ref. |
|
|
Imbalanced |
1.51 (1.44–1.59) |
1.53 (1.45–1.61) |
1.27 (1.20–1.35) |
|
ER |
|
|
|
|
|
Balanced |
Ref. |
Ref. |
Ref. |
|
|
Normal |
1.82 (1.73–1.92) |
1.78 (1.69–1.88) |
1.52 (1.43–1.61) |
|
|
Imbalanced |
2.68 (2.53–2.84) |
2.53 (2.38–2.69) |
1.90 (1.77–2.04) |
When WL and ER status were considered together, the results of multiple logistic regression analysis of depressive mood were as follows (
Table 6,
Fig. 2). 1) The group with “balanced” WL and “balanced” ER status (group 1) was the reference group. 2) The adjusted OR of depressive mood for the “imbalanced” WL and “balanced” ER status group (group 2) was 1.23 (95% CI: 1.12–1.35) for men and 1.28 (95% CI: 1.15–1.42) for women. 3) The adjusted ORs of depressive mood for the “balanced” WL and “imbalanced” ER status group (group 3) was 1.40 (95% CI: 1.27–1.55) for men and 1.45 (95% CI: 1.31–1.59) for women. 4) The adjusted OR of depressive mood for the “imbalanced” WL and “imbalanced” ER status group (group 4) was 1.99 (95% CI: 1.74–2.28) for men and 2.04 (95% CI: 1.76–2.36) for women. The trend of ORs increased gradually from groups 1 to 4. All of the above results were statistically significant (
p < 0.001).
Table 6 ORs for depressive mood according to WL and ER state
|
WL and ER state |
Crude |
Model Ia
|
Model IIb
|
|
Men |
|
|
|
|
Balanced-Balanced |
Ref. |
Ref. |
Ref. |
|
Imbalanced-Balanced |
1.56 (1.43–1.70) |
1.55 (1.42–1.69) |
1.23 (1.12–1.35) |
|
Balanced-Imbalanced |
1.84 (1.68–2.02) |
1.80 (1.64–1.98) |
1.40 (1.27–1.55) |
|
Imbalanced-Imbalanced |
3.48 (3.08–3.92) |
3.36 (2.98–3.80) |
1.99 (1.74–2.28) |
|
Women |
|
|
|
|
Balanced-Balanced |
Ref. |
Ref. |
Ref. |
|
Imbalanced-Balanced |
1.51 (1.38–1.66) |
1.54 (1.41–1.69) |
1.28 (1.15–1.42) |
|
Balanced-Imbalanced |
1.85 (1.69–2.03) |
1.78 (1.62–1.95) |
1.45 (1.31–1.59) |
|
Imbalanced-Imbalanced |
3.27 (2.86–3.73) |
3.12 (2.73–3.57) |
2.04 (1.76–2.36) |
Fig. 2
Graphs showing the adjusted ORs from logistic regression according to WL and ER state. Group 1: WL (balanced) and ER (balanced); group 2: WL (imbalanced) and ER (balanced); group 3: WL (balanced) and ER (imbalanced); group 4: WL (imbalanced) and ER (imbalanced).
OR: odds ratio; WL: work-life; ER: effort-reward; WLB: work-life balance; ERI: effort-reward imbalance.

The VIF of independent variables were under 2.5 respectively, which means that there is almost never multicollinearity between independent variables. The VIF values of ER and WL were 1.012, respectively [
19].
DISCUSSION
Based on the results previous studies that workers’ depressive mood is related to WLB [
9] and ERI [
8], this study tried to identify how those 2 work-stress models and depressive mood are associated together in Korean workers.
We found that WLB and ERI status were both related to depressive mood and ERI had a higher impact on depressive mood than WLB. When both WL and ER were imbalanced, they had a synergistic effect and result in a higher association with depressive mood; this relationship holds true regardless of gender. The VIF values of ER and WL were under than 2.5 respectively, which means that independent variables did not show multicollinearity.
ERI and WLB have a similar concept in that they evaluate a balanced distribution of limited resources. The proportion of resources distributed to work/life and effort/reward should be in a relatively appropriate balance, and when these are not balanced, they act as a stressor for workers.
The difference between ERI and WLB is that ERI is limited to the working situation, and WLB includes stress outside of the working situation [
20]. Depending on the workers, some workers will be only stressed in the working situation, some will be only stressed outside of the working situation, and some will be stressed in both situations. This is the reason why the study subjects were divided into 4 categories.
Previous studies have shown that the most important 2 explanatory factors among various workplace stressors that result in burnout or intention to leave the profession are ERI and WLB. In these studies, the independent health effects of these 2 domains were identified. However, the health effects when both domains existed were not evaluated [
21].
Recently, some studies have been reported the health effects of multiple workplace stressors when they co-exist [
22]. When an individual worker faces a situation in which various workplace stressors with various underlying mechanisms are accumulated, it acts as a greater burden in the stress perception and cognitive assessment process of workers.
Studies on the health effects of multiple workplace stressors including this study could be evidence when inventing comprehensive workplace stressor index or developing effective intervention strategies to reduce work stress in legal, institutional and policy aspects.
As shown in this study, when 2 or more stress models are simultaneously in effect, synergy occurs, demonstrating a greater impact on workers' health than when a single work-stress model is the only one involved. In a previous study, the ERI had a greater effect on workers' mental fatigue due to the synergistic effect when it was present with other work-stress models [
23]. In addition, another study showed that when the ERI was present with structural inequality, it had a greater impact on the increase in depressive disability pension rate due to the synergistic effect [
24].
The imbalance of WL or ER is an example of type 2 allostatic load. Allostatic load is the “body wear and tear” that accumulates when an individual is exposed to repetitive or chronic stress [
25]. Unlike type 1 allostatic load, which occurs when energy demand exceeds supply, when excessive energy consumption causes social conflict or social dysfunction, this is called type 2 allostatic load. It can be improved through changes of education system or social structure [
26].
When a worker's limited energy is excessively consumed only for work or effort compared to life or reward, this imbalance acts as a chronic stressor. Chronic stress is known to activate neuroendocrine pathways [
27]. First, chronic stress causes a high level of cortisol and it causes damage and atrophy of the amygdala and hippocampus, which can lead to depression [
28]. Second, chronic stress causes a variety of inflammatory reactions, such as oxidative-nitrificative stress, which can lead to neurodegeneration and this can lead to depression [
29].
This study has some limitations. First, some of the risk factors that are known to be related to depression are not included in the analysis. The 3 most important predictors of depression are family history of depression, history of depressive episodes, and recent events [
30]. The fourth KWCS did not include this information. In addition, recent domestic and international studies have reported that smoking and drinking, which are health-risk behaviors [
31,32], also affect depression, but information on smoking and drinking is also not included in the fourth KWCS.
Second, there are some limitations in defining the independent variables, WLB and ERI state. Both variables were evaluated based on only one question item, which is relatively simple compared with the existing evaluation methods. The WLB status can be described from various aspects by using several questionnaires. Greenhaus and Beutell [
33] classified work-life conflict as “work hours,” “job strain,” and “behavioral pattern at work” to evaluate WLB status. The longer the work hours, the higher the job strain, and the greater the behavioral pattern required by the work, the greater the conflict between work and life [
33]. In this study, only the “work hours” were evaluated among the 3 work-life conflict factors. The ERI status can also be assessed in various ways. The “effort” section of the European Working Environment Survey consists of 6 questions, including qualitative workload, quantitative workload, total workload over time, and physical workload. The “reward” category includes self-esteem, promotion, economic compensation, and employment stability [
34]. Therefore, it is expected that more reliable results can be obtained if the questionnaire is improved in the future.
Third, this was a cross-sectional study. WLB and ERI were found to be significantly associated with depressive mood, but causality could not be confirmed. In addition, it is impossible to exclude the influence of biases such as the healthy worker effect. If the workers have depression, they are more likely to quit their jobs. In cross-sectional studies, these people may already have left the company, and the OR can be underestimated. A longitudinal study could overcome these limitations.
Fourth, when interpreting the results of this study, it is likely that the fourth KWCS only included workers who were working at the time of the survey. For this reason, it is possible that workers who were seriously depressed and took leave or who were hospitalized for treatment were excluded. Therefore, it is difficult to apply this study to the general worker population.
Despite its limitations, this study also has several strengths. It is the first study to analyze the association between WLB, ERI, and depressive mood in Korean wage workers. There has been previous research on the effects of the WLB on overall health status [
9], or the ERI on mental health [
8], but there have been no study that directly relates the WLB and ERI to depressive mood. Furthermore, there has been no study examining the effects of WLB and ERI on depression simultaneously. In addition, in a previous study, small specific occupation groups such as nurses [
35] and firefighters [
36] were used as study subjects. In this study, however, large-scale sample data of all Korean wage workers were used. In this study, “depressive mood” was defined on the basis of 50 points on the WHO-5 index. In other studies on the relationship between psychosocial stress and depression, the General Health Questionnaire (GHQ) and the Center for Epidemiologic Studies Depression Scale (CES-D) were used to determine the degree of depression. In a recent study on the accuracy of the GHQ's diagnosis of depression, sensitivity was 81.7% and reliability was 85.4% [
37]. The sensitivity of the CES-D was 83%, and the specificity was 78% in a systematic review study [
38]. In the case of the WHO-5 index, the sensitivity was 86% and the specificity was 81% when using 50 points as a cutoff value in a systematic review study, it was similar to or better than other commonly-used depression screening tools [
18].
CONCLUSIONS
This study found that the WLB and ERI are significantly related to the depressive mood of Korean wage workers. Considering the effects of depression on family and society, it is time to emphasize the importance of proper rewards that correspond to effort and an appropriate balance of work and life.
Acknowledgements
Authors appreciate Occupational Safety and Health Research Institute (OSHRI) for offering raw-data of Korean Working Conditions Survey (KWCS).
Abbreviations
Center for Epidemiologic Studies Depression Scale
General Health Questionnaire
Korean Working Conditions Survey
variance inflation factor
World Health Organization
5-item World Health Organization Well-Being Index
NOTES
-
Competing interests: The authors declare that they have no competing interests.
-
Author contributions:
Conceptualization: Lim HM, Park CJ.
Data curation: Lim HM, Park CJ.
Formal analysis: Lim HM, Park CJ, Yook JH, Kim MS, Kim HY, Hong YC.
Investigation: Lim HM, Park CJ, Yook JH, Kim MS, Kim HY, Hong YC.
Writing - original draft: Lim HM.
Writing - review & editing: Hong YC.
REFERENCES
REFERENCES
- 1. World Health Organization (WHO). Depression and Other Common Mental Disorders: Global Health Estimates. Geneva: WHO; 2017.
- 2. Whooley MA, Kiefe CI, Chesney MA, Markovitz JH, Matthews K, Hulley SB, et al. Depressive symptoms, unemployment, and loss of income: The CARDIA Study. Arch Intern Med 2002;162(22):2614–2620. 12456234.ArticlePubMed
- 3. Organization for Economic Cooperation and Development (OECD). Health Status - Suicide Rates - OECD Data. Paris: OECD; 2018.
- 4. Ministry of Health and Welfare (Country). Ministry of Health and Welfare Statistical Yearbook. Ministry of Health and Welfare (Country); 2016.
- 5. Evans-Lacko S, Knapp M. Global patterns of workplace productivity for people with depression: absenteeism and presenteeism costs across eight diverse countries. Soc Psychiatry Psychiatr Epidemiol 2016;51(11):1525–1537. 27667656.ArticlePubMedPMCPDF
- 6. Mazure CM. Life stressors as risk factors in depression. Clin Psychol Sci Pract 1998;5(3):291–313.Article
- 7. Blackmore ER, Stansfeld SA, Weller I, Munce S, Zagorski BM, Stewart DE. Major depressive episodes and work stress: results from a national population survey. Am J Public Health 2007;97(11):2088–2093. 17901431.ArticlePubMedPMC
- 8. Siegrist J. Adverse health effects of high-effort/low-reward conditions. J Occup Health Psychol 1996;1(1):27–41. 9547031.ArticlePubMed
- 9. Amstad FT, Meier LL, Fasel U, Elfering A, Semmer NK. A meta-analysis of work-family conflict and various outcomes with a special emphasis on cross-domain versus matching-domain relations. J Occup Health Psychol 2011;16(2):151–169. 21280939.ArticlePubMed
- 10. Siegrist J.. Reducing social inequalities in health: work-related strategies. Scand J Public Health Suppl 2002;59:49–53. 12227965.ArticlePubMedPDF
- 11. Tsutsumi A, Kawakami N. A review of empirical studies on the model of effort-reward imbalance at work: reducing occupational stress by implementing a new theory. Soc Sci Med 2004;59(11):2335–2359. 15450708.ArticlePubMed
- 12. van Vegchel N, de Jonge J, Bosma H, Schaufeli W. Reviewing the effort-reward imbalance model: drawing up the balance of 45 empirical studies. Soc Sci Med 2005;60(5):1117–1131. 15589679.ArticlePubMed
- 13. Stansfeld S, Candy B. Psychosocial work environment and mental health--a meta-analytic review. Scand J Work Environ Health 2006;32(6):443–462. 17173201.ArticlePubMed
- 14. Niedhammer I, Chastang JF, David S, Barouhiel L, Barrandon G. Psychosocial work environment and mental health: Job-strain and effort-reward imbalance models in a context of major organizational changes. Int J Occup Environ Health 2006;12(2):111–119. 16722190.ArticlePubMed
- 15. Brough P, Timms C, Chan XW, Hawkes A, Rasmussen L. Work-life balance: definitions, causes, and consequences. In: Theorell T, editor. Handbook of Socioeconomic Determinants of Occupational Health: From Macro-level to Micro-level Evidence. Berlin: Springer International Publishing; 2020, 1–15.
- 16. Greenhaus JH, Allen TD. Work-family balance: a review and extension of the literature. In: Quick JC, Tetrick LE, editors. Handbook of Occupational Health Psychology. Washington, D.C.: American Psychological Association; 2011, 165–183.
- 17. Hall DT, Kossek EE, Briscoe JP, Pichler S, Lee MD. Nonwork orientations relative to career: A multidimensional measure. J Vocat Behav 2013;83(3):539–550.Article
- 18. Topp CW, Østergaard SD, Søndergaard S, Bech P. The WHO-5 Well-Being Index: a systematic review of the literature. Psychother Psychosom 2015;84(3):167–176. 25831962.ArticlePubMedPDF
- 19. Midi H, Sarkar SK, Rana S. Collinearity diagnostics of binary logistic regression model. J Interdiscip Math 2010;13(3):253–267.Article
- 20. Häusler N, Bopp M, Hämmig O. Effort-reward imbalance, work-privacy conflict, and burnout among hospital employees. J Occup Environ Med 2018;60(4):e183–7. 29370015.ArticlePubMed
- 21. Hämmig O. Explaining burnout and the intention to leave the profession among health professionals - a cross-sectional study in a hospital setting in Switzerland. BMC Health Serv Res 2018;18(1):785. 30340485.PubMedPMC
- 22. Goh J, Pfeffer J, Zenios S. The relationship between workplace stressors and mortality and health costs in the United States. Manage Sci 2016;62(2):608–628.Article
- 23. Calnan M, Wainwright D, Almond S. Job strain, effort-reward imbalance and mental distress: a study of occupations in general medical practice. Work Stress 2000;14(4):297–311.Article
- 24. Juvani A, la Oksanen T, Virtanen M, Salo P, Pentti J, Kivimäki M, et al. Clustering of job strain, effort-reward imbalance, and organizational injustice and the risk of work disability: a cohort study. Scand J Work Environ Health 2018;44(5):485–495. 29777612.ArticlePubMed
- 25. Sterling P, Eyer J. Allostasis: a new paradigm to explain arousal pathology. In: Fisher S, Reason J, editors. Handbook of Life Stress, Cognition and Health. Hoboken, NJ: John Wiley & Sons; 1988, 629–649.
- 26. Sterling P. Allostasis: a model of predictive regulation. Physiol Behav 2012;106(1):5–15. 21684297.ArticlePubMed
- 27. Kunz-Ebrecht SR, Kirschbaum C, Steptoe A. Work stress, socioeconomic status and neuroendocrine activation over the working day. Soc Sci Med 2004;58(8):1523–1530. 14759695.ArticlePubMed
- 28. Stokes PE. The potential role of excessive cortisol induced by HPA hyperfunction in the pathogenesis of depression. Eur Neuropsychopharmacol 1995;5(Suppl):77–82.Article
- 29. Maes M, Yirmyia R, Noraberg J, Brene S, Hibbeln J, Perini G, et al. The inflammatory & neurodegenerative (I&ND) hypothesis of depression: leads for future research and new drug developments in depression. Metab Brain Dis 2009;24(1):27–53. 19085093.ArticlePubMedPDF
- 30. Monroe SM, Slavich GM, Gotlib IH. Life stress and family history for depression: the moderating role of past depressive episodes. J Psychiatr Res 2014;49:90–95. 24308926.ArticlePubMed
- 31. Park SM, Han MA, Park J, Ryu SY, Choi SW, Shin HH, et al. Associations between smoking, drinking and depression among Korean adults: the 5th Korea National Health and Nutrition Examination Survey. Korean J Health Promot 2016;16(2):111–118.Article
- 32. Weinberger AH, Kashan RS, Shpigel DM, Esan H, Taha F, Lee CJ, et al. Depression and cigarette smoking behavior: A critical review of population-based studies. Am J Drug Alcohol Abuse 2017;43(4):416–431. 27286288.ArticlePubMed
- 33. Greenhaus JH, Beutell NJ. Sources of conflict between work and family roles. Acad Manage Rev 1985;10(1):76–88.Article
- 34. Siegrist J. Chronic psychosocial stress at work and risk of depression: evidence from prospective studies. Eur Arch Psychiatry Clin Neurosci 2008;258(Suppl 5):115–119. 18985307.ArticlePubMedPDF
- 35. Kim HC, Kwon KS, Koh DH, Leem JH, Park SG, Shin JY, et al. The relationship between job stress and psychosocial stress among nurses at a university hospital. Korean J Occup Environ Med 2006;18(1):25–34.ArticlePDF
- 36. Ha J, Kim DI, Seo BS, Kim WS, Ryu S, Kim SG. Job stress and psychosocial stress among firefighters. Korean J Occup Environ Med 2008;20(2):104–111.ArticlePDF
- 37. Lundin A, Hallgren M, Theobald H, Hellgren C, Torgén M. Validity of the 12-item version of the General Health Questionnaire in detecting depression in the general population. Public Health 2016;136:66–74. 27040911.ArticlePubMed
- 38. Vilagut G, Forero CG, Barbaglia G, Alonso J. Screening for depression in the general population with the Center for Epidemiologic Studies Depression (CES-D): a systematic review with meta-analysis. PLoS One 2016;11(5):e0155431. 27182821.ArticlePubMedPMC

 , Cham-jin Park1

 Cite
Cite