
Articles
- Page Path
- HOME > Ann Occup Environ Med > Volume 32; 2020 > Article
- Research Article The association between mercury concentrations and lipid profiles in the Korean National Environmental Health Survey (KoNEHS) cycle 3
-
Soo Ho Sohn1
 , Han Cheol Heo1, Seongmin Jo1, Chulyong Park1, Joon Sakong2
 -
Annals of Occupational and Environmental Medicine 2020;32:e19.
DOI: https://doi.org/10.35371/aoem.2020.32.e19
Published online: June 22, 2020
1Department of Occupational and Environmental Medicine, Yeungnam University Hospital, Daegu, Korea.
2Department of Preventive Medicine and Public Health, College of Medicine, Yeungnam University, Daegu, Korea.
- Correspondence: Joon Sakong. Department of Preventive Medicine and Public Health, College of Medicine, Yeungnam University, 170 Hyeonchung-ro, Nam-gu, Daegu 42415, Korea. jjsakong@gmail.com
• Received: March 6, 2020 • Accepted: June 4, 2020
Copyright © 2020 Korean Society of Occupational & Environmental Medicine
This is an Open Access article distributed under the terms of the Creative Commons Attribution Non-Commercial License (https://creativecommons.org/licenses/by-nc/4.0/) which permits unrestricted non-commercial use, distribution, and reproduction in any medium, provided the original work is properly cited.
Abstract
-
Background High concentrations of mercury intake from seafood are known to cause various side effects in humans, including on the nervous system. Various studies have reported the effects of mercury concentrations in humans; however, the association between dyslipidemia, a cardiovascular disease risk factor, and mercury remains controversial. Therefore, this study aimed to investigate the association between mercury accumulation and cholesterol concentrations in a Korean population.
-
Methods We analyzed data of a sample of 3,228 respondents obtained from the Korean National Environmental Health Survey cycle 3, surveyed between 2015 and 2017, to determine how lipid profiles changed according to the blood mercury concentrations (BHg) and urine mercury concentrations (UHg). Multiple regression analysis was used to determine the effects of mercury concentrations among various factors affecting blood cholesterol levels.
-
Results The arithmetic mean (AM) of BHg was 2.91 (2.81–3.02) μg/L, and the geometric mean (GM) was 2.71 (2.59–2.85) μg/L. The AM of UHg was 0.52 (0.48–0.56) μg/L, and the GM was 0.35 (0.33–0.38) μg/L. Lipid profiles were more related to the BHg than to the UHg. Total cholesterol (total-C), high-density lipoprotein cholesterol (HDL-C), and low-density lipoprotein cholesterol (LDL-C) levels increased significantly as BHg increased in males, and total-C, triglyceride, and LDL-C levels increased significantly in females. Multiple regression analysis indicated that BHg were significantly associated with total-C, HDL-C, and LDL-C levels.
-
Conclusions We found an association between mercury exposure and the risk of dyslipidemia; however, further studies are required to elucidate a causal association.
BACKGROUND
In the marine environment, the inorganic form of mercury combines with organic matter from sediments and is converted into organic mercury, particularly methyl mercury, which may subsequently concentrate in higher organisms via the ocean's food chain [1]. The Korean Peninsula is surrounded by ocean on 3 sides, and Koreans are known consumers of large amounts of seafood [2]. The mercury intake in Korean adults is 18.8 μg/day, and > 90% exposure has been reported to be derived from seafood [3]. The Korean National Environmental Health Survey (KoNEHS) cycle 2, from 2012 to 2014, reported that the average blood mercury level of 3.11 μg/L was high and was associated with fish and shellfish dietary habits [4].
It has previously been reported that mercury accumulation has side effects on the central nervous and urinary system [3]. It has also been reported that mercury levels can affect the cardiovascular system [5,6,7,8]. One study showed an average increase of 8 mm every 4 years in the intima media thickness of the coronary artery for each 1 μg/g increase in hair mercury level [8]. Wiggers et al. [9] using in animal experiments also reported that mercury exposure can induce endothelial cell dysfunction.
In 2016, 58.2 and 45.8 of every 100,000 people died from heart disease and cerebral vascular diseases, respectively. These were ranked second and third among the causes of death in Korea [10]. Although numerous studies of exercise and medication to prevent and treat cardiovascular disease have been conducted, cardiovascular disease remains a major cause of death [11]. Among the various contributing factors, dyslipidemia is one of the most important risk factors for cardiovascular disease [12], and the oxidation of low-density lipoprotein cholesterol (LDL-C) is known to play an important role in atherogenesis [13]. Salonen et al. [14] reported that a large mercury intake was associated with acute myocardial infarction and can cause lipid peroxidation and that hair mercury concentration was a significant predictor of oxidized LDL-C immune complex titers.
Several studies have reported conflicting results on the association between blood cholesterol levels and blood mercury concentrations (BHg) and urine mercury concentrations (UHg). One study involving 477 Korean individuals reported a significant association between BHg and lipid profiles [15]. Lim et al. [16] reported that total cholesterol (total-C), triglyceride (TG), and LDL-C levels had a significant positive association with hair mercury concentrations, whereas heart rate and high-density lipoprotein cholesterol (HDL-C) levels had a negative association with hair mercury concentrations. In a recent study of 1,890 adolescents, total-C and LDL-C levels significantly increased as the total blood mercury concentration increased in males [17]. However, in a 2009–2010 study using data from the Korean National Health and Nutrition Examination Survey (KNHANES), which examined the effects of heavy metals in blood, HDL-C and lead concentrations in blood were relevant, but mercury concentrations showed no significant difference between the normal and abnormal groups in terms of total-C, HDL-C, and LDL-C levels [18]. In an analysis of the 2005–2010 KNHANES, the association between blood mercury levels and metabolic syndrome was not significant [19].
Although high mercury concentrations have been reported to increase the risk of cardiovascular disease [14], the association between mercury concentrations and lipid profiles remains controversial, and more studies are needed to clarify this association. Previous studies regarding the association between mercury exposure and lipid profiles have been limited to small samples containing a narrow range of mercury concentrations. Few studies have been conducted based on stratified samples that could represent the entire adult population, with insufficient data to determine an association between mercury concentrations and lipid profiles.
Therefore, based on the latest large-scale environmental health survey (KoNHES 2015–2017), this study analyzed the association between mercury concentrations and lipid profiles in a Korean sample population and evaluated mercury concentration as a risk factor for dyslipidemia.
METHODS
This study was conducted using data from the KoNEHS cycle 3 (2015–2017). KoNEHS cycle 3 was a large-scale bio-monitoring program implemented by the National Institute of Environmental Research that tested levels of exposure to environmental pollutants such as lead and mercury in the Korean population from 2015 to 2017. Blood and urine samples from 6,167 people were collected from 233 regions across Korea to analyze the concentrations of 26 types of harmful environmental substances. Moreover, factors concerning exposure to environmental harmful substances were identified through a survey. The survey responses provided information regarding lifestyle characteristics and laboratory test results and included information on factors such as sex, age, educational levels, cigarette smoking status, and alcohol consumption status. Of the 6,167 surveyed respondents, there were 571 infants aged ≥ 3 years, 887 elementary school students, 922 middle and high school students, and 3,787 adults aged ≥ 19 years. In this study, infants and elementary, middle, and high school students were excluded from the sample. Additionally, respondents taking medication for dyslipidemia and those with TG levels ≥ 400 mg/dL, which are not suitable for the calculation of LDL-C (Friedewald equation), were also excluded. Finally, a total of 3,228 adults aged ≥ 19 years were enrolled in this study.
Using KoNEHS data, BHg and UHg were analyzed using the following methods [20]. Blood samples were taken from blood collection containers (vacutainer royal blue cap) containing an anticoagulant (ethylenediaminetetraacetic acid). The samples were kept frozen at -20°C until analysis. BHg were analyzed at a wavelength of 254.65 nm using a gold amalgam mercury-only analyzer (gold amalgamation direct mercury analyzer, DMA-80, Milestone). According to quality control (QC) samples, the means ± standard deviation (SD) for the years 2015, 2016, and 2017 were 1.50 ± 0.05 μg/dL, 1.33 ± 0.06 μg/dL, and 1.30 ± 0.06 μg/dL, respectively, and the accuracy means ± SD were 100.5 ± 3.5%, 95.8 ± 4.6%, and 91.7 ± 5.6%, respectively. Urine samples were taken from sterilized urine collection containers (specimen cup). The samples were kept frozen at −20°C until analysis. UHg were analyzed at a wavelength of 253.7 nm using a gold amalgam mercury analyzer. According to the results of accuracy measurements using QC samples (G-EQUAS), the mean ± SD UHg were 0.47 ± 0.06 μg/dL, 0.23 ± 0.03 μg/dL, and 0.42 ± 0.03 μg/dL, respectively, and the accuracy means ± SD were 88.5 ± 8.1%, 76.8 ± 7.5%, and 102.2 ± 6.9%, in 2015, 2016, and 2017, respectively.
Serum lipid profiles were analyzed using the following KoNEHS data [21]. Total-C was analyzed at a wavelength of 505/694 nm using colorimetric analysis (colorimetry, enzymatic method, ADVIA 1800, Siemens). A reagent reaction method is an endpoint method (one reagent) that measures absorbance at the end of the specimen and reagent reaction. HDL-C was measured through analyzing quinonimine produced after a peroxidase reaction with hydrogen peroxide, produced through acting on a cholesterol oxidase at a wavelength of 596 nm, with a colorimetric analysis (colorimetry, elimination/catalase method, ADVIA 1800, Siemens). TG levels were measured by analyzing hydrolyzed glycerol and produced by lipoprotein lipase at a wavelength of 505/694 nm with a colorimetric analysis (colorimetry, GPO Trinder without serum blank method, ADVIA 1800, Siemens). Since LDL-C was not measured directly in the survey, it was obtained using the Friedewald equation. Therefore, values with a TG of ≥ 400 mg/dL could not be used in the LDL-C formula, and those samples were treated as missing values.
We analyzed age, sex, educational levels, body mass index (BMI), cigarette smoking status, and alcohol consumption status as factors that could affect lifestyle profiles. Age was divided into 6 categories: 19–29 years, 30–39 years, 40–49 years, 50–59 years, 60–69 years, and ≥ 70 years old. Educational levels were divided into 2 categories, namely, high school graduate or lower and college graduate or higher. BMI (kg/m2) was divided into 3 categories, namely, < 23, ≥ 23 and <25, and ≥ 25 kg/m2. Cigarette smoking status was divided into 3 categories, namely, never smoker, past smoker, or current smoker. Alcohol consumption status was divided into yes or no response categories. The frequency of fish and shellfish consumption was divided into 5 categories, namely, rarely, once a month, 2–3 times a month, once a week, and ≥ 2 times a week.
KoNEHS cycle 3-designed samples have been stratified for estimating the representative values for the Korean population [22]. A sampling method was applied using a 2-stage probability proportional sampling method, whereby the primary extraction unit was the survey zone and the secondary extraction units were the household and the individual zones. Design weights were calculated to reflect the differences in the sampling probabilities of households within the survey zone that appeared as a result of the application of the 2-stage stratification probability proportional system extraction method during sampling. Therefore, all statistics in this study were analyzed using a general linear Statistical Package for the Social Sciences (SPSS) model version 25.0 (SPSS Inc., Chicago, IL, USA), considering the stratification variables and weights. We considered the results to be statistically significant at a level of 5%.
Mercury concentrations according to the respondents' general characteristics are expressed as arithmetic and geometric means (GMs). We calculated the GM of mercury using the antilog of the mean of the logarithm transformed value. Linear tendency (p-trend) was verified to compare lipid profiles according to changes in body mercury concentrations. Multiple linear regression analysis of the general linear model was used to determine the association between the BHg and cholesterol levels. This was analyzed by adjusting for age, sex, cigarette smoking status, alcohol consumption status, educational level, BMI, and seafood consumption habit. The associations between BHg and adjusted cholesterol levels are shown in a scatterplot. To visualize changing cholesterol levels according to BHg, locally estimated scatterplot smoothing (LOESS) and regression lines are also shown in the scatterplot. LOESS smoothing draws the most suitable forecast line according to data sections.
This study was approved by the Institutional Review Board (IRB) of Yeungnam University Hospital (IRB file No. 2019-08-025). All participants provided written informed consent for inclusion in the study.
RESULTS
Of the 3,228 respondents, 1,400 (43.4%) were males and 1,828 (56.6%) were females. Regarding age, respondents in their 50s (23%) comprised the largest portion of the total population, whereas those in their 20s (8.3%) comprised the smallest portion (Table 1). Concerning BMI, 35.5% of the respondents had a BMI < 23 kg/m2, and 27.4% and 24.8% of males and females had a BMI within the normal range (23–25 kg/m2), respectively. Among current smokers, 454 (32.4%) were males and 49 (2.7%) were females. The number of respondents who consumed alcohol was higher than that of those who did not (males, 91.3%; females, 72.3%). In terms of educational levels, 896 males (64.0%) and 1,281 females (70.1%) reported their educational level to be “high school graduate or lower,” which was a substantially larger percentage than those who responded with “college graduate or higher.”
Table 1
General characteristics of study population
The arithmetic mean (AM) of BHg for all study respondents was 2.91 (2.81–3.02) μg/L, and the GM was 2.71 (2.59–2.85) μg/L. The AM of UHg was 0.52 (0.48–0.56) μg/L, and the GM was 0.35 (0.33–0.38) μg/L (Table 2). The GMs of BHg were 3.23 (3.01–3.47) μg/L and 2.29 (2.19–2.40) μg/L in males and females, respectively. The GMs of UHg were 0.40 (0.37–0.43) μg/L and 0.32 (0.30–0.34) μg/L in males and females, respectively. The GM of BHg in this study (KoNEHS cycle 3) was 2.71 μg/L, which was lower than those reported in KoNEHS cycle 2 (3.11 μg/L) and KoNEHS cycle 1 (3.08 μg/L).
Table 2
Blood & urine mercury concentrations of study population by sex, age, BMI, smoking, drinking, education level
BHg were significantly higher in males than those in females. As age increased, BHg tended to increase and subsequently decrease, with an overall peak in respondents in their 50s. UHg showed a decreasing tendency as age increased. The BHg and UHg in respondents who had a history of smoking were significantly higher than in those who had never smoked.
BHg were significantly higher in respondents who consumed alcohol than in those who did not, with a significant difference in UHg. BHg were significantly higher in respondents with a higher educational level compared to those with a lower educational level, whereas UHg were not significantly different.
A comparison of lipid profiles according to quartile of BHg showed that total-C, HDL-C, and LDL-C levels in males and total-C, TG, and LDL-C levels in females have a significant tendency to increase with BHg (Table 3). However, BHg were not associated with TG levels in males or HDL-C levels in females. Total-C, TG, and LDL-C levels increased in males according to UHg, and P-value and P-trend results were found to be statistically significant.
Table 3
Blood lipid levels according to quartile groups of blood and urine mercury levels in males and females
We investigated the effects of BHg on total-C, HDL-C, TG, and LDL-C levels. After adjusting for age, sex, alcohol consumption status, cigarette smoking status, seafood intake, BMI and educational level, we performed multiple regression analysis and observed that BHg significantly affected total-C, HDL-C, and LDL-C levels, with β-values being 2.927, 0.835, and 1.962, respectively (Table 4).
Table 4
Multiple regression analysis between lipid profiles and cardiovascular risk factors
Based on human bio-monitoring (HBM) I and II, we compared the levels of lipid profiles between the high and low exposure groups (Table 5). Samples above the HBM I threshold showed significantly higher total-C, TG, and LDL-C than those below the HBM I threshold. However, based on HBM II, there were no significant differences between the 2 groups. This result is possibly attributed to the small number of samples above the HBM II threshold.
Table 5
Lipid profiles according to HBM I, II
Fig. 1 shows a scatterplot of the BHg and cholesterol levels. Cholesterol levels were adjusted for age, sex, alcohol consumption status, cigarette smoking status, seafood intake, BMI, and educational level. Regression lines and LOESS smoothing were drawn on each graph to show their tendencies. We found that total-C, HDL-C, and LDL-C levels increased as BHg increased.
Fig. 1

Lipid profiles and blood mercury concentrations by scatter plot. Total-C, HDL-C, LDL-C show a tendency to increase according to blood mercury concentrations. Solid line represents locally estimated scatterplot smoothing. Dotted line represents regression.
BHg: blood mercury concentrations; Total-C: total cholesterol; HDL-C: high-density lipoprotein cholesterol; TG: triglyceride; LDL-C: low-density lipoprotein cholesterol.
After adjusting for age, sex, cigarette smoking status, and alcohol consumption status, our study showed an association between the frequency of fish and shellfish consumption and BHg. We also observed that BHg increased significantly as fish or shellfish intake increased (Table 6).
Table 6
Concentrations of blood mercury according to the frequency of fish and shellfish intake
DISCUSSION
In this study, the GM of blood mercury concentration in adults in their 50s was 3.30 μg/L, which was 1.72 times higher than that of those in their 20s (1.91 μg/L). Moreover, as age increased, BHg tended to increase. An increase in heavy metal concentrations in the blood with increasing age is due to the strong accumulating nature of heavy metals in the body and the delay in emission time due to the degradation of the organs with increasing age [23]. In this study, an increasing trend in BHg with age was apparent until a peak was reached for respondents in their 50s, after which a decreased blood mercury concentration was observed in respondents in their 60s. This result was similar to that of a previous study [24].
In this study, the GMs of blood mercury concentration were 3.23 μg/dL in males and 2.29 μg/dL in females. This higher blood mercury concentration in males was also observed in the NHANES 2009–2010 results in the United States (males, 0.88 μg/dL; females, 0.85 μg/dL) [25]; however, this difference was more pronounced in Korea compared to that in the United States.
The association between mercury concentrations and dyslipidemia has not yet been fully established and remains controversial. A large-scale sample study representing a whole population is required to elucidate the association between mercury concentrations and dyslipidemia. Using data from KoNEHS cycle 3, which is a large-scale bio-monitoring survey, we found that total-C, HDL-C, and LDL-C levels in males and total-C, TG, and LDL-C levels in females increased significantly as BHg increased. Furthermore, correlation values and statistically significant differences between BHg and each cholesterol level were identified through multiple regression analysis, after controlling for variables such as cigarette smoking status, alcohol consumption status, age, sex, educational level, seafood intake, and BMI. Based on these results, we found that mercury exposure can increase the risk of cardiovascular disease by changing the lipid profiles. We found that total-C, TG, and LDL-C levels in males increased significantly as UHg increased. Kim et al. also reported that UHg significantly changed the total-C and LDL-C levels [26]. In this study, the association between BHg and lipid profiles was more pronounced than between UHg and lipid profiles.
In this study, there was a sex difference in the association between BHg and UHg and dyslipidemia. The association between mercury levels in the body and lipid profiles was more pronounced in males than that in females. This result may be due to the protective effect of estrogen on lipid metabolism [17].
Some studies have discussed basic mechanisms underlying the association between mercury concentrations and dyslipidemia. Mercury introduced into the human body has a high affinity for sulfhydryl groups. Therefore, mercury might deactivate various enzymatic reactions and sulfur-containing antioxidants, resulting in an increase in oxidative stress, inflammation, endothelial dysfunction, and dyslipidemia [7]. Mercury-induced oxidative damage might reduce the activity of antioxidants such as glutathione peroxidase and cause lipid peroxidation, inflammation, and endothelial cell damage [27]. Animal experiments have also shown that mercury causes oxidative stress through catalyzing reactions that produce reactive oxygen species [28]. The thiol and selenol groups of antioxidants (such as glutathione) or enzymes (such as glutathione peroxidase) can interact with mercury, indirectly resulting in oxidative stress [29,30].
Another mechanism of association is that mercury can deactivate paraoxonase-1 (PON1), which is located in HDL-C, and can change lipid metabolic mechanisms [31,32,33]. Several studies have shown that mercury and other toxic metals can inhibit PON1 activity [34,35,36]. In animal experiments, the incidence of atherosclerosis increased from 50% to 71% in mice lacking the PON1 gene compared to wild-type mice [31]. This result indicates that PON1 inhibited LDL oxidization and prevented atherosclerosis. In a prospective cohort study in Finland, high mercury concentrations were found to be associated with immune compounds containing oxidized LDL and with the risk of coronary heart disease [5].
The GM of blood mercury concentration in this study was 2.71 μg/L, which was lower than those reported in the 1st KoNEHS (3.08 μg/L) and in the 2nd KoNEHS (3.11 μg/L) [4]. However, it was still higher than the mean blood mercury concentration reported in the NHANES (2009–2010, 1.04 μg/L) and in the Canadian Health Measures Survey cycle 3 (2012–2013, 0.79 μg/L) [25,37]. In this study, the GM of BHg was not higher than the HBM I threshold of 5 μg/L; however, the number of samples above the threshold was 626 (19.4%). For a value above the HBM I threshold, the effects of mercury on health cannot be excluded [38]. The proportion of samples above the HBM II threshold (15 μg/L) was 1.5% and was lower than that reported previously. Previous KNHANES results showed that the proportions of people above the HBM I threshold were 42.84%, 35.83%, and 33.05% in 2008, 2009, and 2010, respectively, and the proportion of those above the HBM II threshold were 3.33%, 2,68%, and 1.86% in 2008, 2009, and 2010, respectively [39]. The number of people above this international standard continues to decrease steadily but remains high compared to other developed countries.
The ratio exceeding the HBM threshold remains high in Korea. The reason for Koreans having higher BHg than those in other developed countries is related to seafood consumption [24,40]. In a study that analyzed data from the 4th KNHANES, BHg were significantly related to the frequency of seafood intake, but lead and cadmium levels were less strongly associated [41]. Liu et al. [42] reported that Asian populations including Koreans have higher mercury concentrations than non-Asian populations in the United States, and that seafood intake is related to this. Additionally, Ilmiawati et al. [43] reported that high blood mercury level of Japanese population can be explained by frequent intake of predatory fish. In this study, we found that as fish and shellfish consumption increased, blood mercury tended to increase significantly, a result consistent with the results of previous studies (Table 6) [14,44,45,46]. These findings support the assumption that an increasing frequency of seafood consumption causes mercury accumulation in the body and changes lipid profiles.
Previous studies regarding the risk of stroke and fish consumption that included cohort surveys involving 5,200 Americans reported that as fish consumption increased, the risk of cardiovascular disease decreased [47,48] because of higher levels of unsaturated fatty acids such as omega-3 and long-chain n-3 polyunsaturated fatty acids (PUFAs). Diets rich in seafood are known to have a positive effect on preventing cardiovascular diseases [19,49,50,51].
The association between body mercury content and dyslipidemia depends not only on unsaturated fatty acids but also on selenium levels. Selenium forms an inactive substance with metal and prevents metal-induced oxidative damage [52]. Methyl mercury reduces glutathione, whereas selenium present in seawater is a component of glutathione peroxidase that dilutes the toxicity of methyl mercury [53]. In Kim et al.'s study, there was a significant association between mercury concentrations and abnormal lipid profiles in groups with lower levels of stored selenium; however, there was no association in groups with selenium levels above a certain level [53]. Although marine food is a source of exposure to methyl mercury, a diet rich in selenium and n-3 PUFAs may offset the risks involved with methyl mercury [32].
Based on previous findings, Korean seafood consumption habits reduce the prevalence of cardiovascular disease. However, excessive consumption could increase the probability of mercury accumulation in the body and induce dyslipidemia, a risk factor for cardiovascular disease. Therefore, it is important to inform people that mercury exposure can be a risk factor for dyslipidemia. Moreover, establishing a standard for the consumption of seafood is required as seafood is known to contain high mercury concentrations.
We adjusted not only for age, sex, smoking, alcohol, BMI, and educational level, which were all statistically significant in the univariate analysis, but also for seafood intake, to better evaluate the association between mercury concentration and lipid profiles. Seafood consumption habits might be a confounding factor affecting the risk of dyslipidemia. Therefore, seafood consumption habits and the main routes of mercury exposure must be assessed. After controlling for all relevant variables including seafood intake, we found that blood mercury significantly affected total-C, HDL-C, and LDL-C levels. As mentioned above, the association between body mercury and dyslipidemia depends on selenium levels. Therefore, future studies will need to adjust for the confounding effects of selenium.
This study analyzed bio-monitoring results for population groups representing the Korean population, and one of the strengths of the study was that generalizing the association between mercury and dyslipidemia was readily achievable. Previous studies assessing the association between mercury concentrations and lipid profiles in Korean adult populations have used data from 477 individuals by You et al. [15], 521 by Park and Seo [54], and 236 by Hong et al. [55], whereas our study was conducted using the data obtained from 3,228 individuals. Obtaining a large population sample size enhances the importance of our study in demonstrating the association between mercury and lipid metabolism. Our results are likely to be reliable as the survey from which the data were obtained was conducted by government agencies and comprised a large number of people.
Regarding our study results, the proportion of samples above the HBM I threshold of 5 μg/L was 19.4%, whereas that above the HBM II threshold of 15 μg/L was 1.5%. In a previous study, the distribution of BHg was insufficient for identifying an association between mercury concentrations and the risk of dyslipidemia (1.48–45.54 μg/L) [15]. However, in this study, blood mercury levels ranged from 0.24 to 63.16 μg/L. As such, a further strength of our study involved our analysis of the capacity-response relationship, because there were several samples with high concentration levels above those of the international standards, and the wide distribution range of mercury concentrations.
This study had some limitations. The KoNEHS cycle 3 questioned individuals concerning their frequency of fish and shellfish intake; therefore, the exact amount of fish consumption cannot be verified. Thus, in further studies concerning the association between fish consumption and mercury concentrations, a more precise method is required, for example, a meal diary to obtain more accurate information. In this study, the LDL-C level was an estimated figure calculated from specific equations, and actual measurements are required in future studies to obtain more accurate results without missing values.
CONCLUSIONS
In conclusion, mercury concentrations among Koreans, due to their fish and shellfish eating habits, were found to be higher than those in other countries. As BHg increased, total-C, HDL-C, and LDL-C levels in males and total-C, LDL-C, and TG levels in females tended to increase. As UHg increased, total-C, TG, and LDL-C levels in males increased. Therefore, a national guidance program is required concerning the danger of mercury exposure as a risk factor for dyslipidemia. Further studies are required to establish the causal association between mercury concentrations and dyslipidemia.
Abbreviations
KoNEHS
Korean National Environmental Health Survey
Total-C
total cholesterol
HDL-C
high-density lipoprotein cholesterol
LDL-C
low-density lipoprotein cholesterol
TG
triglyceride
KNHANES
Korean National Health and Nutrition Examination Survey
QC
quality control
SD
standard deviation
BMI
body mass index
LOESS
locally estimated scatterplot smoothing
IRB
Institutional Review Board
HBM
human bio-monitoring
PON1
paraoxonase-1
PUFA
polyunsaturated fatty acid
GM
geometric mean
AM
arithmetic mean
CI
confidence interval
BHg
blood mercury concentrations
UHg
urine mercury concentrations
SE
standard error
-
Funding: This work was supported by the 2019 Yeungnam University Research Grants.
-
Competing interests: The authors declare that they have no competing interests.
-
Availability of data and materials: This study used data from the 3rd KoNEHS (2015–2017), which was conducted by the National Institute of Environmental Research of Korea.
-
Author Contributions:
NOTES
- 1. You CH, Kim BG, Jo EM, Kim GY, Yu BC, Hong MG, et al. The relationship between the fish consumption and blood total/methyl-mercury concentration of costal area in Korea. Neurotoxicology 2012;33(4):676–682. 22525937.ArticlePubMed
- 2. Kim JA, Yuk DH, Park Y, Choi HJ, Kim YC, Kim MS. A study on total mercury and methylmercury in commercial tuna, billfish, and deep-sea fish in Seoul metropolitan city. Korean J Food Sci Technol 2013;45(3):376–381.Article
- 3. Kim MK, Zoh KD. Fate and transport of mercury in environmental media and human exposure. J Prev Med Public Health 2012;45(6):335–343. 23230463.ArticlePubMedPMC
- 4. Choi W, Kim S, Baek YW, Choi K, Lee K, Kim S, et al. Exposure to environmental chemicals among Korean adults-updates from the second Korean National Environmental Health Survey (2012–2014). Int J Hyg Environ Health 2017;220(2 Pt A):29–35.Article
- 5. Yoshizawa K, Rimm EB, Morris JS, Spate VL, Hsieh CC, Spiegelman D, et al. Mercury and the risk of coronary heart disease in men. N Engl J Med 2002;347(22):1755–1760. 12456851.ArticlePubMed
- 6. Choi AL, Weihe P, Budtz-Jørgensen E, Jørgensen PJ, Salonen JT, Tuomainen TP, et al. Methylmercury exposure and adverse cardiovascular effects in Faroese whaling men. Environ Health Perspect 2009;117(3):367–372. 19337510.ArticlePubMedPMC
- 7. Houston MC. Role of mercury toxicity in hypertension, cardiovascular disease, and stroke. J Clin Hypertens (Greenwich) 2011;13(8):621–627. 21806773.ArticlePubMedPMC
- 8. Salonen JT, Seppänen K, Lakka TA, Salonen R, Kaplan GA. Mercury accumulation and accelerated progression of carotid atherosclerosis: a population-based prospective 4-year follow-up study in men in eastern Finland. Atherosclerosis 2000;148(2):265–273. 10657561.ArticlePubMed
- 9. Wiggers GA, Peçanha FM, Briones AM, Pérez-Girón JV, Miguel M, Vassallo DV, et al. Low mercury concentrations cause oxidative stress and endothelial dysfunction in conductance and resistance arteries. Am J Physiol Heart Circ Physiol 2008;295(3):H1033–H1043. 18599595.ArticlePubMed
- 10. Shin HY, Lee JY, Kim JE, Lee S, Youn H, Kim H, et al. Cause-of-death statistics in 2016 in the Republic of Korea. J Korean Med Assoc 2018;61(9):573–584.ArticlePDF
- 11. Yusuf S, Reddy S, Ôunpuu S, Anand S. Global burden of cardiovascular diseases: part I: general considerations, the epidemiologic transition, risk factors, and impact of urbanization. Circulation 2001;104(22):2746–2753. 11723030.ArticlePubMed
- 12. Khot UN, Khot MB, Bajzer CT, Sapp SK, Ohman EM, Brener SJ, et al. Prevalence of conventional risk factors in patients with coronary heart disease. JAMA 2003;290(7):898–904. 12928466.ArticlePubMed
- 13. Steinberg D, Parthasarathy S, Carew TE, Khoo JC, Witztum JL. Beyond cholesterol. Modifications of low-density lipoprotein that increase its atherogenicity. N Engl J Med 1989;320(14):915–924. 2648148.ArticlePubMed
- 14. Salonen JT, Seppänen K, Nyyssönen K, Korpela H, Kauhanen J, Kantola M, et al. Intake of mercury from fish, lipid peroxidation, and the risk of myocardial infarction and coronary, cardiovascular, and any death in eastern Finnish men. Circulation 1995;91(3):645–655. 7828289.ArticlePubMed
- 15. You CH, Kim BG, Kim JM, Yu SD, Kim YM, Kim RB, et al. Relationship between blood mercury concentration and waist-to-hip ratio in elderly Korean individuals living in coastal areas. J Prev Med Public Health 2011;44(5):218–225. 22020187.ArticlePubMedPMC
- 16. Lim S, Choi MC, Joh KO, Paek D. The health effects of mercury on the cardiac autonomic activity according to the heart rate variability. Korean J Occup Environ Med 2008;20(4):302–313.PDF
- 17. Cho HW, Kim SH, Park MJ. An association of blood mercury levels and hypercholesterolemia among Korean adolescents. Sci Total Environ 2020;709:135965. 31927427.PubMed
- 18. Oh JS, Lee SH. Pb, Hg and Cd concentration of blood and exposure-related factors. J Korea Acad Ind Coop Soc 2015;16(3):2089–2099.Article
- 19. Lee BK, Kim Y. Blood cadmium, mercury, and lead and metabolic syndrome in South Korea: 2005–2010 Korean National Health and Nutrition Examination Survey. Am J Ind Med 2013;56(6):682–692. 22911659.ArticlePubMed
- 20. Yoo JY, Kim SY, Kwon YM, Jung SK, Lee CW, Yoo SD. The third Korean National Environmental Health Survey manual for the analysis of environmentally harmful substances in biological samples: heavy metals. Incheon: National Institute of Environmental Research; 2018.
- 21. Yoo JY, Kim SY, Hong SY, Lee CW. The third Korean National Environmental Health Survey manual for the analysis of laboratory tests in biological samples. Incheon: National Institute of Environmental Research; 2019.
- 22. Yoo JY, Kim SY, Joo YK, Jeon HR, Lee CW. The third Korean National Environmental Health Survey guidelines for using raw data (revised). Incheon: National Institute of Environmental Research; 2019.
- 23. Shin JY, Kim JM, Kim Y. The association of heavy metals in blood, fish consumption frequency, and risk of cardiovascular diseases among Korean adults: the Korean National Health and Nutrition Examination Survey (2008–2010). Korean J Nutr 2012;45(4):347–361.
- 24. Lee JW, Lee CK, Moon CS, Choi IJ, Lee KJ, Yi SM, et al. Korea national survey for environmental pollutants in the human body 2008: heavy metals in the blood or urine of the Korean population. Int J Hyg Environ Health 2012;215(4):449–457. 22341685.ArticlePubMed
- 25. Centers for Disease Control and Prevention. Fourth national report on human exposure to environmental chemicals. 2013;Accessed 10 October 2019]. http://www.cdc.gov/exposurereport/.
- 26. Kim DS, Lee EH, Yu SD, Cha JH, Ahn SC. Heavy metal as risk factor of cardiovascular disease--an analysis of blood lead and urinary mercury. J Prev Med Public Health 2005;38(4):401–407. 16358824.PubMed
- 27. Grotto D, de Castro MM, Barcelos GR, Garcia SC, Barbosa F Jr. Low level and sub-chronic exposure to methylmercury induces hypertension in rats: nitric oxide depletion and oxidative damage as possible mechanisms. Arch Toxicol 2009;83(7):653–662. 19468715.ArticlePubMedPDF
- 28. Lin TH, Huang YL, Huang SF. Lipid peroxidation in liver of rats administrated with methyl mercuric chloride. Biol Trace Elem Res 1996;54(1):33–41. 8862759.ArticlePubMedPDF
- 29. Carvalho CM, Chew EH, Hashemy SI, Lu J, Holmgren A. Inhibition of the human thioredoxin system. A molecular mechanism of mercury toxicity. J Biol Chem 2008;283(18):11913–11923. 18321861.PubMed
- 30. Khan MAK, Wang F. Mercury-selenium compounds and their toxicological significance: toward a molecular understanding of the mercury-selenium antagonism. Environ Toxicol Chem 2009;28(8):1567–1577. 19374471.PubMed
- 31. Shih DM, Xia YR, Wang XP, Miller E, Castellani LW, Subbanagounder G, et al. Combined serum paraoxonase knockout/apolipoprotein E knockout mice exhibit increased lipoprotein oxidation and atherosclerosis. J Biol Chem 2000;275(23):17527–17535. 10748217.ArticlePubMed
- 32. Ayotte P, Carrier A, Ouellet N, Boiteau V, Abdous B, Sidi EA, et al. Relation between methylmercury exposure and plasma paraoxonase activity in inuit adults from Nunavik. Environ Health Perspect 2011;119(8):1077–1083. 21543280.ArticlePubMedPMC
- 33. Pollack AZ, Sjaarda L, Ahrens KA, Mumford SL, Browne RW, Wactawski-Wende J, et al. Association of cadmium, lead and mercury with paraoxonase 1 activity in women. PLoS One 2014;9(3):e92152. 24682159.PubMedPMC
- 34. Gonzalvo MC, Gil F, Hernández AF, Villanueva E, Pla A. Inhibition of paraoxonase activity in human liver microsomes by exposure to EDTA, metals and mercurials. Chem Biol Interact 1997;105(3):169–179. 9291995.ArticlePubMed
- 35. Gençer N, Arslan O. Purification human PON1Q192 and PON1R192 isoenzymes by hydrophobic interaction chromatography and investigation of the inhibition by metals. J Chromatogr B Analyt Technol Biomed Life Sci 2009;877(3):134–140.ArticlePubMed
- 36. Costa LG, Vitalone A, Cole TB, Furlong CE. Modulation of paraoxonase (PON1) activity. Biochem Pharmacol 2005;69(4):541–550. 15670573.ArticlePubMed
- 37. Haines DA, Saravanabhavan G, Werry K, Khoury C. An overview of human biomonitoring of environmental chemicals in the Canadian Health Measures Survey: 2007–2019. Int J Hyg Environ Health 2017;220(2 Pt A):13–28. 27601095.ArticlePubMed
- 38. Schulz C, Wilhelm M, Heudorf U, Kolossa-Gehring M. Human Biomonitoring Commission of the German Federal Environment Agency. Update of the reference and HBM values derived by the German Human Biomonitoring Commission. Int J Hyg Environ Health 2011;215(1):26–35. 21820957.ArticlePubMed
- 39. Seo JW, Kim BG, Kim YM, Kim RB, Chung JY, Lee KM, et al. Trend of blood lead, mercury, and cadmium levels in Korean population: data analysis of the Korea National Health and Nutrition Examination Survey. Environ Monit Assess 2015;187(3):146. 25716526.ArticlePubMedPDF
- 40. Hightower JM, O'Hare A, Hernandez GT. Blood mercury reporting in NHANES: identifying Asian, Pacific Islander, Native American, and multiracial groups. Environ Health Perspect 2006;114(2):173–175. 16451850.ArticlePubMed
- 41. Kim YA, Kim YN, Cho KD, Kim MY, Kim EJ, Baek OH, et al. Blood heavy metal concentrations of Korean adults by seafood consumption frequency: using the fourth Korea National Health and Nutrition Examination Survey (KNHANES IV), 2008. Korean J Nutr 2011;44(6):518–526.Article
- 42. Liu Y, Buchanan S, Anderson HA, Xiao Z, Persky V, Turyk ME. Association of methylmercury intake from seafood consumption and blood mercury level among the Asian and Non-Asian populations in the United States. Environ Res 2018;160:212–222. 29020643.ArticlePubMed
- 43. Ilmiawati C, Yoshida T, Itoh T, Nakagi Y, Saijo Y, Sugioka Y, et al. Biomonitoring of mercury, cadmium, and lead exposure in Japanese children: a cross-sectional study. Environ Health Prev Med 2015;20(1):18–27. 25293698.ArticlePubMedPMCPDF
- 44. Eun JK, Lee WS. Mercury contents of human scalp hair by the consumption pattern in fish. Korean J Sanit 2000;15(3):8–14.
- 45. Vupputuri S, Longnecker MP, Daniels JL, Guo X, Sandler DP. Blood mercury level and blood pressure among US women: results from the National Health and Nutrition Examination Survey 1999–2000. Environ Res 2005;97(2):195–200. 15533335.ArticlePubMed
- 46. Wennberg M, Bergdahl IA, Stegmayr B, Hallmans G, Lundh T, Skerfving S, et al. Fish intake, mercury, long-chain n-3 polyunsaturated fatty acids and risk of stroke in northern Sweden. Br J Nutr 2007;98(5):1038–1045. 17537290.ArticlePubMed
- 47. Mozaffarian D, Longstreth WT Jr, Lemaitre RN, Manolio TA, Kuller LH, Burke GL, et al. Fish consumption and stroke risk in elderly individuals: the cardiovascular health study. Arch Intern Med 2005;165(2):200–206. 15668367.ArticlePubMedPMC
- 48. Iso H, Rexrode KM, Stampfer MJ, Manson JE, Colditz GA, Speizer FE, et al. Intake of fish and omega-3 fatty acids and risk of stroke in women. JAMA 2001;285(3):304–312. 11176840.ArticlePubMed
- 49. Kris-Etherton PM, Harris WS, Appel LJ. American Heart Association Nutrition Committee. Fish consumption, fish oil, omega-3 fatty acids, and cardiovascular disease. Circulation 2002;106(21):2747–2757. 12438303.ArticlePubMed
- 50. König A, Bouzan C, Cohen JT, Connor WE, Kris-Etherton PM, Gray GM, et al. A quantitative analysis of fish consumption and coronary heart disease mortality. Am J Prev Med 2005;29(4):335–346. 16242600.PubMed
- 51. Ström S, Helmfrid I, Glynn A, Berglund M. Nutritional and toxicological aspects of seafood consumption--an integrated exposure and risk assessment of methylmercury and polyunsaturated fatty acids. Environ Res 2011;111(2):274–280. 21211794.ArticlePubMed
- 52. Flores-Mateo G, Navas-Acien A, Pastor-Barriuso R, Guallar E. Selenium and coronary heart disease: a meta-analysis. Am J Clin Nutr 2006;84(4):762–773. 17023702.ArticlePubMedPMC
- 53. Park K, Seo E. Toenail mercury and dyslipidemia: Interaction with selenium. J Trace Elem Med Biol 2017;39:43–49. 27908422.ArticlePubMed
- 54. Park K, Seo E. Association between toenail mercury and metabolic syndrome is modified by selenium. Nutrients 2016;8(7):E424. 27420091.ArticlePubMedPMC
- 55. Hong D, Cho SH, Park SJ, Kim SY, Park SB. Hair mercury level in smokers and its influence on blood pressure and lipid metabolism. Environ Toxicol Pharmacol 2013;36(1):103–107. 23603462.ArticlePubMed
REFERENCES
REFERENCES
Figure & Data
REFERENCES
Citations
Citations to this article as recorded by 
- Serum free fatty acids mediate the association between metal elements and cardiometabolic diseases
Yayuan Mei, Zheyuan Liu, Xiaobao Chen, Yuhan Liu, Shenglan Ke, Yutong Wang, Wanyi Liu, Xiran Yang, Hui Xu, Ang Li, Weitao Su
Ecotoxicology and Environmental Safety.2026; 316: 120146. CrossRef - Re-thinking the link between exposure to mercury and blood pressure
Xue Feng Hu, Allison Loan, Hing Man Chan
Archives of Toxicology.2025; 99(2): 481. CrossRef - Do blood metals influence lipid profiles? Findings of a cross-sectional population-based survey
Sabit Cakmak, Kimberly Mitchell, Anna Lukina, Robert Dales
Environmental Research.2023; 231: 116107. CrossRef - Association of Blood Total Mercury with Dyslipidemia in a sample of U.S. Adolescents: Results from the National Health and Nutrition Examination Survey Database, 2011–2018
Chibuzor Abasilim, Victoria Persky, Mary E. Turyk
Hygiene and Environmental Health Advances.2023; 6: 100047. CrossRef - Association of Blood Mercury Level with Liver Enzymes in Korean Adults: An Analysis of 2015–2017 Korean National Environmental Health Survey
Jin-Wook Chung, Dilaram Acharya, Jitendra Kumar Singh, Joon Sakong
International Journal of Environmental Research and Public Health.2023; 20(4): 3290. CrossRef - Heavy metal-induced lipogenic gene aberration, lipid dysregulation and obesogenic effect: a review
Yang Zhou, Frank Peprah Addai, Xinshuang Zhang, Yuelin Liu, Yinfeng Wang, Feng Lin, Alex Tuffour, Jie Gu, Guangxiang Liu, Haifeng Shi
Environmental Chemistry Letters.2022; 20(3): 1611. CrossRef - Mercury may reduce the protective effect of sea fish consumption on serum triglycerides levels in Chinese adults: Evidence from China National Human Biomonitoring
Bing Wu, Yingli Qu, Yifu Lu, Saisai Ji, Liang Ding, Zheng Li, Miao Zhang, Heng Gu, Qi Sun, Bo Ying, Feng Zhao, Xulin Zheng, Yidan Qiu, Zheng Zhang, Ying Zhu, Zhaojin Cao, Yuebin Lv, Xiaoming Shi
Environmental Pollution.2022; 311: 119904. CrossRef - Misuse of Cardiac Lipid upon Exposure to Toxic Trace Elements—A Focused Review
Kaviyarasi Renu, Anirban Goutam Mukherjee, Uddesh Ramesh Wanjari, Sathishkumar Vinayagam, Vishnu Priya Veeraraghavan, Balachandar Vellingiri, Alex George, Ricardo Lagoa, Kamaraj Sattu, Abhijit Dey, Abilash Valsala Gopalakrishnan
Molecules.2022; 27(17): 5657. CrossRef - The effects of chemical mixtures on lipid profiles in the Korean adult population: threshold and molecular mechanisms for dyslipidemia involved
Hai Duc Nguyen, Hojin Oh, Min-Sun Kim
Environmental Science and Pollution Research.2022; 29(26): 39182. CrossRef - Association between Heavy Metal Exposure and Dyslipidemia among Korean Adults: From the Korean National Environmental Health Survey, 2015–2017
Do-won Kim, Jeongwon Ock, Kyong-Whan Moon, Choong-Hee Park
International Journal of Environmental Research and Public Health.2022; 19(6): 3181. CrossRef
 Cite
Cite- Figure
-
- Related articles
-
- Association between heavy metal exposure and high-sensitivity C-reactive protein in the elderly: Korea National Health and Nutrition Examination Survey (KNHANES) 2016–2017
- Association between outdoor clothing use and serum perfluoroalkyl substances (PFAS): Korean National Environmental Health Survey cycle 4
- Relationship between the use of hair products and urine benzophenone-3: the Korean National Environmental Health Survey (KoNEHS) cycle 4
- Relationship between crustacean consumption and serum perfluoroalkyl substances (PFAS): the Korean National Environmental Health Survey (KoNEHS) cycle 4
- Association between serum perfluoroalkyl substances concentrations and non-alcoholic fatty liver disease among Korean adults: a cross-sectional study using the National Environmental Health Survey cycle 4
The association between mercury concentrations and lipid profiles in the Korean National Environmental Health Survey (KoNEHS) cycle 3
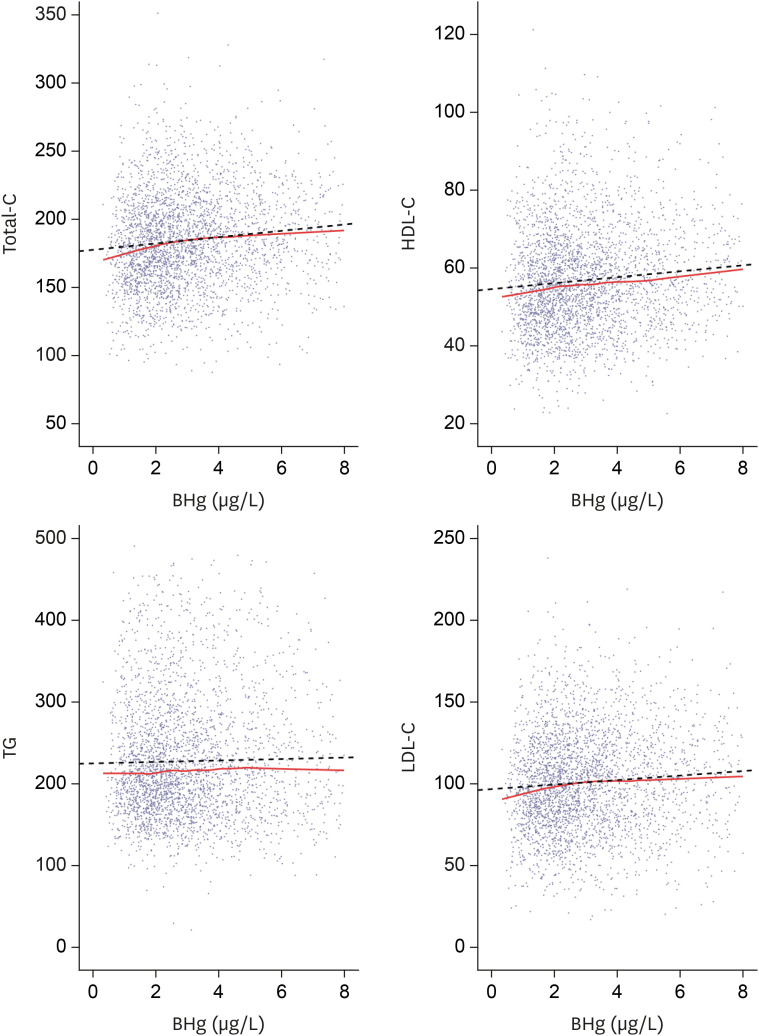
Fig. 1 Lipid profiles and blood mercury concentrations by scatter plot. Total-C, HDL-C, LDL-C show a tendency to increase according to blood mercury concentrations. Solid line represents locally estimated scatterplot smoothing. Dotted line represents regression.BHg: blood mercury concentrations; Total-C: total cholesterol; HDL-C: high-density lipoprotein cholesterol; TG: triglyceride; LDL-C: low-density lipoprotein cholesterol.
Fig. 1
The association between mercury concentrations and lipid profiles in the Korean National Environmental Health Survey (KoNEHS) cycle 3
| Variables | Total | Males | Females | |
|---|---|---|---|---|
| Total (%) | 3,228 (100) | 1,400 (43.4) | 1,828 (56.6) | |
| Age (years) | ||||
| 19–29 | 268 (8.3) | 128 (9.1) | 140 (7.7) | |
| 30–39 | 505 (15.6) | 201 (14.4) | 304 (16.6) | |
| 40–49 | 568 (17.6) | 240 (17.1) | 328 (17.9) | |
| 50–59 | 744 (23.0) | 292 (20.9) | 452 (24.7) | |
| 60–69 | 726 (22.5) | 342 (24.4) | 384 (21.0) | |
| ≥ 70 | 417 (12.9) | 197 (14.1) | 220 (12.0) | |
| BMI (kg/m2) | ||||
| < 23 | 1,147 (35.5) | 418 (29.9) | 729 (39.9) | |
| ≥ 23 and < 25 | 838 (26.0) | 384 (27.4) | 454 (24.8) | |
| ≥ 25 | 1,243 (38.5) | 598 (42.7) | 645 (35.3) | |
| Smoking | ||||
| Never smoked | 2,088 (64.7) | 348 (24.9) | 1,740 (95.2) | |
| Past smokers | 639 (19.7) | 598 (42.7) | 39 (2.1) | |
| Current smokers | 503 (15.6) | 454 (32.4) | 49 (2.7) | |
| Drinking | ||||
| Yes | 2,600 (80.5) | 1,278 (91.3) | 1,322 (72.3) | |
| No | 628 (19.5) | 122 (8.7) | 506 (27.7) | |
| Education | ||||
| High school graduation or less | 2,177 (67.4) | 896 (64.0) | 1,281 (70.1) | |
| College graduation or more | 1,051 (32.6) | 504 (36.0) | 547 (29.9) | |
| Variables | No. | BHg (µg/L) | UHg (µg/L) | |||
|---|---|---|---|---|---|---|
| GM (95% CI) | AM (95% CI) | GM (95% CI) | AM (95% CI) | |||
| Total | 3,228 | 2.71 (2.59–2.85) | 2.91 (2.81–3.02) | 0.35 (0.33–0.38) | 0.52 (0.48–0.56) | |
| Sex | ||||||
| Male | 1,400 | 3.23 (3.01–3.47) | 4.14 (3.86–4.42) | 0.40 (0.37–0.43) | 0.57 (0.52–0.62) | |
| Female | 1,828 | 2.29 (2.19–2.40) | 2.73 (2.59–2.87) | 0.32 (0.30–0.34) | 0.47 (0.43–0.52) | |
| p-value | < 0.001 | < 0.001 | < 0.001 | 0.002 | ||
| Age (years) | ||||||
| 19–29 | 268 | 1.91 (1.72–2.13) | 2.26 (2.04–2.48) | 0.33 (0.29–0.38) | 0.49 (0.38–0.59) | |
| 30–39 | 505 | 2.87 (2.66–3.10) | 3.51 (3.19–3.83) | 0.40 (0.36–0.45) | 0.58 (0.51–0.65) | |
| 40–49 | 568 | 2.96 (2.78–3.16) | 3.62 (3.34–3.90) | 0.37 (0.34–0.40) | 0.54 (0.47–0.61) | |
| 50–59 | 744 | 3.30 (3.09–3.52) | 4.17 (3.78–4.56) | 0.38 (0.35–0.42) | 0.55 (0.49–0.61) | |
| 60–69 | 726 | 3.07 (2.82–3.34) | 3.93 (3.56–4.30) | 0.33 (0.30–0.36) | 0.48 (0.42–0.54) | |
| ≥ 70 | 417 | 2.39 (2.14–2.69) | 3.08 (2.67–3.49) | 0.28 (0.25–0.32) | 0.41 (0.35–0.47) | |
| p-value | < 0.001 | < 0.001 | < 0.001 | 0.001 | ||
| BMI (kg/m2) | ||||||
| < 23 | 1,147 | 2.29 (2.16–2.44) | 2.83 (2.65–3.00) | 0.32 (0.30–0.34) | 0.48 (0.43–0.53) | |
| ≥ 23 and < 25 | 838 | 2.94 (2.75–3.14) | 3.67 (3.39–3.95) | 0.35 (0.32–0.38) | 0.49 (0.44–0.54) | |
| ≥ 25 | 1,243 | 3.09 (2.92–3.27) | 3.91 (3.63–4.18) | 0.40 (0.37–0.44) | 0.59 (0.52–0.65) | |
| p-value | < 0.001 | < 0.001 | < 0.001 | 0.008 | ||
| Smoking | ||||||
| Never smoked | 2,088 | 2.37 (2.26–2.48) | 2.64 (2.53–2.74) | 0.33 (0.31–0.35) | 0.47 (0.43–0.51) | |
| Past smoker | 637 | 3.56 (3.32–3.82) | 3.53 (3.31–3.74) | 0.42 (0.38–0.46) | 0.62 (0.55–0.70) | |
| Current smoker | 503 | 3.29 (2.97–3.65) | 3.32 (3.06–3.57) | 0.40 (0.36–0.45) | 0.59 (0.50–0.68) | |
| p-value | < 0.001 | < 0.001 | < 0.001 | 0.003 | ||
| Drinking | ||||||
| Yes | 2,600 | 2.77 (2.27–2.60) | 3.50 (3.31–3.69) | 0.36 (0.34–0.39) | 0.54 (0.49–0.58) | |
| No | 628 | 2.43 (2.27–2.60) | 2.94 (2.72–3.15) | 0.31 (0.29–0.34) | 0.43 (0.38–0.47) | |
| p-value | < 0.001 | < 0.001 | 0.001 | < 0.001 | ||
| Education | ||||||
| High school graduation or less | 2,177 | 2.61 (2.45–2.78) | 3.32 (3.09–3.55) | 0.34 (0.32–0.37) | 0.49 (0.45–0.54) | |
| College graduation or more | 1,051 | 2.87 (2.71–3.02) | 3.56 (3.31–3.80) | 0.37 (0.35–0.40) | 0.56 (0.50–0.62) | |
| p-value | 0.012 | < 0.001 | 0.050 | 0.274 | ||
| Variables | Total-C | HDL-C | TG | LDL-C | |
|---|---|---|---|---|---|
| Blood mercury levels in males | |||||
| Q1 (0.430–2.249) (n = 350) | 173.25 ± 3.57 | 50.61 ± 0.88 | 158.01 ± 5.91 | 91.03 ± 3.25 | |
| Q2 (2.249–3.437) (n = 350) | 183.97 ± 2.25 | 52.90 ± 1.10 | 165.70 ± 4.74 | 97.93 ± 2.14 | |
| Q3 (3.437–5.437) (n = 350) | 186.88 ± 2.27 | 52.21 ± 0.80 | 163.77 ± 5.90 | 101.91 ± 2.12 | |
| Q4 (5.437+) (n = 350) | 193.06 ± 2.03 | 54.28 ± 0.99 | 174.66 ± 5.57 | 103.84 ± 1.94 | |
| p-value | < 0.001 | 0.029 | 0.261 | 0.006 | |
| p for trend | < 0.001 | 0.013 | 0.074 | 0.001 | |
| Urine mercury levels in males | |||||
| Q1 (0.070–0.220) (n = 352) | 174.31 ± 3.11 | 52.27 ± 1.00 | 146.76 ± 5.65 | 92.69 ± 2.87 | |
| Q2 (0.220–0.390) (n = 356) | 181.40 ± 2.34 | 52.85 ± 0.84 | 176.51 ± 6.16 | 93.25 ± 2.29 | |
| Q3 (0.390–0.710) (n = 348) | 188.80 ± 2.77 | 52.13 ± 0.78 | 168.63 ± 5.00 | 102.94 ± 2.67 | |
| Q4 (0.710+) (n = 344) | 190.32 ± 2.35 | 52.29 ± 1.18 | 167.79 ± 5.84 | 104.47 ± 2.05 | |
| p-value | < 0.001 | 0.931 | 0.002 | < 0.001 | |
| P for trend | < 0.001 | 0.887 | 0.042 | < 0.001 | |
| Blood mercury levels in females | |||||
| Q1 (0.330–1.690) (n = 457) | 180.60 ± 2.13 | 60.65 ± 0.79 | 124.45 ± 4.15 | 95.06 ± 1.99 | |
| Q2 (1.690–2.402) (n = 457) | 183.81 ± 1.88 | 62.20 ± 0.97 | 128.64 ± 4.58 | 95.89 ± 1.56 | |
| Q3 (2.402–3.593) (n = 457) | 188.29 ± 2.17 | 60.19 ± 0.85 | 136.72 ± 4.38 | 100.75 ± 1.78 | |
| Q4 (3.593+) (n = 457) | 191.69 ± 1.98 | 61.95 ± 1.21 | 143.10 ± 4.67 | 101.12 ± 1.90 | |
| p-value | 0.001 | 0.327 | 0.018 | 0.019 | |
| p for trend | < 0.001 | 0.654 | 0.002 | 0.009 | |
| Urine mercury levels in females | |||||
| Q1 (0.070–0.190) (n = 491) | 183.45 ± 1.85 | 62.08 ± 0.80 | 133.67 ± 4.31 | 94.64 ± 1.78 | |
| Q2 (0.190–0.320) (n = 442) | 185.91 ± 2.21 | 61.37 ± 1.00 | 130.75 ± 4.02 | 98.39 ± 1.91 | |
| Q3 (0.320–0.580) (n = 448) | 185.45 ± 1.86 | 59.95 ± 1.01 | 135.27 ± 4.56 | 98.44 ± 1.62 | |
| Q4 (0.580+) (n = 447) | 187.94 ± 2.06 | 61.23 ± 1.03 | 129.34 ± 3.96 | 100.84 ± 1.72 | |
| p-value | 0.506 | 0.402 | 0.766 | 0.123 | |
| p for trend | 0.182 | 0.280 | 0.654 | 0.025 | |
| Variables | Total-C | HDL-C | TG | LDL-C | ||||||||
|---|---|---|---|---|---|---|---|---|---|---|---|---|
| β | SE | p-value | β | SE | p-value | β | SE | p-value | β | SE | p-value | |
| Age | 0.142 | 0.063 | 0.025 | −0.086 | 0.023 | < 0.001 | 0.369 | 0.128 | 0.005 | 0.154 | 0.053 | 0.004 |
| Sex | 9.314 | 3.109 | 0.003 | 9.885 | 0.803 | < 0.001 | −19.518 | 4.540 | < 0.001 | 3.333 | 2.932 | 0.257 |
| Smoking | 4.257 | 3.034 | 0.162 | 1.203 | 1.005 | 0.233 | 7.792 | 5.146 | 0.132 | 1.496 | 2.753 | 0.587 |
| Alcohol | 1.897 | 2.078 | 0.363 | 4.069 | 0.724 | < 0.001 | −5.305 | 5.360 | 0.324 | −1.111 | 1.764 | 0.529 |
| Seafood intake | 0.796 | 2.889 | 0.783 | 1.130 | 0.895 | 0.208 | 0.893 | 5.858 | 0.879 | −0.513 | 2.279 | 0.822 |
| BMI | 1.091 | 0.250 | < 0.001 | −1.163 | 0.092 | < 0.001 | 7.537 | 0.530 | < 0.001 | 0.747 | 0.210 | < 0.001 |
| Education level | 2.869 | 1.788 | 0.110 | 1.152 | 0.719 | 0.111 | −1.813 | 3.867 | 0.640 | 2.080 | 1.637 | 0.206 |
| BHg (µg/L) | 2.927 | 0.580 | < 0.001 | 0.835 | 0.409 | < 0.001 | 0.647 | 1.082 | 0.551 | 1.962 | 0.509 | < 0.001 |
| Variables | No. | Total-C | HDL-C | TG | LDL-C | |
|---|---|---|---|---|---|---|
| HBM I | ||||||
| < 5 | 2,602 (80.6) | 182.95 ± 1.01 | 56.97 ± 0.46 | 144.98 ± 2.25 | 96.99 ± 0.91 | |
| ≥ 5 | 626 (19.4) | 192.82 ± 1.79 | 56.31 ± 0.92 | 165.11 ± 4.21 | 103.48 ± 1.62 | |
| p-value | < 0.001 | 0.502 | < 0.001 | < 0.001 | ||
| HBM II | ||||||
| < 15 | 3,178 (98.5) | 184.65 ± 0.94 | 56.89 ± 0.44 | 148.19 ± 2.10 | 98.13 ± 0.84 | |
| ≥ 15 | 50 (1.5) | 183.02 ± 6.47 | 53.59 ± 3.62 | 172.64 ± 16.71 | 94.90 ± 5.76 | |
| p-value | 0.805 | 0.368 | 0.153 | 0.578 | ||
| Frequency of fish and shellfish intake | BHg (µg/L) | |
|---|---|---|
| Fish | Shellfish | |
| Rarely | 2.22 ± 0.26 | 2.75 ± 0.11 |
| 1/month | 2.43 ± 0.12 | 3.11 ± 0.13 |
| 2–3/month | 2.90 ± 0.12 | 3.04 ± 0.16 |
| 1/week | 3.02 ± 0.11 | 3.47 ± 0.28 |
| ≥ 2/week | 3.67 ± 0.14 | 3.52 ± 0.27 |
| p-value | < 0.001 | 0.004 |
Table 1 General characteristics of study population
Values are presented as number (%).
BMI: body mass index.
Table 2 Blood & urine mercury concentrations of study population by sex, age, BMI, smoking, drinking, education level
BMI: body mass index; BHg: blood mercury concentrations; UHg: urine mercury concentrations; GM: geometric mean; CI: confidence interval; AM: arithmetic mean.
Table 3 Blood lipid levels according to quartile groups of blood and urine mercury levels in males and females
Data are shown as mean ± standard error (mg/dL).
Total-C: total cholesterol; HDL-C: high-density lipoprotein cholesterol; TG: triglyceride; LDL-C: low-density lipoprotein cholesterol.
Table 4 Multiple regression analysis between lipid profiles and cardiovascular risk factors
Total-C: total cholesterol; HDL-C: high-density lipoprotein cholesterol; TG: triglyceride; LDL-C: low-density lipoprotein cholesterol; SE: standard error; BMI: body mass index; BHg: blood mercury concentrations.
Table 5 Lipid profiles according to HBM I, II
Data are shown as mean ± standard error (mg/dL) or number (%).
HBM: human bio-monitoring; Total-C: total cholesterol; HDL-C: high-density lipoprotein cholesterol; TG: triglyceride; LDL-C: low-density lipoprotein-cholesterol.
Table 6 Concentrations of blood mercury according to the frequency of fish and shellfish intake
Data are shown as mean ± standard error. Adjusted by age, sex, smoking and alcohol consumption.
BHg: blood mercury concentrations.

