Abstract
-
Background
Lead and cadmium have been identified as risk factors for hearing loss in animal studies, but large-scale studies targeting the general human population are rare. This study was conducted to investigate the link between heavy metal concentrations in blood and hearing impairment, using a national population-based survey.
-
Methods
The study participants comprised 6409 Koreans aged 20 or older, who were included in the Fifth and Sixth Korea National Health and Nutrition Examination Surveys (KNHANES 2010–2013). Hearing impairment was categorized into two types, low- and high-frequency hearing impairment, using pure tone audiometry. Low-frequency hearing impairment was defined as having a binaural average of hearing thresholds for 0.5, 1, and 2 kHz exceeding 25 dB, and high-frequency hearing impairment was defined as having a binaural average of hearing thresholds for 3, 4, and 6 kHz exceeding 25 dB. The blood levels of heavy metals (lead and cadmium) were classified into quartiles. Cross-sectional association between hearing impairment and the level of heavy metals (lead and cadmium) was examined in both sexes. Multivariate logistic regression was used to obtain adjusted odds ratios (ORs) and 95% confidence intervals (CIs).
-
Results
Among men, the prevalence of low- and high- frequency hearing impairment was 13.9% and 46.7%, respectively, which was higher than the prevalence among women (11.8% and 27.0%, respectively). Regarding lead, the adjusted OR of high-frequency hearing impairment for the highest blood level group versus the lowest group was significant in both men (OR = 1.629, 95% CI = 1.161–2.287) and women (OR = 1.502, 95% CI = 1.027–2.196), after adjusting for age, body mass index, education, smoking, alcohol consumption, exercise, diagnosis of diabetes mellitus, hypertension, and noise exposure (occupational, loud, firearm noises). No links were found between blood lead levels and low-frequency hearing impairment, or between blood cadmium levels and low- or high-frequency hearing impairment in either sex.
-
Conclusions
The present study findings suggest that even exposure to low-level lead is a risk factor for high-frequency hearing loss. A prospective epidemiologic study should be conducted to identify the causal relationship between human health and exposure to heavy metals, and efforts to reduce heavy metal exposure in the general population should continue.
-
Keywords:
Keywords
Hearing loss; Heavy metals; Lead; Cadmium; KNHANES
Background
Hearing impairment is one of the most common health conditions, and is increasing in aging societies [
1,
2]. According to the World Health Organization (WHO), 360 million people worldwide and approximately one third of the older population (65 years or older) suffer from hearing impairment [
3]. In a study based on the 2010–2012 Korea National Health and Nutrition Examination Surveys (KNHANES), it was estimated that people with mild hearing impairment comprise 20.5% of the population over the age of 19 years, and 70% of the population over the age of 65 years [
4]. Hearing impairment can cause social isolation due to communication problems in everyday life [
5,
6], and is a serious public health issue in Korea.
Hearing impairment tends to increase rapidly with age [
7]. Aside from aging, exposure to loud noise is a risk factor for hearing loss [
8], and ototoxic chemicals also affect hearing ability [
9–
11]. Numerous studies have reported the effect of heavy metals on hearing loss. Jones et al. argued that lead is an ototoxic heavy metal and that lead exposure results in degeneration of the inner ear receptor cells and decreases the conduction function of auditory nerve cells [
12]. Cadmium is reported to cause apoptosis of inner ear receptor cells and alter their arrangement, resulting in an increased hearing threshold [
13,
14]. Prasher suggested multiple ototoxic effects of lead and cadmium [
15]. Additionally, a limited number of epidemiologic studies have been conducted. In a study on the general population, Park et al. confirmed a link between low-level lead exposure and hearing impairment [
16]. The relationship between hearing impairment and exposure to lead and cadmium was confirmed in a study by Shargorodsky et al. of American adolescents [
17], and in a study of American adults by Choi et al. [
18].
Heavy metals, such as lead and cadmium, are present not only in factory-manufactured products, but also in the environment within air, water, food, soil, and dust [
19–
21]. Industrialization has surreptitiously exposed human bodies to heavy metal [
22]. Once heavy metal is absorbed into the body, it is stored in the tissues, because the human body has a limited capacity to effectively eliminate it, due to a half-life lasting several decades [
23]. Consequently, the link between hearing impairment and heavy metal levels requires close examination. Currently, lead and cadmium concentration levels in Korea continue to decrease but remain higher when compared to developed countries such as the United States (US) and Canada [
24]. Accordingly, the link between heavy metals and hearing impairment should be carefully monitored in Korea.
Several studies have examined the relationship between hearing impairment and heavy metals. However, the number of studies on the general population is limited and the number of epidemiologic studies conducted within the Korean population is even fewer. Accordingly, the present study was conducted to investigate the link between exposure to lead and cadmium and hearing impairment using KNHANES data.
Methods
Participants
Data from the fifth and sixth KNHANES, gathered from 2010 to 2013, was used for the analyses. The KNHANES is a multistage stratified complex design survey of a representative sample of the entire Korean population, conducted by the Korea Centers for Disease Control and Prevention. Trained interviewers and laboratory technicians conducted surveys in households, including administering questionnaires, performing health examinations, and collecting blood samples. The section for health behaviors, such as smoking and alcohol consumption, was self-administered. The total number of respondents was 33,552.
Of those, 6582 participants aged 20 years or older underwent pure tone audiometry and blood tests to assess the level of heavy metals (lead and cadmium). After excluding those with missing data, a total of 6409 participants were selected as study participants.
Hearing impairment
To examine the respondents hearing condition, pure tone audiometry was performed. Both ears were tested at 0.5, 1, 2, 3, 4, and 6 kHz, in a soundproof booth, using the Entomed SA 203. WHO defines hearing as normal if, in the better hearing ear, the average of hearing thresholds at 0.5, 1, 2, and 4 kHz is under 25 dB [
25]. Until recently, this definition has been widely used as the criterion to determine an individual’s hearing condition in everyday life. However, potential hearing impairment of one ear may be neglected when the hearing threshold is under 25 dB in the other ear. To account for this, some studies have defined hearing impairment by taking the binaural average of hearing thresholds in preference to relying on the hearing ability of one ear only [
26], while another study measured 2 types of hearing impairment, low- and high-frequency hearing impairment [
27]. Based on information from these studies, we used the binaural pure-tone average threshold and computed two binaural averages, one across 0.5, 1, and 2 kHz and the other across 3, 4, and 6 kHz to determine the low- and high-frequency thresholds. Hearing impairment was then determined according to whether an average threshold exceeded 25 dB in the respective frequency band.
To measure heavy metal blood levels, blood samples were collected into standard commercial evacuated tubes coated with sodium heparin (Vacutainer). Blood lead and cadmium levels were measured via graphite furnace atomic absorption spectrometry (Perkin Elmer AAnalyst 600, Turku, Finland). For internal quality assurance, the analytical equipment was controlled with respect to the standard reference material from Whole Blood Metals Control (BIO-RAD, USA). The blood levels of each heavy metal were classified into quartiles separately for men and women, and geometric means with standard error were computed according to the quartile rank.
Other variables
In the analysis, we included factors suggested by previous studies as affecting hearing impairment. Some studies suggested that cerebro-cardiovascular risk factors, such as obesity and smoking, have a negative effect on hearing ability [
28,
29], because the cochlea is vulnerable to ischemic changes [
30]. On the other hand, moderate exercise and moderate alcohol consumption are reported to have a beneficial effect on hearing ability [
31,
32].
Participants’ ages were grouped in 10-year intervals, starting from age 20, and participants aged 70 or higher were collectively gathered as one group. Body mass index (BMI) under 18.5 kg/m2 was classified as underweight, BMI between 18.5 and 25 kg/m2 as normal weight, and BMI over 25 kg/m2 as overweight. The education level was categorized as less than high school education; high school graduation; and more than high school education. Cigarette smoking was classified as follows: a non-smoker was defined as never having smoked more than 100 cigarettes; an ex-smoker was defined as having smoked 100 or more cigarettes but currently not smoking; and a current smoker was defined as having smoked 100 or more cigarettes and still currently smoking. Alcohol consumption was defined as: a non-drinker having never consumed alcohol, a light drinker as consuming alcohol less than twice per week or having fewer than 7 glasses (5 glasses for women) when drinking, and a heavy drinker as drinking more than twice per week or having 7 or more glasses (5 glasses for women) when drinking. Participants who performed intense physical activities 3 days or more per week and, with exercise, felt the effects of bodily exertions more than usual, or who performed intense exercises requiring heavy breathing for 30 min or more, were classified into an exercise group, and all others classified into a non-exercise group. Regarding noise exposure, participants who had been exposed to noise at their workplace over a 3-month period or exposed to loud noises such as car horns, machinery, and loud music at places other than the workplace for 5 h or more per week were classified into a noise exposure group. Those who had been exposed to firearm noise were also classified into the noise exposure group. Finally, regarding diabetes and hypertension, participants were categorized into one of two groups, respectively, depending on whether they had been diagnosed with diabetes or hypertension by a physician.
Statistical analyses
Weighted complex sampling analysis available from SPSS v.18.0 was used for data analysis. Regarding the general characteristics of participants, the mean and sample size for each variable was examined by sex. A chi-square test was performed to examine the distributions and t-tests performed to compare means. The relationship between each independent variable and hearing impairment was examined using a chi-square test. This test was conducted separately for low- and high-frequency hearing impairment and by sex. To examine sex-specific relationships between low- and high-frequency hearing impairment and heavy metal levels in blood, odds ratios (OR) were computed using complex sampling logistic regression. Statistical significance was defined as p < 0.05. In the first model, age, BMI, education, smoking, alcohol consumption, and exercise were included as adjusting variables, and in the second model, diabetes mellitus, and hypertension were additionally included as adjusting variables. The ORs in the final model were adjusted with exposures to occupational, loud, and firearm noises.
Results
Participants’ general characteristics
Participants totaled 6409, of whom 3185 (49.6%) were men and 3224 (50.4%) were women. The mean age across all participants was 47; the mean age for men was 46, and for women, 48. Table
1 shows the general characteristics of the study participants. Regarding factors in respect of lifestyle habits, the proportions of ex-smokers and current smokers were both high in men, as well as the proportion of heavy drinkers. Regarding education levels, the proportions of those who had graduated from high school and those who had received more than high school education were significantly higher among men than women (
p < 0.001). Additionally, the proportions of those exposed to occupational, loud, and firearm noises were significantly higher in men than in women.
Table 1General characteristics of the study population
|
Variables |
Total na
|
Male |
Female |
p-valueb
|
|
Total |
6409 |
3185 |
3224 |
|
|
Age (years) |
|
Mean ± SE |
47.1 ± 0.3 |
46.3 ± 0.3 |
48.0 ± 0.3 |
< 0.001 |
|
20–29 |
1025 |
493 |
532 |
0.002 |
|
30–39 |
1081 |
537 |
544 |
|
|
40–49 |
1415 |
709 |
706 |
|
|
50–59 |
1454 |
717 |
737 |
|
|
60–69 |
1232 |
615 |
617 |
|
|
70–87 |
202 |
114 |
88 |
|
|
BMI (kg/m2) |
|
Mean ± SE |
23.8 ± 0.1 |
24.2 ± 0.1 |
23.5 ± 0.1 |
< 0.001 |
|
Underweight |
246 |
68 |
178 |
< 0.001 |
|
Normal |
4071 |
1936 |
2135 |
|
|
Obese |
2092 |
1181 |
911 |
|
|
Education |
|
≤ Middle school |
1861 |
751 |
1110 |
< 0.001 |
|
High school |
2365 |
1226 |
1139 |
|
|
≥ College |
2183 |
1208 |
975 |
|
|
Smoking |
|
Non-smoker |
3650 |
723 |
2927 |
< 0.001 |
|
Ex-smoker |
1176 |
1063 |
113 |
|
|
Current smoker |
1583 |
1399 |
184 |
|
|
Alcohol |
|
None |
638 |
104 |
534 |
< 0.001 |
|
Light drinker |
4128 |
1923 |
2205 |
|
|
Heavy drinker |
1643 |
1158 |
485 |
|
|
Exercise |
|
No |
4771 |
2271 |
2500 |
< 0.001 |
|
Yes |
1638 |
914 |
724 |
|
|
Current diagnosis of diabetes mellitus |
|
No |
5980 |
2936 |
3044 |
0.069 |
|
Yes |
429 |
249 |
180 |
|
|
Current diagnosis of hypertension |
|
No |
5237 |
2573 |
2664 |
0.202 |
|
Yes |
1172 |
612 |
560 |
|
|
Occupational noise exposure |
|
No |
5496 |
2538 |
2958 |
< 0.001 |
|
Yes |
913 |
647 |
266 |
|
|
Loud noise exposure |
|
No |
6267 |
3095 |
3172 |
0.008 |
|
Yes |
142 |
90 |
52 |
|
|
Firearm noise exposure |
|
No |
4750 |
1642 |
3108 |
< 0.001 |
|
Yes |
1659 |
1543 |
116 |
|
Tables
2 and
3 show the male and female prevalence of low- and high-frequency hearing impairment (defined, respectively, as a binaural average of hearing thresholds for 0.5, 1 and 2 kHz, and for 3, 4, and 6 kHz exceeding 25 dB), broken down for each of the variables. The prevalence of low- and high-frequency hearing impairment in men was 13.9% and 46.7%, respectively, which was higher than the prevalence in women (11.8% and 27.0%, respectively).
Table 2Characteristics by hearing impairment in male subjects
|
Variables |
Low frequency hearing impairment |
High frequency hearing impairment |
|
Normala
|
Impaireda
|
Rateb
|
p-valuec
|
Normala
|
Impaireda
|
Rateb
|
p -valuec
|
|
Total |
2743 |
442 |
13.9 |
|
1697 |
1488 |
46.7 |
|
|
Age |
|
20–29 |
486 |
7 |
1.4 |
< 0.001 |
466 |
27 |
5.5 |
< 0.001 |
|
30–39 |
525 |
12 |
2.2 |
|
455 |
82 |
15.3 |
|
|
40–49 |
680 |
29 |
4.1 |
|
444 |
265 |
37.4 |
|
|
50–59 |
601 |
116 |
16.2 |
|
244 |
473 |
66 |
|
|
60–69 |
406 |
209 |
34 |
|
84 |
531 |
86.3 |
|
|
70–87 |
45 |
69 |
60.5 |
|
4 |
110 |
96.5 |
|
|
BMI (kg/m2) |
|
Underweight |
56 |
12 |
17.6 |
0.086 |
39 |
29 |
42.6 |
0.610 |
|
Normal |
1650 |
286 |
14.8 |
|
1020 |
916 |
47.3 |
|
|
Obese |
1037 |
144 |
12.2 |
|
638 |
543 |
46 |
|
|
Education |
|
≤ Middle school |
514 |
237 |
31.6 |
< 0.001 |
159 |
592 |
78.8 |
< 0.001 |
|
High school |
1086 |
140 |
11.4 |
|
691 |
535 |
43.6 |
|
|
≥ College |
1143 |
65 |
5.4 |
|
847 |
361 |
29.9 |
|
|
Smoking |
|
Non-smoker |
664 |
59 |
8.2 |
< 0.001 |
483 |
240 |
33.2 |
< 0.001 |
|
Ex-smoker |
860 |
203 |
19.1 |
|
426 |
637 |
59.9 |
|
|
Current smoker |
1219 |
180 |
12.9 |
|
788 |
611 |
43.7 |
|
|
Alcohol |
|
None |
77 |
27 |
26 |
< 0.001 |
42 |
62 |
59.6 |
< 0.001 |
|
Light drinker |
1613 |
310 |
16.1 |
|
914 |
1009 |
52.5 |
|
|
Heavy drinker |
1053 |
105 |
9.1 |
|
741 |
417 |
36 |
|
|
Exercise |
|
No |
1941 |
330 |
14.5 |
0.093 |
1195 |
1076 |
47.4 |
0.239 |
|
Yes |
802 |
112 |
12.3 |
|
502 |
412 |
45.1 |
|
|
Current diagnosis of diabetes mellitus |
|
No |
2558 |
378 |
12.9 |
< 0.001 |
1639 |
1297 |
44.2 |
< 0.001 |
|
Yes |
185 |
64 |
25.7 |
|
58 |
191 |
76.7 |
|
|
Current diagnosis of hypertension |
|
No |
2289 |
284 |
11 |
< 0.001 |
1528 |
1045 |
40.6 |
< 0.001 |
|
Yes |
454 |
158 |
25.8 |
|
169 |
443 |
72.4 |
|
|
Occupational noise exposure |
|
no |
2222 |
316 |
12.5 |
< 0.001 |
1413 |
1125 |
44.3 |
< 0.001 |
|
yes |
521 |
126 |
19.5 |
|
284 |
363 |
56.1 |
|
|
Loud noise exposure |
|
no |
2667 |
428 |
13.8 |
0.640 |
1645 |
1450 |
46.8 |
0.386 |
|
yes |
76 |
14 |
15.6 |
|
52 |
38 |
42.2 |
|
|
Firearm noise exposure |
|
no |
1425 |
217 |
13.2 |
0.265 |
884 |
758 |
46.2 |
0.517 |
|
yes |
1318 |
225 |
14.6 |
|
813 |
730 |
47.3 |
|
Table 3Characteristics by hearing impairment in female subjects
|
Variables |
Low frequency hearing impairment |
High frequency hearing impairment |
|
Normala
|
Impaireda
|
Rateb
|
p-valuec
|
Normala
|
Impaireda
|
Rateb
|
p-valuec
|
|
Total |
2845 |
379 |
11.8 |
|
2354 |
870 |
27.0 |
|
|
Age |
|
20–29 |
525 |
7 |
1.3 |
< 0.001 |
519 |
13 |
2.4 |
< 0.001 |
|
30–39 |
535 |
9 |
1.7 |
|
522 |
22 |
4 |
|
|
40–49 |
676 |
30 |
4.2 |
|
614 |
92 |
13 |
|
|
50–59 |
641 |
96 |
13 |
|
479 |
258 |
35 |
|
|
60–69 |
421 |
196 |
31.8 |
|
209 |
408 |
66.1 |
|
|
70–87 |
47 |
41 |
46.6 |
|
11 |
77 |
87.5 |
|
|
BMI (kg/m2) |
|
Underweight |
167 |
11 |
6.2 |
< 0.001 |
156 |
22 |
12.4 |
< 0.001 |
|
Normal |
1906 |
229 |
10.7 |
|
1603 |
532 |
24.9 |
|
|
Obese |
772 |
139 |
15.3 |
|
595 |
316 |
34.7 |
|
|
Education |
|
≤ Middle school |
836 |
274 |
24.7 |
0.031 |
510 |
600 |
54.1 |
< 0.001 |
|
High school |
1058 |
81 |
7.1 |
|
938 |
201 |
17.6 |
|
|
≥ College |
951 |
24 |
2.5 |
|
906 |
69 |
7.1 |
|
|
Smoking |
|
Non-smoker |
2569 |
358 |
12.2 |
0.062 |
2114 |
813 |
27.8 |
0.004 |
|
Ex-smoker |
105 |
8 |
7.1 |
|
88 |
25 |
22.1 |
|
|
Current smoker |
171 |
13 |
7.1 |
|
152 |
32 |
17.4 |
|
|
Alcohol |
|
None |
412 |
122 |
22.8 |
< 0.001 |
281 |
253 |
47.4 |
< 0.001 |
|
Light drinker |
1962 |
243 |
11 |
|
1646 |
559 |
25.4 |
|
|
Heavy drinker |
471 |
14 |
2.9 |
|
427 |
58 |
12 |
|
|
Exercise |
|
|
|
|
|
|
|
|
|
No |
2185 |
315 |
12.6 |
0.006 |
1794 |
706 |
28.2 |
0.003 |
|
Yes |
660 |
64 |
8.8 |
|
560 |
164 |
22.7 |
|
|
Current diagnosis of diabetes mellitus |
|
No |
2717 |
327 |
10.7 |
< 0.001 |
2272 |
772 |
25.4 |
< 0.001 |
|
Yes |
128 |
52 |
28.9 |
|
82 |
98 |
54.4 |
|
|
Current diagnosis of hypertension |
|
No |
2444 |
220 |
8.3 |
< 0.001 |
2112 |
552 |
20.7 |
< 0.001 |
|
Yes |
401 |
159 |
28.4 |
|
242 |
318 |
56.8 |
|
|
Occupational noise exposure |
|
No |
2610 |
348 |
11.8 |
0.957 |
2174 |
784 |
26.5 |
0.043 |
|
Yes |
235 |
31 |
11.7 |
|
180 |
86 |
32.3 |
|
|
Loud noise exposure |
|
No |
2797 |
375 |
11.8 |
0.359 |
2318 |
854 |
26.9 |
0.535 |
|
Yes |
48 |
4 |
7.7 |
|
36 |
16 |
30.8 |
|
|
Firearm noise exposure |
|
no |
2747 |
361 |
11.6 |
0.200 |
2288 |
820 |
26.4 |
< 0.001 |
|
yes |
98 |
18 |
15.5 |
|
66 |
50 |
43.1 |
|
In men, the proportions of low- and high-frequency hearing impairment increased with age (low frequency: p < 0.001, high frequency: p < 0.001). Focusing on BMI and exercise habits, the prevalence of low-frequency hearing impairment had a lower tendency but not significantly lower in the obese group (p = 0.086) and in the exercise group (p = 0.093). Regarding education level, the prevalence of both low- and high-frequency hearing impairment decreased as the education level advanced (p < 0.001). Low- and high-frequency hearing impairment was less prevalent in the non-smoker group and in the heavy drinker group, as well as in the groups not diagnosed with diabetes and hypertension. In contrast, both low- and high-frequency hearing impairment was significantly more prevalent in the group exposed to occupational noise (p < 0.001). There was no significant difference in the groups exposed to loud and firearm noises.
In women, the proportions of low- and high-frequency hearing impairment increased with age (low frequency: p < 0.001, high frequency: p < 0.001). The prevalence of both low- and high-frequency impairment was significantly lower where BMI was lower and the education level was higher, as well as in the heavy drinker group and the groups not diagnosed with diabetes and hypertension. Exposure to loud noise did not show a significant difference, but the group exposed to occupational and firearm noise showed a significantly higher prevalence of high-frequency hearing impairment (p = 0.043, p < 0.001).
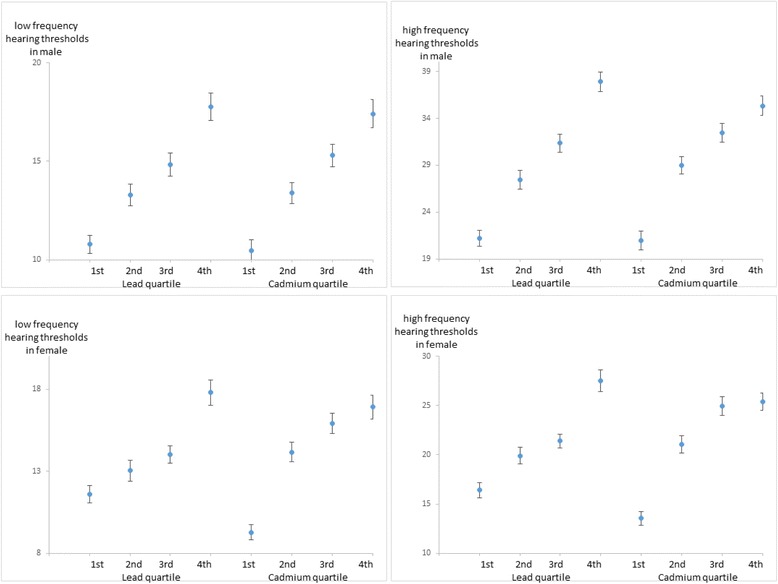
Figure
1 shows the binaural average of frequency hearing thresholds of quartile groups based on blood lead level and blood cadmium level in male and female participants (mean ± SD). The figure displays that the hearing thresholds increase as the quartile group is higher in general.
Fig. 1Binaural average of frequency hearing thresholds by quartile of lead, cadmium. Mean ± SD

Tables
4 and
5 show the results of multivariate logistic regression analysis conducted for male and female participants. The tables display the ORs of low- and high-frequency hearing impairment for two sets of quartile groups, based on blood lead level and blood cadmium level, respectively.
Table 4Adjusted ORs and 95% CI of hearing impairment by quartile of lead, cadmium in male
|
Analyte |
<25th |
25th to <50th |
50th to <75th |
≥75th |
|
Lead |
|
Conc, μg/dLa
|
1.56 ± 0.01 |
2.22 ± 0.01 |
2.82 ± 0.01 |
4.22 ± 0.08 |
|
Case/n (low frequency) |
80/796 |
96/797 |
111/796 |
155/796 |
|
Hearing thresholds(dB)b
|
10.8 ± 0.47 |
13.3 ± 0.56 |
14.8 ± 0.59 |
17.8 ± 0.70 |
|
Prevalence(%)c
|
9.2% |
12.7% |
16.2% |
21.7% |
|
Adjusted OR(95% CI)d
|
Referent |
1.153 (0.761–1.747) |
1.002 (0.644–1.559) |
1.049 (0.694–1.585) |
|
Adjusted OR(95% CI)e
|
Referent |
1.15 (0.758–1.745) |
0.998 (0.640–1.555) |
1.045 (0.690–1.582) |
|
Adjusted OR(95% CI)f
|
Referent |
1.17 (0.772–1.772) |
1.028 (0.661–1.597) |
1.026 (0.677–1.556) |
|
Case/n (high frequency) |
242/796 |
322/797 |
404/796 |
520/796 |
|
Hearing thresholds(dB)b
|
21.2 ± 0.86 |
27.4 ± 0.99 |
31.4 ± 0.99 |
37.9 ± 1.05 |
|
Prevalence(%)c
|
28.6% |
41.6% |
51.3% |
63.9% |
|
Adjusted OR(95% CI)d
|
Referent |
1.342 (0.988–1.823) |
1.357 (0.972–1.894) |
1.598 (1.14–2.238) |
|
Adjusted OR(95% CI)e
|
Referent |
1.352 (0.994–1.837) |
1.365 (0.978–1.906) |
1.614 (1.151–2.263) |
|
Adjusted OR(95% CI)f
|
Referent |
1.368 (1.006–1.859) |
1.402 (1.005–1.955) |
1.629 (1.161–2.287) |
|
Cadmium |
|
Conc, μg/dLa
|
0.47 ± 0.01 |
0.79 ± 0.01 |
1.13 ± 0.01 |
1.88 ± 0.03 |
|
Case/n (low frequency) |
57/797 |
99/797 |
130/798 |
156/793 |
|
Hearing thresholds(dB)b
|
10.5 ± 0.55 |
13.4 ± 0.53 |
15.3 ± 0.57 |
17.4 ± 0.71 |
|
Prevalence(%)c
|
8.4% |
12.9% |
17.1% |
21.1% |
|
Adjusted OR(95% CI)d
|
Referent |
0.857 (0.532–1.379) |
0.845 (0.54–1.322) |
0.924 (0.567–1.505) |
|
Adjusted OR(95% CI)e
|
Referent |
0.855 (0.531–1.376) |
0.84 (0.537–1.313) |
0.922 (0.566–1.503) |
|
Adjusted OR(95% CI)f
|
Referent |
0.842 (0.524–1.354) |
0.83 (0.533–1.291) |
0.905 (0.556–1.473) |
|
Case/n (high frequency) |
221/797 |
362/797 |
433/798 |
472/793 |
|
Hearing thresholds(dB)b
|
20.9 ± 1.00 |
29.0 ± 0.94 |
32.5 ± 1.02 |
35.3 ± 1.04 |
|
Prevalence(%)c
|
27.4% |
46.3% |
52.3% |
59.2% |
|
Adjusted OR(95% CI)d
|
Referent |
1.238 (0.895–1.712) |
1.159 (0.828–1.623) |
1.284 (0.892–1.848) |
|
Adjusted OR(95% CI)e
|
Referent |
1.236 (0.894–1.71) |
1.163 (0.83–1.629) |
1.283 (0.891–1.848) |
|
Adjusted OR(95% CI)f
|
Referent |
1.235 (0.891–1.711) |
1.168 (0.833–1.638) |
1.292 (0.896–1.865) |
Table 5Adjusted ORs and 95% CI of hearing impairment by quartile of lead, cadmium in female
|
Analyte |
<25th |
25th to <50th |
50th to <75th |
≥75th |
|
Lead |
|
Conc, μg/dLa
|
1.12 ± 0.01 |
1.61 ± 0.01 |
2.11 ± 0.01 |
3.03 ± 0.03 |
|
Case/n (low frequency) |
63//808 |
82/804 |
101/806 |
133/806 |
|
Hearing thresholds(dB)b
|
11.6 ± 0.53 |
13.0 ± 0.63 |
14.0 ± 0.52 |
17.8 ± 0.79 |
|
Prevalence(%)c
|
10.9% |
11.1% |
12.6% |
20.6% |
|
Adjusted OR(95% CI)d
|
Referent |
1.312 (0.755–2.279) |
1.302 (0.791–2.143) |
0.957 (0.563–1.626) |
|
Adjusted OR(95% CI)e
|
Referent |
1.288 (0.74–2.24) |
1.281 (0.773–2.123) |
0.93 (0.544–1.589) |
|
Adjusted OR(95% CI)f
|
Referent |
1.271 (0.726–2.223) |
1.308 (0.784–2.183) |
0.932 (0.541–1.604) |
|
Case/n (high frequency) |
135/808 |
178/804 |
234/806 |
323/806 |
|
Hearing thresholds(dB)b
|
16.4 ± 0.75 |
19.9 ± 0.87 |
21.4 ± 0.70 |
27.5 ± 1.10 |
|
Prevalence(%)c
|
20.3% |
24.2% |
29.2% |
44.7% |
|
Adjusted OR(95% CI)d
|
Referent |
0.937 (0.599–1.464) |
1.009 (0.695–1.464) |
1.488 (1.02–2.172) |
|
Adjusted OR(95% CI)e
|
Referent |
0.941 (0.602–1.471) |
1.012 (0.698–1.467) |
1.499 (1.028–2.187) |
|
Adjusted OR(95% CI)f
|
Referent |
0.947 (0.606–1.477) |
1.013 (0.698–1.471) |
1.502 (1.027–2.196) |
|
Cadmium |
|
Conc, μg/dLa
|
0.57 ± 0.01 |
0.96 ± 0.01 |
1.36 ± 0.01 |
2.17 ± 0.03 |
|
Case/n (low frequency) |
42/806 |
89/807 |
110/806 |
138/805 |
|
Hearing thresholds(dB)b
|
9.3 ± 0.45 |
14.2 ± 0.59 |
15.9 ± 0.63 |
16.9 ± 0.73 |
|
Prevalence(%)c
|
6.2% |
13.4% |
17% |
18.5% |
|
Adjusted OR(95% CI)d
|
Referent |
0.873 (0.486–1.567) |
0.916 (0.523–1.603) |
0.768 (0.432–1.364) |
|
Adjusted OR(95% CI)e
|
Referent |
0.88 (0.489–1.586) |
0.92 (0.524–1.616) |
0.758 (0.426–1.349) |
|
Adjusted OR(95% CI)f
|
Referent |
0.875 (0.488–1.57) |
0.913 (0.521–1.601) |
0.757 (0.427–1.343) |
|
Case/n (high frequency) |
85/806 |
212/807 |
280/806 |
293/805 |
|
Hearing thresholds(dB)b
|
13.5 ± 0.69 |
21.1 ± 0.88 |
25.0 ± 0.94 |
25.4 ± 0.90 |
|
Prevalence(%)c
|
13.3% |
28.4% |
37.6% |
38.6% |
|
Adjusted OR(95% CI)d
|
Referent |
1.225 (0.799–1.878) |
1.302 (0.821–2.067) |
1.425 (0.91–2.231) |
|
Adjusted OR(95% CI)e
|
Referent |
1.229 (0.799–1.89) |
1.308 (0.821–2.082) |
1.427 (0.908–2.244) |
|
Adjusted OR(95% CI)f
|
Referent |
1.248 (0.812–1.919) |
1.325 (0.831–2.115) |
1.426 (0.906–2.244) |
In men, the ORs of low-frequency hearing impairment were not significant for the quartile groups based on blood lead levels, with the lowest group as a reference. However, the OR of high-frequency hearing impairment for the highest quartile group compared to the lowest group was significantly high, that is, 1.598 (95% confidence interval [CI] = 1.140–2.238), after adjusting for age, BMI, education, smoking, alcohol consumption, and exercise. The outcome was the same when diabetes mellitus and hypertension were added as adjusted variables. After adjusting for exposure to occupational, loud, and firearm noises, the ORs significantly increased for all groups, compared to the lowest blood lead group as a reference. Regarding blood cadmium levels, the OR of low- or high-frequency hearing impairment was not significant for any quartile groups, with the lowest group as a reference.
As with the men, the ORs of low-frequency hearing impairment were not significant in women for any quartile groups based on blood lead levels, with the lowest group as a reference. However, the OR of high-frequency hearing impairment for the highest quartile group with the lowest as a reference was significant, that is, 1.488 (95% CI = 1.02–2.172), when adjusted for age, BMI, education, smoking, alcohol consumption, and exercise. The result was the same when diabetes mellitus, hypertension, and exposures to occupational, loud, and firearm noises were additionally included as adjusted variables. In addition, in line with findings for the men, women’s ORs for any quartile groups, based on blood cadmium level with the lowest group as a reference, were not significant in either low- or high-frequency hearing impairment.
Discussion
The objective of the present study was to investigate the link between heavy metals to which the general population is generally exposed and hearing impairment. In the study, there was no difference between the sexes in respect of any link between heavy metals and hearing impairment. Regarding the relationship between blood lead level and high-frequency hearing impairment, the risk of hearing impairment significantly increased in both sexes. However, with respect to low-frequency hearing impairment, significant results were not obtained. In addition, blood cadmium level did not show a significant result in either low- or high-frequency hearing impairment in either sex.
Several previous studies have reported associations between lead and cadmium levels, and hearing impairment. In a study within the general US population, Choi et al. found that the hearing threshold of the highest quintile groups, based on blood lead and cadmium levels, was higher compared to the respective lowest group, by approximately 18.6% (95% CI = 7.4%–31.1%) and 13.8% (95% CI = 4.6%–23.8%), respectively [
18]. Shargorodsky et al. reported, in a study with US adolescents, that the OR of high-frequency hearing impairment for the group with a blood lead level over 2 μg/dL was significantly higher compared to a reference group (a blood lead level under 1 μg/dL), that is, 2.22 (95% CI = 1.39–3.56), and that the OR of low-frequency hearing impairment was also significantly higher for the highest quartile group, based on urinary cadmium levels in comparison to the lowest group, that is, 3.08 (95% CI = 1.02–9.25) [
17]. Park et al. conducted a study with 448 community-dwelling elderly men in eastern Massachusetts and demonstrated a link between hearing impairment and an increase in the interquartile range of the lead levels in the patella. In their study, the OR was 1.5 (95% CI = 1.1–1.9). In conclusion, evidence that lead and cadmium affect hearing ability within the general population is accumulating steadily [
16].
Although previous studies have shown that heavy metals such as lead and cadmium affect hearing ability, the present study, to the best of our knowledge, is the first epidemiologic study conducted on Korean participants to examine the relationship between hearing impairment and cadmium exposure. The ototoxicity mechanism involving cadmium is suggested by only a handful of studies. In a study with rats exposed to water containing cadmium, it was shown that cadmium produces reactive oxygen species in auditory cells and causes loss of mitochondrial membrane depolarization, release of cytochrome c, activations of apoptosis and caspases, and an increase in extracellular signal-regulated kinase activation that ultimately elevates the hearing threshold [
13,
14]. A study with US adolescents reported a significant relationship between urinary cadmium and low-frequency hearing impairment. In that study, hearing impairment was defined as an average of hearing thresholds for 0.5, 1, and 2 kHz exceeding 15 dB [
17]. In a study with US adults, there was a significant correlation between blood cadmium levels and hearing impairment, with hearing impairment defined as the hearing thresholds for 0.5, 1, 2, and 4 kHz frequencies exceeding 25 dB in one of two ears [
18]. Unlike these previous studies, no significant relationship was found between cadmium and hearing impairment in our study, due to several possible reasons. First, this study conducted a different statistical analysis. In the two previously mentioned studies, the data were not categorized by sex, and sex was included as an adjusting variable, unlike the present study. When we performed an additional analysis on the entire data set, not separating it into male and female categories, but including sex as an adjusting variable, we observed that the OR of high-frequency hearing impairment for the highest quartile group with the lowest group as a reference was significant, that is, 1.40 (95% CI = 1.07–1.82). Secondly, the differing results may be due to differences in physical responses caused by variations in ethnicity and lifestyle. Thirdly, the differing results may be due to different definitions and thresholds of hearing impairment used across these studies. Aside from these possibilities, our study and the study with US adolescents had different study participants, that is, adults versus adolescents, and differed in how cadmium was measured, namely in blood versus urinary test levels. More research is needed to study the link between cadmium and hearing impairment in the Korean population.
Regarding the link between lead and hearing impairment, many studies have reported results similar to the current study findings, unlike the case with cadmium. However, while the mechanisms through which lead influences the auditory system are not yet clearly known, chronic lead exposure is known to be toxic to the central and peripheral nervous systems. By using an auditory brainstem response test, a study has shown that lead exposure affects the conduction function of the peripheral nervous system along the auditory pathways [
33]. Likewise, Jones et al. reported that lead exposure changes the axonal structure and function of the brainstem auditory nuclei [
12]. An alternative hypothesis is that toxic metals affect intracellular calcium homeostasis [
34] and accordingly, chronic lead exposure induces auditory hair cell death [
35].
The current study findings support the case that even a low level of lead can negatively affect the hearing condition of the Korean general population and that, therefore, an effort should be made to reduce environmental lead exposure. The fourth quartile groups based on blood lead levels demonstrated a risk for poorer hearing in comparison to the first quartile groups. Currently, the Safety Standards of the Occupational Safety and Health Administration (OSHA) specifies 38.6 μg/dL for lead and 5 μg/L for cadmium as blood level thresholds. None of the 6409 participants in the present study exceeded the recommended threshold for lead, and only 6 exceeded it for cadmium. Accordingly, the current study findings suggest that the risk of hearing impairment is present even at a level below the OSHA threshold recommendation for lead. Evidence has been advanced to demonstrate that even where blood lead and cadmium levels are below the respective recommended threshold, they can still lead to chronic kidney disease, peripheral arterial disease, and hypertension [
36–
38]. Studies conducted in the US have already suggested the possibility of hearing impairment in adolescents and adults following lead and cadmium exposure at a level below their respective recommended thresholds [
17,
18].
An advantage of the present study is that it was conducted on a representative sample of the Korean population, and the findings can be generalized to the entire Korean population. Although evidence for the link between hearing impairment and heavy metals, such as lead and cadmium, is accumulating, most studies have been limited in that they were either animal studies or based on a small sample size [
12–
16]. Epidemiologic studies targeting the general population, such as this study, are rare.
There are several limitations to this study. First, participants’ past work history was not considered. Secondly, the level of noise exposure was not accurately measured and was based on self-reported data, meaning that information bias could have been present. In addition, the participants might have not accurately recalled their noise exposure history over the course of their lives. Thirdly, information pertaining to additional factors that could affect hearing ability, for example, congenital diseases, middle ear diseases, exposures to physical trauma, medication, and toxic substance history, was not included in the original KNHANES dataset. Fourthly, although the study used secondary data that was representative of the Korean population (KNHANES), it was a cross-sectional study. Hence, a causal relationship between hearing impairment and heavy metals could not be clearly identified.
To overcome these limitations in future research, work history, medical history, noise exposure, physical trauma, medication, and toxic substances should be examined and the noise level in the workplace should be measured. Additionally, a cohort study should be conducted that includes people not exposed to occupational and environmental noise.
Conclusion
In the Korean population, exposure to low-level lead is significantly associated with high-frequency hearing impairment in both men and women. Therefore, lead exposure should be closely monitored to protect citizens’ health.
Availability of data and materials
Abbreviations
Korea National Health and Nutrition Examination Surveys
Occupational Safety and Health Administration
World Health Organization
REFERENCES
- 1. Agrawal Y, Platz EA, Niparko JK. Prevalence of hearing loss and differences by demographic characteristics among US adults: data from the National Health and nutrition examination survey, 1999-2004. Arch Intern Med 2008;168(14):1522–1530. 10.1001/archinte.168.14.1522. 18663164.ArticlePubMed
- 2. Cruickshanks KJ, Wiley TL, Tweed TS, Klein BE, Klein R, Mares-Perlman JA, Nondahl DM. Prevalence of hearing loss in older adults in beaver dam, Wisconsin the epidemiology of hearing loss study. Am J Epidemiol 1998;148(9):879–886. 10.1093/oxfordjournals.aje.a009713. 9801018.ArticlePubMed
- 3. http://www.who.int/mediacentre/factsheets/fs300/en/.
- 4. Hong JW, Jeon JH, Ku CR, Noh JH, Yoo HJ, Kim D-J. The prevalence and factors associated with hearing impairment in the Korean adults: the 2010–2012 Korea National Health and nutrition examination survey (observational study). Medicine 2015;94(10):e611. 10.1097/MD.0000000000000611. 25761183.PubMedPMC
- 5. Brink P, Stones M. Examination of the relationship among hearing impairment, linguistic communication, mood, and social engagement of residents in complex continuing-care facilities. The Gerontologist 2007;47(5):633–641. 10.1093/geront/47.5.633. 17989405.ArticlePubMedPDF
- 6. Chia E-M, Wang JJ, Rochtchina E, Cumming RR, Newall P, Mitchell P. Hearing impairment and health-related quality of life: the Blue Mountains hearing study. Ear Hear 2007;28(2):187–195. 10.1097/AUD.0b013e31803126b6. 17496670.ArticlePubMed
- 7.
- 8. Choi Y-H, Hu H, Tak S, Mukherjee B, Park SK. Occupational noise exposure assessment using O* NET and its application to a study of hearing loss in the US general population. Occup Environ Med 2012;69(3):176–183. 10.1136/oem.2011.064758. 21725070.ArticlePubMedPMC
- 9. Vyskocil A, Truchon G, Leroux T, Lemay F, Gendron M, Gagnon F, Majidi NE, Boudjerida A, Lim S, Emond CA. Weight of evidence approach for the assessment of the ototoxic potential of industrial chemicals. Toxicol Ind Health 2012;28(9):796–819. 10.1177/0748233711425067. 22064681.ArticlePubMedPDF
- 10.
- 11. Fuente A, Slade MD, Taylor T, Morata TC, Keith RW, Sparer J, Rabinowitz PM. Peripheral and central auditory dysfunction induced by occupational exposure to organic solvents. J Occup Environ Med 2009;51(10):1202–1211. 10.1097/JOM.0b013e3181bae17c. 19786896.ArticlePubMed
- 12. Jones LG, Prins J, Park S, Walton JP, Luebke AE, Lurie DI. Lead exposure during development results in increased neurofilament phosphorylation, neuritic beading, and temporal processing deficits within the murine auditory brainstem. J Comp Neurol 2008;506(6):1003–1017. 10.1002/cne.21563. 18085597.ArticlePubMed
- 13. Ozcaglar HU, Agirdir B, Dinc O, Turhan M, Kilinçarslan S, Oner G. Effects of cadmium on the hearing system. Acta Otolaryngol 2001;121(3):393–397. 10.1080/000164801300102897. 11425207.ArticlePubMed
- 14. Kim S-J, Jeong H-J, Myung N-Y, Kim M-c, Lee J-H, So H-s, Park R-K, Kim H-M, Um J-Y, Hong S-H. The protective mechanism of antioxidants in cadmium-induced ototoxicity in vitro and in vivo. Environ Health Perspect 2008;116(7):854–862. 10.1289/ehp.10467. 18629305.ArticlePubMedPMC
- 15. Prasher D. Heavy metals and noise exposure: health effects. Noise Health 2009;11(44):141–144. 10.4103/1463-1741.53358. 19602766.ArticlePubMed
- 16. Park SK, Elmarsafawy S, Mukherjee B, Spiro A, Vokonas PS, Nie H, Weisskopf MG, Schwartz J, Hu H. Cumulative lead exposure and age-related hearing loss: the VA normative aging study. Hear Res 2010;269(1):48–55. 10.1016/j.heares.2010.07.004. 20638461.ArticlePubMedPMC
- 17. Shargorodsky J, Curhan SG, Henderson E, Eavey R, Curhan GC. Heavy metals exposure and hearing loss in US adolescents. Arch Otolaryngol Head Neck Surg 2011;137(12):1183–1189. 10.1001/archoto.2011.202. 22183895.ArticlePubMed
- 18. Choi Y-H, Hu H, Mukherjee B, Miller J, Park SK. Environmental cadmium and lead exposures and hearing loss in US adults: the National Health and nutrition examination survey, 1999 to 2004. Environ Health Perspect 2012;120(11):1544. 10.1289/ehp.1104863. 22851306.ArticlePubMedPMC
- 19.
- 20. Rosin A. The long-term consequences of exposure to lead. Isr Med Assoc J 2009;11(11):689–694. 20108558.PubMed
- 21. Henson MC, Chedrese PJ. Endocrine disruption by cadmium, a common environmental toxicant with paradoxical effects on reproduction. Exp Biol Med 2004;229(5):383–392. 10.1177/153537020422900506.ArticlePDF
- 22. Lee B-K. The role of biological monitoring in the health management of lead-exposed workers. Toxicol Lett 1999;108(2):149–160. 10.1016/S0378-4274(99)00083-1. 10511256.ArticlePubMed
- 23. Mercier M. International approach of the assessment of chemical risks. J Hyg Epidemiol Microbiol Immunol 1990;34(1):1–7. 2351814.PubMed
- 24. Seo J-W, Kim B-G, Kim Y-M, Kim R-B, Chung J-Y, Lee K-M, Hong Y-S. Trend of blood lead, mercury, and cadmium levels in Korean population: data analysis of the Korea National Health and nutrition examination survey. Environ Monit Assess 2015;187(3):146. 10.1007/s10661-015-4348-2. 25716526.ArticlePubMedPDF
- 25. http://www.who.int/pbd/deafness/hearing_impairment_grades/en.
- 26. Picard M, Girard SA, Simard M, Larocque R, Leroux T, Turcotte F. Association of work-related accidents with noise exposure in the workplace and noise-induced hearing loss based on the experience of some 240,000 person-years of observation. Accid Anal Prev 2008;40(5):1644–1652. 10.1016/j.aap.2008.05.013. 18760091.ArticlePubMed
- 27. McBride D, Williams S. Audiometric notch as a sign of noise induced hearing loss. Occup Environ Med 2001;58(1):46–51. 10.1136/oem.58.1.46. 11119634.ArticlePubMedPMC
- 28. Hwang JH, Wu CC, Hsu CJ, Liu TC, Yang WS. Association of central obesity with the severity and audiometric configurations of age-related hearing impairment. Obesity 2009;17(9):1796–1801. 10.1038/oby.2009.66. 19300432.ArticlePubMedPDF
- 29. Itoh A, Nakashima T, Arao H, Wakai K, Tamakoshi A, Kawamura T, Ohno Y. Smoking and drinking habits as risk factors for hearing loss in the elderly: epidemiological study of subjects undergoing routine health checks in Aichi, Japan. Public Health 2001;115(3):192–196. 11429714.ArticlePubMed
- 30. Trune DR, Nguyen-Huynh A. Vascular pathophysiology in hearing disorders. Semin Hear 2012;33(3):242–250. 10.1055/s-0032-1315723. 25346568.ArticlePubMedPMC
- 31. Cristell M, Hutchinson KM, Alessio HM. Effects of exercise training on hearing ability. Scand Audiol 1998;27(4):219–224. 10.1080/010503998420522. 9832404.ArticlePubMed
- 32. Fransen E, Topsakal V, Hendrickx J-J, Van Laer L, Huyghe JR, Van Eyken E, Lemkens N, Hannula S, Mäki-Torkko E, Jensen M. Occupational noise, smoking, and a high body mass index are risk factors for age-related hearing impairment and moderate alcohol consumption is protective: a European population-based multicenter study. J Assoc Res Otolaryngol 2008;9(3):264–276. 10.1007/s10162-008-0123-1. 18543032.ArticlePubMedPMCPDF
- 33. Hirata M, Kosaka H. Effects of lead exposure on neurophysiological parameters. Environ Res 1993;63(1):60–69. 10.1006/enrs.1993.1127. 8404776.ArticlePubMed
- 34. Sabolić I. Common mechanisms in nephropathy induced by toxic metals. Nephron Physiol 2006;104(3):107–114. 10.1159/000095539.
- 35.
- 36. Guallar E, Silbergeld EK, Navas-Acien A, Malhotra S, Astor BC, Sharrett AR, Schwartz BS. Confounding of the relation between homocysteine and peripheral arterial disease by lead, cadmium, and renal function. Am J Epidemiol 2006;163(8):700–708. 10.1093/aje/kwj090. 16484446.ArticlePubMed
- 37. Navas-Acien A, Tellez-Plaza M, Guallar E, Muntner P, Silbergeld E, Jaar B, Weaver V. Blood cadmium and lead and chronic kidney disease in US adults: a joint analysis. Am J Epidemiol 2009;170(9):1156–1164. 10.1093/aje/kwp248. 19700501.ArticlePubMedPMC
- 38.
Notes


 Cite
Cite