
Articles
- Page Path
- HOME > Ann Occup Environ Med > Volume 38; 2026 > Article
- Original Article Association between heavy metal exposure and high-sensitivity C-reactive protein in the elderly: Korea National Health and Nutrition Examination Survey (KNHANES) 2016–2017
-
Jongwon Jung
 , Ji Young Ryu,*
 -
Annals of Occupational and Environmental Medicine 2026;38:e13.
DOI: https://doi.org/10.35371/aoem.2026.38.e13
Published online: April 6, 2026
Department of Occupational and Environmental Medicine, Inje University Haeundae Paik Hospital, Busan, Korea
- *Corresponding author: Ji Young Ryu Department of Occupational and Environmental Medicine, Inje University Haeundae Paik Hospital, 875 Haeundae-ro, Haeundae-gu, Busan 48108, Korea E-mail: lyou77@paik.ac.kr
• Received: January 7, 2026 • Revised: March 24, 2026 • Accepted: April 1, 2026
© 2026 Korean Society of Occupational & Environmental Medicine
This is an Open Access article distributed under the terms of the Creative Commons Attribution Non-Commercial License (https://creativecommons.org/licenses/by-nc/4.0/) which permits unrestricted non-commercial use, distribution, and reproduction in any medium, provided the original work is properly cited.
- 1,146 Views
- 31 Download
Abstract
-
Background Cardiovascular diseases (CVDs) are a primary cause of mortality in the elderly. Exposure to heavy metals such as lead, cadmium, and mercury has been suggested to increase CVD risk by inducing reactive oxygen species and inflammatory responses. The elderly are particularly susceptible to heavy metal exposure, which may increase their CVD risk. Despite this potential risk, evidence specifically focusing on the association between blood heavy metal levels and high-sensitivity C-reactive protein (hsCRP), a key predictor of CVDs, in the elderly remains limited. Therefore, the present study aimed to assess the relationship between blood lead, mercury, and cadmium concentrations and hsCRP in the elderly.
-
Methods We analyzed 884 subjects (385 men, 499 women) aged 65 years and older without CVD history from the Korea National Health and Nutrition Examination Survey (KNHANES) 2016–2017. Because KNHANES is a two-stage stratified clustered sample, all analyses applied stratum, cluster, and weight. Estimated geometric means (GMs) of hsCRP across demographic factors and heavy metal quartiles were compared using a complex samples general linear model (CSGLM). The association between blood heavy metals and hsCRP was examined using CSGLM, adjusting for age, sex, body mass index, estimated glomerular filtration rate, smoking status, alcohol consumption, education, physical activity, monthly income, and underlying diseases.
-
Results The estimated GM of hsCRP differed significantly by blood lead quartile (p = 0.035) and showed a significant increasing trend (p for trend = 0.019). In CSGLM analysis, elevated blood lead concentrations were significantly associated with increased hsCRP (β = 0.176, p = 0.032) after adjustment. However, blood mercury and cadmium concentrations showed no significant associations with hsCRP.
-
Conclusions The observed association between blood lead concentrations and hsCRP suggests that elevated blood lead may contribute to increased CVD risk in the elderly. Given the susceptibility of this population, subsequent investigations are warranted to confirm this association and develop preventive strategies.
BACKGROUND
In recent years, the health of the elderly has become a major topic due to the increasing number of elderly people in South Korea.1 Among the elderly, cardiovascular diseases (CVDs) are one of the major causes of mortality. In particular, heart diseases ranked as the second leading cause of death following malignant neoplasms in individuals aged 60 years and older, and the mortality rate due to CVDs exhibits a sharp increase in the population aged 70 or older.2
There are many risk factors for CVDs including age, sex, hypertension, diabetes, smoking, and physical inactivity.3 Environmental exposures, including heavy metals, are also suggested as possible risk factors for CVDs.4 Several epidemiological studies have examined the association of exposure to toxic metals, including lead, mercury, and cadmium, with CVDs.5-7 Lead, mercury, and cadmium are released into the water, soil, and the atmosphere through anthropogenic activities such as manufacturing and mining, as well as natural pathways.8 In particular, lead and mercury are utilized in a variety of products such as batteries, cosmetics, and pigments, leading to potential human exposure.9 Humans can be exposed to heavy metals through various routes, including the gastrointestinal absorption of contaminated water or food, the respiratory inhalation of airborne particles, and direct dermal contact.10
While the precise pathophysiological pathways linking heavy metal exposure to the onset of CVDs remain unclear, the induction of reactive oxygen species (ROS) is postulated as a primary mechanism.11 This process induces the formation of oxidized low-density lipoprotein causing atherosclerosis, and impairs nitric oxide signaling in blood vessels, contributing to CVDs.12 In addition, ROS generation by heavy metal exposure may lead to an inflammatory response by inducing pro-inflammatory cytokines and chemokines.13 Such inflammatory responses contribute significantly to the progression of atherosclerosis and induce injury to the endothelial wall.14
The elderly population is rapidly expanding due to increased life expectancy, positioning CVDs as a primary cause of mortality in this population.1 The elderly may also be particularly susceptible to environmental exposure to heavy metals due to factors such as age-related increases in oxidative stress, as well as alterations in toxicokinetics and toxicodynamics.15-17 Considering the susceptibility of the elderly to heavy metal exposure and the risk of CVDs associated with such exposure, it is crucial to investigate whether heavy metal exposure further elevates the risk of CVDs in this population.
High-sensitivity C-reactive protein (hsCRP) is a biological marker of inflammation and is also used as a predictor of CVDs.14 Previous epidemiological studies have shown a significant association between hsCRP and CVDs.18,19 In particular, blood hsCRP levels serve as a predictor of the risk of future CVDs, even in healthy individuals.20,21 Although recent studies have investigated the adverse health effects of environmental heavy metal exposure in the elderly, focusing on issues such as accelerated biological aging or cognitive decline,22,23 data regarding its association with the risk of CVDs remain scarce. While a recent meta-analysis reported a significant association between heavy metals and cardiovascular outcomes, the majority of the included studies targeted the general adult population, leaving evidence specifically targeting the geriatric population limited.24 Furthermore, while some studies have explored the relationship between blood heavy metal levels and hsCRP, their findings are often inconsistent, and evidence specific to the elderly is largely lacking. Therefore, the present study sought to determine the association of blood lead, mercury, and cadmium concentrations with hsCRP, an established predictor for cardiovascular risk, among the Korean elderly population.14
METHODS
Data for the present analysis were derived from the seventh Korea National Health and Nutrition Examination Survey (KNHANES) (2016–2017), a cross-sectional, population-based survey administered by the Korea Centers for Disease Control and Prevention. Utilizing a two-stage stratified cluster sampling design, the survey gathered data from 16,277 participants through health interviews, physical examinations, and laboratory blood analysis. For this study, we initially selected 2,683 subjects aged 65 years or older from the total participants. Subjects with a history of CVDs were excluded based on their self-reported “yes” responses to the questionnaire item regarding the diagnosis history of stroke, myocardial infarction, or angina pectoris. This exclusion was implemented to assess CVD risk in the general elderly population and to minimize potential biological confounding, as CVD history is inherently associated with elevated baseline hsCRP levels due to the inflammatory nature of the disease pathology. Subsequently, subjects with missing data for blood concentrations of lead, mercury, and cadmium, hsCRP, or other covariates were further excluded. Subjects with hsCRP levels above 10 mg/L were also not included in this study to minimize the confounding effects of acute inflammatory conditions such as bacterial infections.25 Finally, 884 subjects (385 males and 499 females) were included in the analysis (Fig. 1).
Blood lead, mercury, and cadmium concentrations were included as continuous variables to evaluate the association with hsCRP. Additionally, heavy metal concentrations were divided into quartiles to compare the mean hsCRP levels across these groups. Blood lead, mercury, cadmium, and hsCRP were measured following the 7th KNHANES laboratory test guidelines.26 For the analysis of blood lead, mercury, and cadmium concentrations, a minimum of 0.5 mL of whole blood was collected into EDTA tubes. All samples were maintained at 2–8°C immediately upon collection and delivered to the laboratory on the day of sampling. Concentrations of blood lead and cadmium were quantified using an atomic absorption spectrophotometer. Blood mercury concentrations were determined via a gold amalgamation direct mercury analyzer.
Blood hsCRP levels were measured in serum specimens by particle-enhanced immunoturbidimetric assay, in which anti–C-reactive protein (CRP) antibodies in the reagent react with CRP in the specimen forming an antigen-antibody complex.
Age, sex, body mass index (BMI), estimated glomerular filtration rate (eGFR), smoking status, alcohol consumption, physical activity, education, monthly income, and presence of underlying diseases were included as variables. Age was classified as “65–69”, “70–74”, “75–79”, and “80 years and older.” BMI was categorized into four groups for descriptive analyses: underweight (<18.5 kg/m2), normal (18.5–22.9 kg/m2), overweight (23.0–24.9 kg/m2), and obese (≥25.0 kg/m2). Additionally, BMI was also included as a continuous variable in the regression models. eGFR was calculated using the Chronic Kidney Disease Epidemiology Collaboration (CKD-EPI) equation based on serum creatinine levels and was included as a continuous covariate to adjust for physiological renal function. The average monthly gross household income was categorized into three groups: “<2.5 million KRW”, “2.5–5.0 million KRW”, and “≥5.0 million KRW.” Smoking status was divided into two groups: “current smoker” and “never smoker or former smoker.” Alcohol consumption was categorized into two groups: “lifetime non-drinker or drinking less than once a month in the past year” and “drinking once a month or more in the past year.” Physical activity was categorized into two groups based on 150 minutes of moderate physical activity per week. Education was divided into “<high school,” “high school,” and “≥college.” Underlying diseases were categorized into two groups, “yes” or “no,” based on the current prevalence of hypertension, diabetes, or hyperlipidemia. Subjects who had at least one of these diseases were classified as “yes,” while those who had none were classified as “no.” All covariates were collected through personal interviews and self-administered questionnaires, with the exception of BMI, which was measured via a physical examination.
Because KNHANES is a two-stage stratified clustered sample, we performed all analyses using a complex samples model, applying stratum, cluster, and weight. All heavy metal and hsCRP concentrations were natural log-transformed prior to analysis due to their skewed distributions. A complex samples general linear model (CSGLM) was used for univariate analyses of demographic factors and heavy metal quartiles. Estimated geometric means (GMs) were calculated by exponentiating the estimated marginal means derived from the CSGLM. Consequently, the estimated GMs of hsCRP concentration were compared according to each demographic factor. Data on hsCRP, lead, mercury, and cadmium levels were summarized using the median, 25th and 75th percentiles, and estimated GMs with 95% confidence interval (CI). The estimated GMs of hsCRP concentration were compared across the quartiles of each metal concentration. Multiple linear regression using a CSGLM was also performed to examine the relationship between blood lead, mercury, and cadmium exposure and hsCRP concentrations. The model was adjusted for age, sex, BMI, eGFR, smoking status, alcohol consumption, education, physical activity, monthly income, and underlying diseases. All analyses were performed using the SPSS statistical software version 25.0 (IBM Corp., Armonk, NY, USA).
This study was determined to be exempt from Institutional Review Board (IRB) review by Inje University Haeundae Paik Hospital IRB because it utilized publicly available, anonymous and de-identified data from KNHANES (IRB No. HPIRB 2025-12-008).
RESULTS
Table 1 shows the estimated GM of hsCRP according to demographic factors. BMI was the only demographic factor for which the GM of hsCRP differed significantly between groups (p < 0.001). The group with BMI < 18.5 kg/m2 showed the lowest GM of hsCRP (GM: 0.55 mg/L; 95% CI: 0.38–0.78), whereas the group with BMI ≥ 25.0 kg/m2 exhibited the highest levels (GM: 0.96 mg/L; 95% CI: 0.85–1.08). While men had a higher GM of hsCRP compared to women, the difference was not statistically significant (p = 0.066). Other variables did not demonstrate a significant difference in the GM of hsCRP among their categories.
Table 2 presents the distribution of hsCRP levels and blood concentrations of lead, mercury, and cadmium. Median (25th percentile and 75th percentile) concentrations of hsCRP, lead, mercury, and cadmium were 0.65 mg/L (0.40–1.30), 1.94 µg/dL (1.51–2.45), 3.02 µg/L (1.90–4.76), and 1.17 µg/L (0.88–1.62), respectively. Regarding blood lead, 6.2% of the total elderly participants exceeded the reference value of 3.5 µg/dL.27
The estimated GMs of hsCRP across the quartile groups of blood lead, mercury, and cadmium are detailed in Table 3. We observed a significant increasing trend in the estimated GM of hsCRP across blood lead quartiles, with the highest levels noted in the fourth quartile (p for trend = 0.019). Within the highest lead exposure group (n = 243), 24.8% (weighted percentage; unweighted n = 67) of participants had blood lead levels exceeding the reference value of 3.5 µg/dL. However, no significant trends in the GM of hsCRP were observed among the quartile groups of blood mercury and cadmium concentration.
The CSGLM regression analysis between blood lead, mercury, and cadmium and hsCRP is shown in Table 4. Following adjustment for potential confounders, blood lead concentrations remained significantly and positively associated with hsCRP levels (β = 0.176, p = 0.032). However, neither blood mercury nor cadmium concentrations exhibited significant associations with hsCRP levels.
DISCUSSION
The present study assessed the association between exposure to lead, mercury, and cadmium and hsCRP, a predictive marker for CVD risk, in the elderly. Our results showed that blood lead concentrations are positively associated with hsCRP levels, a finding that is consistent with previous animal and epidemiological studies investigating the relationship between lead exposure and CVDs. However, no significant associations of cadmium and mercury with hsCRP were observed.
Previous animal studies have examined the relationship between lead exposure and hsCRP, as well as its connection to cardiovascular dysfunction. An in vivo study in rats showed a significant increase in mean hsCRP concentration in the lead exposure group compared to the control group.28 Other animal studies showed that low-dose lead exposure in rats resulted in elevated arterial pressure and reduced myocardial contractility in the exposed groups.29,30 These studies provide biological plausibility for the association between lead exposure and increased CVD susceptibility.
Epidemiological studies have also explored the relationship of lead exposure with hsCRP levels. For instance, a study involving Thai adult men demonstrated that participants in the fourth quartile of blood lead concentration exhibited significantly higher mean serum hsCRP level compared to those in the first quartile.31 Meanwhile, there are also human studies that have reported partially significant associations between blood lead levels and hsCRP. In a study of 426 older men from the Normative Aging Study in the United States, a significant correlation between blood lead and hsCRP was observed in the age-adjusted model. However, this association did not persist after controlling for other potential confounding factors.32 Another U.S. study using National Health and Nutrition Examination Survey (NHANES) (2007–2010) found that, although some occupational groups with high lead exposure showed higher hsCRP levels than those with low lead exposure, a significant association between blood lead levels and hsCRP was not observed in the entire population.33 Although some studies report inconsistent findings, our study contributes significant evidence by showing that the association between blood lead and hsCRP, especially in the elderly population, persists even after comprehensive adjustment for multiple covariates.
While previous studies have documented positive correlations of cadmium and mercury with hsCRP in adults,34,35 we observed no significant relationship between these heavy metals and hsCRP in the elderly. A previous Korean study using the same KNHANES 2016–2017 data reported a significant association between blood mercury and hsCRP, but not lead.36 However, the study targeted the general adult population, and the association was largely attributable to an indirect effect mediated by BMI. In contrast, our study adjusted for BMI as a covariate. Furthermore, in that the median hsCRP level in our elderly participants was higher than that of the general adult population in the previous study, we speculate that the indirect effect of mercury exposure mediated by BMI on hsCRP may be masked by age-related underlying conditions and inflammation in the elderly population. However, given the established role of cadmium and mercury as risk factors for CVDs, and considering previous studies showing that cadmium exposure inhibits antioxidant capacity specifically in the elderly,37 further research is warranted to clarify this relationship specifically in the elderly population.
The burden of heavy metals such as lead is known to cause oxidative stress and inflammation.38 This is supported by several animal studies where lead exposure was shown to increase lipid peroxidation and the production of pro-inflammatory cytokines, both of which are key indicators of oxidative stress and inflammation.39-41 Furthermore, lead exposure may upregulate pro-apoptotic factors, thereby inducing apoptosis in vascular and cardiac tissues and contributing to tissue damage.42 The elderly are particularly susceptible to oxidative stress, evidenced by increased systemic peroxide levels and slightly reduced antioxidant reserve.16 Therefore, exposure to heavy metals can impose an additional oxidative stress burden on the elderly population.
Studies investigating the correlation between lead exposure and hsCRP among the elderly are scarce, but some previous studies have analyzed CVD risk factors or the prevalence of coronary artery disease (CAD) in the context of lead exposure. A study in China reported that increased blood lead levels were associated with a higher risk of dyslipidemia, a CVD risk factor, in the elderly.43 In addition, an Iranian study found that CAD patients aged 50–70 had significantly higher levels of blood lead and mercury compared to healthy controls, with these levels showing a significant association with the presence of CAD.44
Although advanced age is a well-established risk factor for CVDs,45 a number of studies suggest that heavy metal exposure also contributes to CVD risk.4 This is particularly relevant for the elderly, as their heightened sensitivity to oxidative stress makes them more vulnerable to the adverse effects of environmental toxins known to disrupt antioxidant balance.16 Moreover, heavy metal exposure in the elderly may accelerate the decline in renal function. For example, a study conducted in the United States reported that increased body burden of lead is associated with reduced renal function, particularly in elderly individuals with diabetes or hypertension.46 Furthermore, age-related impairment of metabolic processes can compromise the body's efficiency in eliminating heavy metals,17 and when combined with the long half-lives of these substances, this predisposes the elderly to a greater cumulative body burden,47 making them more vulnerable to heavy metal toxicity even at exposure levels similar to those of younger populations. Especially for lead, the endogenous release of accumulated bone lead, resulting from its long half-life and the aging process, may also act as a key contributor to biological susceptibility in this population.48 Considering this cumulative body burden of lead and the age-related vulnerability, further complicated by the decreased renal capacity for lead excretion, these pathophysiological factors may explain why the association between blood lead and hsCRP is more distinctly evident in the elderly than in the general adult population, consequently making them more susceptible to the risk of CVDs resulting from lead exposure.
The primary contribution of our study lies in its evaluation of heavy metal exposure and CVD risk in the elderly Korean population, a previously understudied demographic. These results align with earlier reports associating lead toxicity with increased CVD risk. Especially in this study, the median blood lead concentration was 1.94 µg/dL, which is lower than the current reference value of 3.5 µg/dL. Nevertheless, the significant association with hsCRP observed even at these concentrations supports the growing academic consensus that there is no safe threshold for lead exposure. This finding underscores that environmental lead exposure, even below the reference threshold, can act as a potent driver of chronic inflammation and cardiovascular risk, particularly in the susceptible elderly population.
However, interpretation of our findings requires caution due to the cross-sectional nature of the study, which limits the assessment of long-term effects. Additionally, although we attempted to control for acute infection by excluding participants with CRP levels above 10 mg/L, the lack of data on specific acute inflammatory responses in the KNHANES limited our ability to fully adjust for these confounding factors. To address these limitations, prospective longitudinal studies are essential to elucidate the long-term effects of heavy metal exposure. Furthermore, we did not include dietary factors such as seafood consumption as covariates. Since seafood is not only the primary exposure route for mercury but also a rich source of anti-inflammatory components, its protective effects could act as a negative confounder, potentially masking the pro-inflammatory impact of mercury. Therefore, further studies are needed to evaluate the complex interplay between seafood consumption, heavy metal exposure, and these protective effects in the elderly. Ultimately, despite these limitations, our findings suggest that even low-level heavy metal exposure can exert adverse effects on the cardiovascular system in the elderly. Therefore, comprehensive strategies for the management and prevention of environmental exposure are warranted in this population.
CONCLUSIONS
Our study suggests a significant association between blood lead concentrations and elevated hsCRP in the Korean elderly population. This finding is clinically relevant because hsCRP serves as a predictive marker for CVD risk in this group characterized by high CVD-related mortality. This association remained significant after adjusting for potential confounders, whereas no such association was observed for cadmium or mercury. Further studies focusing on the elderly population are needed.
Abbreviations
BMI
body mass index
CAD
coronary artery disease
CI
confidence interval
CKD-EPI
Chronic Kidney Disease Epidemiology Collaboration
CRP
C-reactive protein
CSGLM
complex samples general linear model
CVD
cardiovascular disease
eGFR
estimated glomerular filtration rate
GM
geometric mean
hsCRP
high-sensitivity C-reactive protein
KNHANES
Korea National Health and Nutrition Examination Survey
NHANES
National Health and Nutrition Examination Survey
ROS
reactive oxygen species
-
Competing interests
The authors declare that they have no competing interests.
-
Author contributions
Conceptualization: Ryu JY. Data curation: Jung J. Methodology/formal analysis/validation: Jung J, Ryu JY. Project administration: Ryu JY. Writing - original draft: Jung J, Ryu JY. Writing - review & editing: Ryu JY.
-
Acknowledgments
This study used data from the seventh Korea National Health and Nutrition Examination Survey (2016-2017), which was conducted by the Korea Centers for Disease Control and Prevention. The authors gratefully acknowledge its effort.
NOTES
Fig. 1.
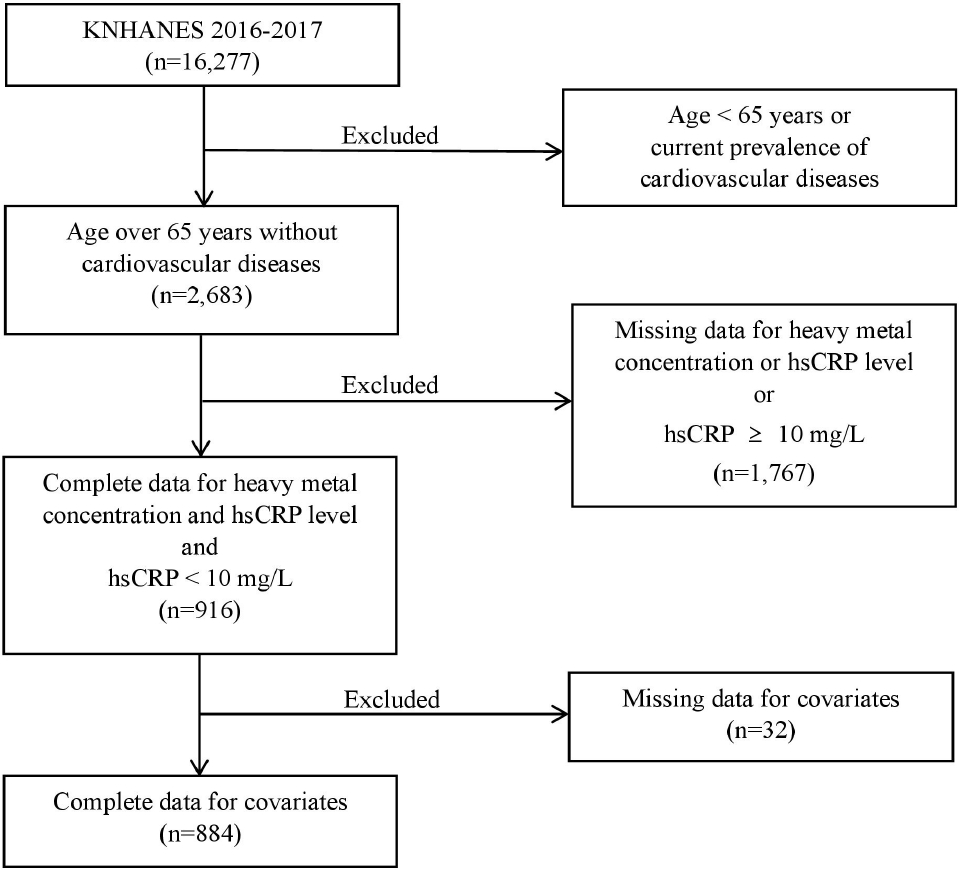
Flowchart illustrating the selection of study participants from KNHANES (2016–2017). hsCRP: high-sensitivity C-reactive protein; KNHANES: Korea National Health and Nutrition Examination Survey.
Table 1.
Estimated GM (mg/L) concentration of hsCRP by demographic characteristics
| Variable | No. (weighted %) | Estimated GM (95% CI) |
|---|---|---|
| Total | 884 | 0.78 (95% CI 0.73–0.84) |
| Age (years) | ||
| 65–69 | 329 (40.2) | 0.77 (0.68–0.86) |
| 70–74 | 250 (29.5) | 0.77 (0.67–0.89) |
| 75–79 | 210 (21.1) | 0.79 (0.69–0.91) |
| ≥ 80 | 95 (9.2) | 0.85 (0.69–1.04) |
| p-value | 0.856 | |
| Sex | ||
| Male | 385 (43.7) | 0.84 (0.76–0.92) |
| Female | 499 (56.3) | 0.74 (0.67–0.82) |
| p-value | 0.066 | |
| BMI (kg/m2) | ||
| <18.5 | 26 (2.9) | 0.55 (0.38–0.78) |
| 18.5–22.9 | 297 (32.5) | 0.68 (0.60–0.77) |
| 23.0–24.9 | 212 (24.6) | 0.69 (0.62–0.78) |
| ≥25.0 | 349 (40.0) | 0.96 (0.85–1.08) |
| p-value | <0.001 | |
| Monthly income (million KRW) | ||
| <2.5 | 603 (60.1) | 0.82 (0.76–0.89) |
| 2.5–5.0 | 173 (23.3) | 0.67 (0.58–0.78) |
| ≥5.0 | 108 (16.6) | 0.79 (0.64–0.99) |
| p-value | 0.108 | |
| Smoking status | ||
| Current | 79 (8.2) | 0.76 (0.62–0.93) |
| Never or former | 805 (91.8) | 0.78 (0.73–0.84) |
| p-value | 0.784 | |
| Alcohol consumption | ||
| Yes | 328 (39.5) | 0.83 (0.75–0.92) |
| No | 556 (60.5) | 0.75 (0.68–0.82) |
| p-value | 0.119 | |
| Physical activity (minute/week) | ||
| <150 | 592 (65.2) | 0.77 (0.71–0.84) |
| ≥150 | 292 (34.8) | 0.80 (0.71–0.91) |
| p-value | 0.612 | |
| Education | ||
| <High school | 641 (67.5) | 0.78 (0.72–0.84) |
| High school | 145 (18.9) | 0.81 (0.68–0.98) |
| ≥College | 98 (13.6) | 0.75 (0.62–0.91) |
| p-value | 0.830 | |
| Underlying diseasesa | ||
| Yes | 564 (62.9) | 0.78 (0.71–0.86) |
| No | 320 (37.1) | 0.78 (0.69–0.88) |
| p-value | 0.992 |
Table 2.
Distribution of hsCRP, lead, mercury, and cadmium
Table 3.
Estimated GM (mg/L) concentration of hsCRP by quartiles of each blood lead, mercury, and cadmium concentration
Table 4.
Association of lead, mercury, and cadmium exposure with hsCRP using a CSGLM analysis
| Variable | Unadjusted | Adjusteda | Adjustedb |
|---|---|---|---|
| Lead | |||
| β | 0.225 | 0.195 | 0.176 |
| 95% CI | 0.067 to 0.383 | 0.033 to 0.357 | 0.015 to 0.337 |
| p-value | 0.005 | 0.019 | 0.032 |
| Mercury | |||
| β | 0.055 | 0.042 | 0.022 |
| 95% CI | –0.044 to 0.154 | –0.057 to 0.142 | –0.075 to 0.119 |
| p-value | 0.277 | 0.405 | 0.652 |
| Cadmium | |||
| β | –0.022 | 0.018 | –0.059 |
| 95% CI | –0.194 to 0.150 | –0.156 to 0.191 | –0.256 to 0.138 |
| p-value | 0.800 | 0.840 | 0.556 |
hsCRP: high-sensitivity C-reactive protein; CSGLM: complex samples general linear model; β: linear coefficient; CI: confidence interval.
aAdjusted for age, sex;
bAdjusted for age, sex, body mass index, estimated glomerular filtration rate, smoking, alcohol, education, income, physical activity, and underlying diseases. The concentrations of blood lead, mercury, cadmium, and hsCRP were all log-transformed for the analysis.
- 1. Jang I, Lee HY, Lee E. Geriatrics fact sheet in Korea 2018 from national statistics. Ann Geriatr Med Res 2019;23(2):50–3.ArticlePubMedPMC
- 2. Oh J, Seo J, Park HJ. Cause of death statistics in 2022 in the Republic of Korea. Ewha Med J 2025;48(3):e46.ArticlePubMedPMCPDF
- 3. Roth GA, Mensah GA, Johnson CO, Addolorato G, Ammirati E, Baddour LM, et al. Global burden of cardiovascular diseases and risk factors, 1990-2019: update from the GBD 2019 study. J Am Coll Cardiol 2020;76(25):2982–3021.PubMedPMC
- 4. Alissa EM, Ferns GA. Heavy metal poisoning and cardiovascular disease. J Toxicol 2011;2011:870125.ArticlePubMedPMCPDF
- 5. Lanphear BP, Rauch S, Auinger P, Allen RW, Hornung RW. Low-level lead exposure and mortality in US adults: a population-based cohort study. Lancet Public Health 2018;3(4):e177–84.ArticlePubMed
- 6. Salonen JT, Seppanen K, Nyyssonen K, Korpela H, Kauhanen J, Kantola M, et al. Intake of mercury from fish, lipid peroxidation, and the risk of myocardial infarction and coronary, cardiovascular, and any death in eastern Finnish men. Circulation 1995;91(3):645–55.ArticlePubMedPMC
- 7. Tellez-Plaza M, Navas-Acien A, Menke A, Crainiceanu CM, Pastor-Barriuso R, Guallar E. Cadmium exposure and all-cause and cardiovascular mortality in the U.S. general population. Environ Health Perspect 2012;120(7):1017–22.ArticlePubMedPMC
- 8. Masindi V, Muedi KL. Environmental contamination by heavy metals. In: Saleh HE, Algan RF, editors. Heavy Metals. London, UK: IntechOpen; 2018, 115–32.
- 9. Gautam PK, Gautam RK, Banerjee S, Chattopadhyaya MC, Pandey JD. Heavy metals in the environment: fate, transport, toxicity and remediation technologies. In: Pathania D, editor. Heavy Metals: Sources, Toxicity and Remediation Techniques. New York, NY: Nova Science Publishers; 2016, 101–30.
- 10. Briffa J, Sinagra E, Blundell R. Heavy metal pollution in the environment and their toxicological effects on humans. Heliyon 2020;6(9):e04691.ArticlePubMedPMC
- 11. Jomova K, Valko M. Advances in metal-induced oxidative stress and human disease. Toxicology 2011;283(2-3):65–87.ArticlePubMed
- 12. Sugamura K, Keaney JF Jr. Reactive oxygen species in cardiovascular disease. Free Radic Biol Med 2011;51(5):978–92.ArticlePubMedPMC
- 13. Anka AU, Usman AB, Kaoje AN, Kabir RM, Bala A, Kazem Arki M, et al. Potential mechanisms of some selected heavy metals in the induction of inflammation and autoimmunity. Eur J Inflamm 2022;20:1–14.ArticlePDF
- 14. Shrivastava AK, Singh HV, Raizada A, Singh SK. C-reactive protein, inflammation and coronary heart disease. Egypt Heart J 2015;67(2):89–97.Article
- 15. Risher JF, Todd GD, Meyer D, Zunker CL. The elderly as a sensitive population in environmental exposures: making the case. Rev Environ Contam Toxicol 2010;207:95–157.ArticlePubMed
- 16. Gorni D, Finco A. Oxidative stress in elderly population: a prevention screening study. Aging Med (Milton) 2020;3(3):205–13.ArticlePubMedPMCPDF
- 17. Dybing E, Soderlund EJ. Situations with enhanced chemical risks due to toxicokinetic and toxicodynamic factors. Regul Toxicol Pharmacol 1999;30(2 Pt 2):S27–30.ArticlePubMed
- 18. Pai JK, Pischon T, Ma J, Manson JE, Hankinson SE, Joshipura K, et al. Inflammatory markers and the risk of coronary heart disease in men and women. N Engl J Med 2004;351(25):2599–610.ArticlePubMed
- 19. Folsom AR, Aleksic N, Catellier D, Juneja HS, Wu KK. C-reactive protein and incident coronary heart disease in the Atherosclerosis Risk In Communities (ARIC) study. Am Heart J 2002;144(2):233–8.ArticlePubMed
- 20. Ridker PM, Cushman M, Stampfer MJ, Tracy RP, Hennekens CH. Inflammation, aspirin, and the risk of cardiovascular disease in apparently healthy men. N Engl J Med 1997;336(14):973–9.ArticlePubMedPMC
- 21. Ridker PM, Rifai N, Rose L, Buring JE, Cook NR. Comparison of C-reactive protein and low-density lipoprotein cholesterol levels in the prediction of first cardiovascular events. N Engl J Med 2002;347(20):1557–65.ArticlePubMedPMC
- 22. Yang C, Zhang J, Liu H, Hong Q, Fan Y, An J, et al. Health effects of mixed metal exposure on accelerating aging among the elderly population. Ecotoxicol Environ Saf 2025;291:117760.ArticlePubMed
- 23. Lim C, Lee S, Seo SM, Park KW, Kim GM, Choe BM, et al. Association between cognitive decline and ten heavy metals. J Environ Health Sci 2022;48(6):306–14.Article
- 24. Cheema S, Hussain SI, Faheem MSB, Jalal AA, Rifai M, Dar A, et al. Toxic heavy metal exposure and heart health: a systematic review and meta-analysis of 324,331 patients. BMC Cardiovasc Disord 2025;25(1):792.ArticlePubMedPMCPDF
- 25. Clyne B, Olshaker JS. The C-reactive protein. J Emerg Med 1999;17(6):1019–25.ArticlePubMedPMC
- 26. Hwang YS. Clinical Laboratory Test for the Seventh Korea National Health and Nutrition Examination Survey (2016-2018). Seoul, Korea: Seegene Medical Foundation; 2016.
- 27. Ruckart PZ, Jones RL, Courtney JG, LeBlanc TT, Jackson W, Karwowski MP, et al. Update of the blood lead reference value - United States, 2021. MMWR Morb Mortal Wkly Rep 2021;70(43):1509–12.ArticlePubMedPMC
- 28. Roshan VD, Assali M, Moghaddam AH, Hosseinzadeh M, Myers J. Exercise training and antioxidants: effects on rat heart tissue exposed to lead acetate. Int J Toxicol 2011;30(2):190–6.ArticlePubMedPDF
- 29. Simoes MR, Preti SC, Azevedo BF, Fiorim J, Freire DD Jr, Covre EP, et al. Low-level chronic lead exposure impairs neural control of blood pressure and heart rate in rats. Cardiovasc Toxicol 2017;17(2):190–9.ArticlePubMedPDF
- 30. Silva MASC, de Oliveira TF, Almenara CCP, Broseghini-Filho GB, Vassallo DV, Padilha AS, et al. Exposure to a low lead concentration impairs contractile machinery in rat cardiac muscle. Biol Trace Elem Res 2015;167(2):280–7.ArticlePubMedPDF
- 31. Sirivarasai J, Wananukul W, Kaojarern S, Chanprasertyothin S, Thongmung N, Ratanachaiwong W, et al. Association between inflammatory marker, environmental lead exposure, and glutathione S-transferase gene. Biomed Res Int 2013;2013:474963.ArticlePubMedPMCPDF
- 32. Peters JL, Kubzansky LD, Ikeda A, Fang SC, Sparrow D, Weisskopf MG, et al. Lead concentrations in relation to multiple biomarkers of cardiovascular disease: the normative aging study. Environ Health Perspect 2012;120(3):361–6.ArticlePubMedPMC
- 33. Obeng-Gyasi E, Armijos RX, Weigel MM, Filippelli GM, Sayegh MA. Cardiovascular-related outcomes in U.S. adults exposed to lead. Int J Environ Res Public Health 2018;15(4):759.ArticlePubMedPMC
- 34. Ma S, Zhang J, Xu C, Da M, Xu Y, Chen Y, et al. Increased serum levels of cadmium are associated with an elevated risk of cardiovascular disease in adults. Environ Sci Pollut Res Int 2022;29(2):1836–44.ArticlePubMedPDF
- 35. Kim K, Park H. Association of mercury exposure with the serum high-sensitivity C-reactive protein level in Korean adults. Front Public Health 2023;11:1062741.ArticlePubMedPMC
- 36. Baek S, Yoon J. Association between heavy metals exposure and elevated high-sensitivity C-reactive protein: mediating role of body mass index. Biomolecules 2025;15(11):1491.ArticlePubMedPMC
- 37. Qing Y, Zheng J, Luo Y, Li S, Liu X, Yang S, et al. The impact of metals on cognitive impairment in the elderly and the mediating role of oxidative stress: a cross-sectional study in Shanghai, China. Ecotoxicol Environ Saf 2024;286:117152.ArticlePubMed
- 38. Vaziri ND, Khan M. Interplay of reactive oxygen species and nitric oxide in the pathogenesis of experimental lead-induced hypertension. Clin Exp Pharmacol Physiol 2007;34(9):920–5.ArticlePubMed
- 39. Daniel S, Limson JL, Dairam A, Watkins GM, Daya S. Through metal binding, curcumin protects against lead- and cadmium-induced lipid peroxidation in rat brain homogenates and against lead-induced tissue damage in rat brain. J Inorg Biochem 2004;98(2):266–75.ArticlePubMed
- 40. Dursun N, Arifoglu C, Suer C, Keskinol L. Blood pressure relationship to nitric oxide, lipid peroxidation, renal function, and renal blood flow in rats exposed to low lead levels. Biol Trace Elem Res 2005;104(2):141–9.ArticlePubMed
- 41. Struzynska L, Dabrowska-Bouta B, Koza K, Sulkowski G. Inflammation-like glial response in lead-exposed immature rat brain. Toxicol Sci 2007;95(1):156–62.ArticlePubMed
- 42. Xu L, Mu F, Zhao J, He Q, Cao C, Yang H, et al. Lead induces apoptosis and histone hyperacetylation in rat cardiovascular tissues. PLoS One 2015;10(6):e0129091.ArticlePubMedPMC
- 43. Zhu X, Fan Y, Sheng J, Gu L, Tao Q, Huang R, et al. Association between blood heavy metal concentrations and dyslipidemia in the elderly. Biol Trace Elem Res 2021;199(4):1280–90.ArticlePubMedPDF
- 44. Asgary S, Movahedian A, Keshvari M, Taleghani M, Sahebkar A, Sarrafzadegan N. Serum levels of lead, mercury and cadmium in relation to coronary artery disease in the elderly: a cross-sectional study. Chemosphere 2017;180:540–4.ArticlePubMed
- 45. Lakatta EG. Age-associated cardiovascular changes in health: impact on cardiovascular disease in older persons. Heart Fail Rev 2002;7(1):29–49.ArticlePubMedPDF
- 46. Tsaih S, Korrick S, Schwartz J, Amarasiriwardena C, Aro A, Sparrow D, et al. Lead, diabetes, hypertension, and renal function: the normative aging study. Environ Health Perspect 2004;112(11):1178–82.ArticlePubMedPMC
- 47. Bjorklund G, Pivina L, Dadar M, Semenova Y, Chirumbolo S, Aaseth J. Long-term accumulation of metals in the skeleton as related to osteoporotic derangements. Curr Med Chem 2020;27(40):6837–48.ArticlePubMedPDF
- 48. Nie H, Sanchez BN, Wilker E, Weisskopf MG, Schwartz J, Sparrow D, et al. Bone lead and endogenous exposure in an environmentally exposed elderly population: the normative aging study. J Occup Environ Med 2009;51(7):848–57.ArticlePubMedPMC
REFERENCES
Figure & Data
REFERENCES
Citations
Citations to this article as recorded by 
 Cite
Cite- Figure
-
- Related articles
-
- Relationship between long-term PM2.5 exposure and myopia prevalence in adults: analysis of the Korea National Health and Nutrition Examination Survey–Air Pollution Linked Data, 2020
- Exploring the impact of age and socioeconomic factors on health-related unemployment using propensity score matching: results from Korea National Health and Nutrition Examination Survey (2015–2017)
Association between heavy metal exposure and high-sensitivity C-reactive protein in the elderly: Korea National Health and Nutrition Examination Survey (KNHANES) 2016–2017

Fig. 1. Flowchart illustrating the selection of study participants from KNHANES (2016–2017). hsCRP: high-sensitivity C-reactive protein; KNHANES: Korea National Health and Nutrition Examination Survey.
Fig. 1.
Association between heavy metal exposure and high-sensitivity C-reactive protein in the elderly: Korea National Health and Nutrition Examination Survey (KNHANES) 2016–2017
| Variable | No. (weighted %) | Estimated GM (95% CI) |
|---|---|---|
| Total | 884 | 0.78 (95% CI 0.73–0.84) |
| Age (years) | ||
| 65–69 | 329 (40.2) | 0.77 (0.68–0.86) |
| 70–74 | 250 (29.5) | 0.77 (0.67–0.89) |
| 75–79 | 210 (21.1) | 0.79 (0.69–0.91) |
| ≥ 80 | 95 (9.2) | 0.85 (0.69–1.04) |
| p-value | 0.856 | |
| Sex | ||
| Male | 385 (43.7) | 0.84 (0.76–0.92) |
| Female | 499 (56.3) | 0.74 (0.67–0.82) |
| p-value | 0.066 | |
| BMI (kg/m2) | ||
| <18.5 | 26 (2.9) | 0.55 (0.38–0.78) |
| 18.5–22.9 | 297 (32.5) | 0.68 (0.60–0.77) |
| 23.0–24.9 | 212 (24.6) | 0.69 (0.62–0.78) |
| ≥25.0 | 349 (40.0) | 0.96 (0.85–1.08) |
| p-value | <0.001 | |
| Monthly income (million KRW) | ||
| <2.5 | 603 (60.1) | 0.82 (0.76–0.89) |
| 2.5–5.0 | 173 (23.3) | 0.67 (0.58–0.78) |
| ≥5.0 | 108 (16.6) | 0.79 (0.64–0.99) |
| p-value | 0.108 | |
| Smoking status | ||
| Current | 79 (8.2) | 0.76 (0.62–0.93) |
| Never or former | 805 (91.8) | 0.78 (0.73–0.84) |
| p-value | 0.784 | |
| Alcohol consumption | ||
| Yes | 328 (39.5) | 0.83 (0.75–0.92) |
| No | 556 (60.5) | 0.75 (0.68–0.82) |
| p-value | 0.119 | |
| Physical activity (minute/week) | ||
| <150 | 592 (65.2) | 0.77 (0.71–0.84) |
| ≥150 | 292 (34.8) | 0.80 (0.71–0.91) |
| p-value | 0.612 | |
| Education | ||
| <High school | 641 (67.5) | 0.78 (0.72–0.84) |
| High school | 145 (18.9) | 0.81 (0.68–0.98) |
| ≥College | 98 (13.6) | 0.75 (0.62–0.91) |
| p-value | 0.830 | |
| Underlying diseases |
||
| Yes | 564 (62.9) | 0.78 (0.71–0.86) |
| No | 320 (37.1) | 0.78 (0.69–0.88) |
| p-value | 0.992 |
| Variable | hsCRP (mg/L) | Lead (µg/dL) | Mercury (µg/L) | Cadmium (µg/L) |
|---|---|---|---|---|
| Median (P25–P75) | 0.65 (0.40–1.30) | 1.94 (1.51–2.45) | 3.02 (1.90–4.76) | 1.17 (0.88–1.62) |
| GM (95% CI) | 0.78 (0.73–0.84) | 1.94 (1.87–2.01) | 3.10 (2.83–3.40) | 1.19 (1.13–1.25) |
| Variable | No. (weighted %) | Estimated GM (95% CI) |
|---|---|---|
| Total | 884 | 0.78 (95% CI 0.73–0.84) |
| Lead | ||
| 0–25th percentile | 207 (24.8) | 0.75 (0.65–0.86) |
| 25th–50th percentile | 214 (25.0) | 0.71 (0.62–0.81) |
| 50th–75th percentile | 220 (25.1) | 0.75 (0.67–0.84) |
| 75th–100th percentile | 243 (25.2) | 0.93 (0.81–1.07) |
| p-value | 0.035 | - |
| p for trend | 0.019 | - |
| Mercury | ||
| 0–25th percentile | 219 (24.8) | 0.71 (0.63–0.80) |
| 25th–50th percentile | 230 (25.2) | 0.75 (0.64–0.88) |
| 50th–75th percentile | 214 (25.1) | 0.84 (0.72–0.99) |
| 75th–100th percentile | 221 (25.0) | 0.82 (0.72–0.94) |
| p-value | 0.248 | - |
| p for trend | 0.071 | - |
| Cadmium | ||
| 0–25th percentile | 213 (24.8) | 0.83 (0.72–0.96) |
| 25th–50th percentile | 206 (25.1) | 0.71 (0.62–0.81) |
| 50th–75th percentile | 234 (25.0) | 0.81 (0.71–0.93) |
| 75th–100th percentile | 231 (25.0) | 0.78 (0.66–0.92) |
| p-value | 0.322 | - |
| p for trend | 0.850 | - |
| Variable | Unadjusted | Adjusted |
Adjusted |
|---|---|---|---|
| Lead | |||
| β | 0.225 | 0.195 | 0.176 |
| 95% CI | 0.067 to 0.383 | 0.033 to 0.357 | 0.015 to 0.337 |
| p-value | 0.005 | 0.019 | 0.032 |
| Mercury | |||
| β | 0.055 | 0.042 | 0.022 |
| 95% CI | –0.044 to 0.154 | –0.057 to 0.142 | –0.075 to 0.119 |
| p-value | 0.277 | 0.405 | 0.652 |
| Cadmium | |||
| β | –0.022 | 0.018 | –0.059 |
| 95% CI | –0.194 to 0.150 | –0.156 to 0.191 | –0.256 to 0.138 |
| p-value | 0.800 | 0.840 | 0.556 |
Table 1. Estimated GM (mg/L) concentration of hsCRP by demographic characteristics
Values are presented as unweighted numbers (weighted %) or weighted geometric means (95% CI). GM: geometric mean; hsCRP: high-sensitivity C-reactive protein; CI: confidence interval; BMI: body mass index. Current prevalence of hypertension, diabetes, and hyperlipidemia.
Table 2. Distribution of hsCRP, lead, mercury, and cadmium
All values are presented as weighted estimates. hsCRP: high-sensitivity C-reactive protein; P25: 25th percentile; P75: 75th percentile; GM: geometric mean; CI: confidence interval.
Table 3. Estimated GM (mg/L) concentration of hsCRP by quartiles of each blood lead, mercury, and cadmium concentration
Values are presented as unweighted numbers (weighted %) or weighted geometric means (95% CI). GM: geometric mean; hsCRP: high-sensitivity C-reactive protein; CI: confidence interval.
Table 4. Association of lead, mercury, and cadmium exposure with hsCRP using a CSGLM analysis
hsCRP: high-sensitivity C-reactive protein; CSGLM: complex samples general linear model; β: linear coefficient; CI: confidence interval. Adjusted for age, sex; Adjusted for age, sex, body mass index, estimated glomerular filtration rate, smoking, alcohol, education, income, physical activity, and underlying diseases. The concentrations of blood lead, mercury, cadmium, and hsCRP were all log-transformed for the analysis.

