
Articles
- Page Path
- HOME > Ann Occup Environ Med > Volume 36; 2024 > Article
- Original Article Rotating shift and BMI increase among healthcare workers in a military hospital: pre- and post-pandemic analysis in Taiwan
-
Zong-Ming Chen1,2
 , Ro-Ting Lin2
 -
Annals of Occupational and Environmental Medicine 2024;36:e15.
DOI: https://doi.org/10.35371/aoem.2024.36.e15
Published online: June 21, 2024
1Taichung Armed Forces General Hospital, Taichung, Taiwan.
2Department of Occupational Safety and Health, College of Public Health, China Medical University, Taichung, Taiwan.
- Correspondence: Ro-Ting Lin. Department of Occupational Safety and Health, College of Public Health, China Medical University, No. 100, Sec. 1, Jing-Mao Rd., Beitun Dist., Taichung 406040, Taiwan. roting@mail.cmu.edu.tw
• Received: April 11, 2024 • Revised: May 30, 2024 • Accepted: June 18, 2024
Copyright © 2024 Korean Society of Occupational & Environmental Medicine
This is an Open Access article distributed under the terms of the Creative Commons Attribution Non-Commercial License (https://creativecommons.org/licenses/by-nc/4.0/) which permits unrestricted non-commercial use, distribution, and reproduction in any medium, provided the original work is properly cited.
Abstract
-
Background The increasing prevalence of high body mass index (BMI) emphasizes the need for action. Understanding of BMI factors among military hospital healthcare workers remains limited. This study aims to address this gap by analyzing BMI risk factors and changes pre- and post-coronavirus 2019 pandemic among military hospital healthcare workers in central Taiwan from 2019 to 2021.
-
Methods Conducted at a military hospital in central Taiwan, this study analyzed anonymized health examination data from 2019 to 2021 for 483 healthcare workers. We performed generalized estimating equations to investigate trends in BMI and its association with various factors, including age, sex, job titles, military status, job tenure, work shifts, and lifestyle habits.
-
Results The risk of increased BMI was higher in 2021 compared to 2019 (risk ratio [RR]: 1.008, 95% confidence interval [CI]: 1.001–1.014). Individuals on rotating shifts had a higher risk of increased BMI compared to day shift workers (RR: 1.021; 95% CI: 1.008–1.035) and higher odds of obesity (odds ratio: 1.546; 95% CI: 1.099–2.175). Among obese individuals, BMI in soldiers was approximately 4.9% lower than in non-soldiers (RR: 0.951; 95% CI: 0.915–0.988).
-
Conclusions This study identified a significant post-pandemic increase in BMI among healthcare workers in a Taiwanese military hospital, with rotating shifts being a key risk factor for both increased BMI and obesity. Work-related factors influenced BMI changes among obese individuals, while non-work-related factors were significant for non-obese individuals. These findings highlight the broader effects of the pandemic and the specific impact of work-related factors on obese healthcare workers.
BACKGROUND
Nearly 5 million individuals globally died from diseases associated with obesity, defined as having a body mass index (BMI) exceeding 25 kg/m2.1 Excessive BMI increases the risks of numerous health problems, such as high blood pressure, type 2 diabetes, metabolic syndrome, cardiovascular disease, and cancer, resulting in substantial healthcare expenses and productivity declines.2 The increasing prevalence of BMI exceeding the standard underscores the need for collaborative action to tackle this global health issue.3
High BMI of healthcare workers is of specific concern, as it affects their ability to provide high-quality care.4 Despite advising patients on health matters, many healthcare workers overlook their own well-being due to prolonged working hours and elevated stress levels, leading to the adoption of unhealthy habits.5 Previous research reveals a higher prevalence of healthcare workers exceeding the standard BMI compared to the general population in (54% vs. 50% in Malaysia).6,7 In contrast, the UK and Taiwan exhibit lower percentages of healthcare workers with elevated BMIs compared to the general population (19% vs. 26% in nurses in South Korea, 36% vs. 39% in Taiwan, and 49% vs. 60% in UK respectively).5,8,9 Addressing healthcare workers’ BMI facilitates the fulfillment of their duties effectively and sets positive examples for patients.10
Soldiers are typically expected to maintain a certain level of physical fitness, often resulting in a lower average BMI compared to the general population. However, several studies have revealed higher percentages of soldiers exceeding the standard BMI in several countries: Czech Republic (53% vs. 26%), Taiwan (57%–63% vs. 44%–51%), and the United States (65% vs. 35%).11,12,13,14 In contrast, South Korea demonstrated lower percentages among soldiers compared to the general population (21% vs. 29%).15
Military hospitals play a critical role in safeguarding soldiers’ health during peacetime and supporting healthcare needs during wartime.16 Amidst the coronavirus 2019 (COVID-19) pandemic, healthcare workers continued to provide essential services, including polymerase chain reaction testing.17 Given the dual responsibilities of preparing for national emergencies like the COVID-19 pandemic while delivering routine healthcare, military hospitals face unique challenges compared to civilian facilities.18 Numerous studies have explored BMI risk factors among hospital healthcare workers and military personnel. In summary, these studies have found that soldiers tend to have a higher BMI than non-soldiers,11,12,13,14 nurses have a higher BMI than non-nurses (e.g., physicians, technicians, and administrators),6 and shift workers have a higher BMI than day workers.9,19 However, there remains a gap in understanding these factors specifically among military hospital healthcare workers. This study aims to bridge this gap by analyzing BMI risk factors and changes before and after the COVID-19 pandemic among military hospital healthcare workers.
METHODS
This retrospective study utilized data from 2019 to 2021 to compare BMI changes before and after the COVID-19 pandemic. The study was conducted at a military hospital in central Taiwan. Data were exported from the hospital’s health examination databank, delinked, and anonymized for analysis.
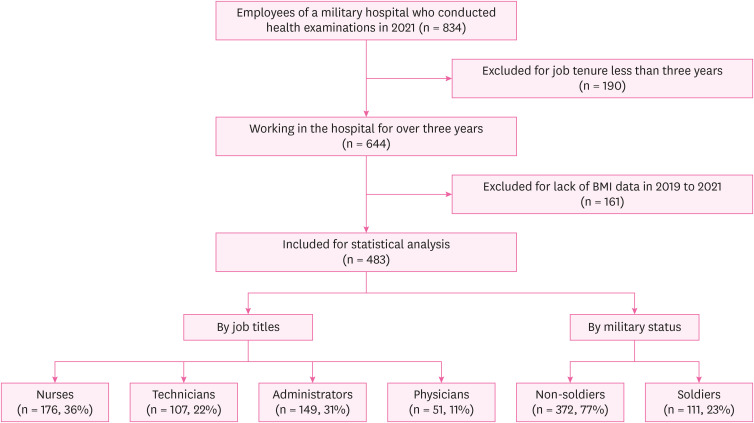
The estimated sample size for this study was 376 participants, based on a prior national study reporting a prevalence of exceeded standard BMI among 64,356 Taiwan military personnel at 57.4%, with a precision (absolute error) of 5% and a type I error of 5%.13,20 In our investigation, we identified 834 healthcare workers who had undergone health examinations in 2021 and were eligible for inclusion. Health examinations were conducted at the physical examination center of the hospital. Following screening for eligibility criteria, 190 participants were excluded due to less than three years of employment, and an additional 161 were excluded due to lack of BMI data from 2019 to 2021. Finally, 483 healthcare workers were included for statistical analysis, categorized into four groups based on job titles and two groups based on military status. The study flowchart is presented in Fig. 1.
We collected data on BMI, age, sex and work-related factors. We followed the Ministry of Health’s definition of obesity, classifying individuals as obese if their BMI was ≥ 27 kg/m2 and as non-obese if their BMI was < 27 kg/m2.21 Work-related factors include job titles, job tenure, military status, work shift, and weekly working hours. Job titles were categorized into physicians, nurses, technicians, and administrators. Military status was classified as soldiers and non-soldiers. Work shift was categorized based on shift rotation or not (yes vs. no). Non-shift rotation workers followed a fixed day schedule starting at 08:00 and ending at 17:30, defined as day work. Shift rotation included various schedules (i.e., 08:00–17:30, 08:00–16:00, 07:00–15:00, 16:00–24:00, and 24:00–08:00), with rotations occurring on average once a month across these schedules, defined as rotating shift. Weekly working hours were classified into two categories: ≤ 40 hours vs. > 40 hours per week over the past month.
In addition to work-related factors, data on lifestyle-related factors of BMI were collected. These included weekly exercise hours (defined as physical activity exceeding 30 minutes at a time within the past month), cigarette smoking habits (defined as self-reported regular cigarette smoking: yes vs. no), and alcohol drinking habits (defined as self-reported alcohol consumption: yes vs. no).
We used Kruskal-Wallis tests to compare BMI, age, and work tenure among four groups (physicians, nurses, technicians, and administrators), given the non-normal distributions of these variables. Fisher’s exact test was performed to compare proportions of sex, military status, work shift, weekly working hours, weekly exercising hours, cigarette smoking, alcohol drinking, as well as obesity across these groups.
In this study, we utilized generalized estimating equations (GEE) to account for multiple covariates and repeated measures. Given that BMI is not normally distributed and is slightly skewed to the right, we log-transformed BMI and treated it as the dependent continuous variable in the GEE model with a normal distribution and identity link function to analyze trends in BMI over the 3-year period and associations with identified risk factors. The covariates included in the model were time-varying variables (i.e., year, age, job tenure, work shift, average weekly working hours, average weekly exercising hours, cigarette smoking habits, and alcohol drinking habits) and time-invariant variables (i.e., sex, job title, and military status). The GEE method accounts for the correlation within repeated measures for each subject by using an autoregressive correlation structure.
We performed subgroup analyses for individuals with and without obesity using the aforementioned GEE model with a normal distribution and identity link, with log-transformed BMI as the dependent continuous variable, adjusting for covariates. Finally, we treated obesity as a binary dependent variable and used a GEE model with a binomial distribution and logit link function, adjusting for covariates, to estimate the odds of obesity.
All statistical analyses were performed using SAS version 9.4 (SAS Institute, Cary, NC, USA), with a significance level set at p < 0.05.
The request to waive informed consent was reviewed and approved by the Institutional Review Board (IRB) of the Tri-Service General Hospital (TSGH IRB No. A202205037).
RESULTS
Table 1 shows the baseline characteristics of 483 participants categorized by their job titles. Nurses constitute the largest group (36.4%), followed by administrators (30.8%), technicians (22.2%), and physicians (10.6%). The mean BMI for all participants was 24.1 ± 3.9, with physicians recording the highest mean BMI at 26.0 ± 3.4. The overall prevalence of obesity (BMI ≥ 27) was 20.7%, with the highest prevalence observed among physician at 31.4%. Administrators had the highest mean age and duration of work, at 46.9 years and 16.5 years, respectively, whereas nurses had the lowest mean age of 40.1 years, and physicians the fewest mean duration of work at 10.8 years. There was a significant gender difference, with the physician group being predominantly men (98.0%) compared to a higher percentage of women in the other categories (94.3% of nurses, 74.8% of technicians, and 73.2% of administrators). Regarding military status, the majority were non-soldiers (77.0%), with the exception of physicians, 92.2% of whom were soldiers. Over half (53.8%) of the study population worked in in rotating shifts, particularly among physicians (86.3%) and nurses (73.9%). Moreover, 95.2% of participants reported working 40 hours or fewer per week. Lifestyle habits, including weekly exercising hours, cigarette smoking, and alcohol drinking, showed minor variations across job titles.
Table 1
Baseline characteristics in 2019, by job titles
Values are presented as mean ± standard deviation, median [interquartile range], or number (%).
BMI: body mass index; SD: standard deviation; IQR: interquartile range.
a Kruskal-Wallis test was performed to compare the group differences for continuous variables and Fisher’s exact test was performed to compare the group differences for binary variables.
*p < 0.05, **p < 0.01, ***p < 0.001.
Table 2 shows the association between BMI and various determinants. Compared with the baseline year of 2019, the risk of increased BMI was slightly higher in 2020 (risk ratio [RR]: 1.004; 95% confidence interval [CI]: 1.000–1.009; p = 0.059) and significantly higher in 2021 (RR: 1.008; 95% CI: 1.001–1.014; p = 0.017). A pronounced gender disparity was observed, with men exhibiting a significantly higher risk of increased BMI than women (RR: 1.077; 95% CI: 1.034–1.121; p < 0.001). Furthermore, those on rotating shifts had a greater risk of increased BMI compared to day shift workers (RR: 1.021; 95% CI: 1.008–1.035; p = 0.002). Although other work-related and lifestyle-factors presented varying levels of risk, these differences were not statistically significant. For example, when comparing different job titles to nurses, technicians, administrators, and physicians showed varying RRs (1.002–1.031; p > 0.05). Similarly, soldiers had slightly lower risks of increased BMI compared to compared to their counterparts but without statistical significance (RR: 0.994; p > 0.05).
Table 2
Association between risk factors and BMI increase among total participants and by obesity status
The multivariate analysis was performed using generalized estimating equations, accounting for year, age, job tenure, sex, job title, military status, work shift, average weekly working hours, average weekly exercise hours, cigarette smoking habits, and alcohol consumption.
BMI: body mass index; RR: risk ratio; CI: confidence interval.
*p < 0.05, **p < 0.01, ***p < 0.001.
Subgroup analyses were also conducted for obese and non-obese individuals (Table 2). Among the obese individuals, work-related variables showed statistically significant associations with BMI, including military status and work shift. Obese individuals on rotating shifts had a statistically significant increase in BMI by approximately 2.1% compared to those on day shifts (RR: 1.021; 95% CI: 1.003–1.040; p = 0.021). In contrast, BMI in soldiers was approximately 4.9% lower than in non-soldiers (RR: 0.951; 95% CI: 0.915–0.988; p = 0.010). Among the non-obese individuals, significant associations with increased BMI were found for non-work-related factors such as age (RR: 1.003; 95% CI: 1.001–1.005; p < 0.001) and sex, with men having a higher risk compared to women (RR: 1.062; 95% CI: 1.032–1.094; p < 0.001). These findings suggest that while overall trends in BMI increase were observed over the three-year period, specific determinants such as work-related factors played significant roles in influencing BMI changes among obese individuals, whereas non-work-related factors played significant roles in influencing BMI changes among non-obese individuals.
Table 3 presents the association between various risk factors and obesity, as presented using odds ratios (ORs). Sex and work shift are significant determinants of obesity, with men and individuals on rotating shifts showing higher odds of obesity. Men had significantly higher odds of obesity compared to women (OR: 2.004; 95% CI: 1.098–3.658; p = 0.024). Individuals on rotating shifts had significantly higher odds of obesity compared to those on day shifts (OR: 1.546; 95% CI: 1.099–2.175; p = 0.012). Other factors, such as age, job tenure, job title, military status, working hours, exercise, smoking, and drinking habits, did not show statistically significant associations with obesity in this study.
Table 3
Association between risk factors and obesity among total participants
The multivariate analysis was performed using generalized estimating equations, accounting for year, age, job tenure, sex, job title, military status, work shift, average weekly working hours, average weekly exercise hours, cigarette smoking habits, and alcohol consumption.
OR: odds ratio; CI: confidence interval.
*p < 0.05, **p < 0.01, ***p < 0.001.
DISCUSSION
Our study investigated the risk factors for increased BMI and obesity among healthcare workers in a military hospital, finding significant associations with rotating shift work. Participants in 2021 had a higher risk of increased BMI compared to 2019 (RR: 1.008). Work-related factors (military status and work shift) played significant roles in influencing BMI changes among obese individuals, whereas non-work-related factors (age and sex) played significant roles in influencing BMI changes among non-obese individuals. These findings emphasize the importance of addressing both work-related and non-work-related factors in managing BMI and obesity among healthcare workers.
Our study highlights that rotating shift workers face a significantly higher risk of elevated BMI and obesity compared to their day-working counterparts. The challenges for rotating shift workers stem from irregular working hours and the constant need to adjust their life rhythms, complicating the establishment of healthy habits such as consistent meal times, regular exercise, and adequate sleep.22,23 In particular, the disruption caused by irregular working hours can lead to insufficient sleep, which has been shown to increase ghrelin levels,22 a hormone that stimulates appetite, thus potentially leading to overeating and weight gain.24 Research indicates that for each hour of sleep lost relative to the standard seven hours, the risk of having a BMI above the standard increases by 9%.25 Both insufficient sleep (less than 7 hours) and excessive daytime sleep have been linked with higher odds of surpassing the standard BMI.25 Among rotating shift workers, night shift workers particularly show a stronger association with increased BMI, partly due to the significant “social jetlag” arising from the mismatch between their work schedules and natural rest periods.26,27 This misalignment can increase the risk of increased BMI. In our study, workers on the 16:00–24:00 shift typically finish work at midnight, perform their personal routines (e.g., showers and dining), and go to bed usually after 3:00 am. Frequent shift rotations may exacerbate the problem, with weekly rotations associated with a 6%–8% higher risk of increased BMI compared to monthly rotations.28 These findings underscore the potential impact of disrupted sleep patterns and irregular lifestyles on hormonal fluctuations and weight gain among rotating shift workers.
We found that among obese individuals, BMI in soldiers was approximately 4.9% lower than in non-soldiers (RR: 0.951; p = 0.010). Previous studies have indicated differences in BMI among soldiers compared to the non-soldiers, revealing varied effects across different groups.11,12,13,14,15 Our finding of different effects in different populations aligns with this phenomenon. Specifically, in the obese group, soldiers had a lower BMI compared to non-soldiers, which is consistent with a previous South Korean study that showed soldiers had a lower average BMI.15 Soldiers may have a slight advantage in maintaining lower BMI within the obese category, but this protective effect does not extend to the non-obese group. This indicates that military status may influence BMI differently depending on the baseline obesity status of individuals. These findings underscore the need for tailored interventions that consider both work-related and non-work-related factors in managing BMI and obesity, particularly among healthcare workers in military settings. Addressing these factors is crucial in ensuring the health and fitness of military personnel, which can have significant implications for their overall performance and readiness.
Our analysis revealed that male participants had a significantly higher risk of increased BMI and obesity than female participants, consistent with findings from previous research.29,30 Men comprised 26.3% of our study cohort, with the majority (39.4%) being physicians. Physicians often spend extended hours seated during night shifts in consultation rooms, resulting in limited physical activity compared to nurses. Furthermore, the timing of night clinics, often commencing post-dinner, restricts opportunities for exercise, thereby accentuating the sedentary nature of their roles. This lifestyle significantly contributes to an increased obesity risk among male staffs.31 Conversely, women, who represented 73.7% of participants, mainly filled nurses. Their position, inherently more physically demanding, coupled with a greater health consciousness,30 likely contribute to their healthier BMI levels. Women’s proactive approach to wellness and weight management, including careful attention to diet and physical activity, contrasts with the challenges faced by men, leading to a notable difference in obesity prevalence between genders. This divergence underscores the impact of occupational activity levels and health awareness on BMI differences. It also highlights the need for further investigation into sex-specific challenges and the development of targeted strategies to support healthy BMI maintenance across all professional roles in the healthcare sector.
Our analysis highlighted that participants experienced a significantly higher risk of elevated BMI after COVID-19 pandemic, compared to those in the preceding year, 2019, mirroring the trend seen among US military members where obesity prevalence saw a modest increase of 0.43% during the COVID-19 pandemic.32 The increase in BMI among healthcare workers at the military hospital we studied might be largely attributed to the intensified job demands throughout the two-year span of the pandemic. Following the pandemic’s emergence in January 2020, hospitals introduced rigorous safety protocols, including temperature screenings, travel, occupation, contact, cluster (TOCC) evaluations, and checks on travel history at their entrances. Financial constraints necessitated the reliance on the hospital’s current staff, who were scheduled into rotation shifts to enforce these precautions. Additionally, these workers were called upon to support vaccination drives and COVID-19 rapid antigen tests at military installations, assignments that extended until July 2021. This prolonged engagement with COVID-19 response efforts led to several adverse effects, notably dehydration from prolonged wear of sealed protective clothing and an increased reliance on fast, unhealthy food options owing to compressed eating schedules.33 These elements significantly increased the risk for a higher BMI.2 Thus, the cumulative effect of the overwhelming workload due to pandemic-related hospital activities not only placed an enormous strain on healthcare personnel but also contributed to a significant increase in BMI levels among this cohort in the post-pandemic period.
In our study, no statistically significant associations were observed between job titles, work hours, exercise duration, cigarette smoking, and alcohol intake, and the increase in BMI or obesity among healthcare workers at the studied military hospital. This could be partly attributed to the uneven distribution of sex and military status across different job titles; for instance, 98.0% of physicians were male, and 92.2% were soldiers, highlighting a substantial imbalance. Such disparities may explain the significant findings related to sex. The lack of a significant link between exercising hours and BMI could be due to the broad categorization of exercise duration without considering the intensity of activities, obscuring potential impacts of moderate to intense physical activities. Similarly, the standard categorization of working hours around a 40-hour week threshold may not have captured the nuanced BMI differences possibly present in those working extended hours, as suggested by literature indicating a threshold of 55 hours for notable BMI impact.34 Additionally, the low prevalence of smoking (3.7%), attributable to hospital regulations, and a generalized approach to measuring alcohol consumption without detailing quantity or frequency, likely diluted the potential to discern their impact on BMI. Individuals who consumed even a small amount of alcohol may have been grouped together, leading to a larger proportion of participants falling under the “drinking” category, leading to non-significant association with the risk of increased BMI.
This study investigated BMI trends across various job titles, military statuses, rotating shifts, and sex before and after the COVID-19 pandemic in Taiwan, utilizing data collected from a military hospital spanning three years. However, several limitations warrant caution in interpreting the results. First, the reliance on BMI as a measure does not account for body composition differences, such as muscle mass in athletic individuals, potentially skewing results towards an overestimation of obesity.35 Second, the evaluation of lifestyle factors like cigarette smoking, alcohol consumption, and physical activity was based on self-reports, which did not differentiate between levels of exposure, possibly leading to underestimations of these behaviors’ impact. Notably, our study’s question on alcohol drinking habits was designed dichotomously: those who consumed alcohol and those who did not, regardless of regularity. This design could lead to an overestimation of alcohol consumption, as individuals who drank a specific amount weekly or monthly could have selected “Yes.” Questions with too few options can result in incomplete scales.36 Third, our analysis of BMI changes over time did not include individuals’ disease conditions or clinical biomarkers, such as diabetes and hypertension. This omission is a potential limitation, as some conditions have a bidirectional relationship with BMI. For example, fasting glucose levels and BMI influence each other.37 Not accounting for these factors could lead to an underestimation of BMI changes in populations with a high prevalence of these conditions and vice versa, potentially biasing the results towards the null. Fourth, we observed small effect sizes in our analysis of BMI change. However, the significant risk factors may still contribute to long-term health outcomes. Modest changes in BMI can accumulate over time, increasing the risk of chronic conditions such as cardiovascular disease, diabetes, and other obesity-related disorders. Furthermore, while individual factors might have limited impact, the combined influence of multiple factors can be substantial, emphasizing the need for comprehensive intervention strategies. Despite these limitations, the study offers valuable insights into the BMI trends among healthcare workers in a military setting, highlighting the need for cautious interpretation of its findings.
CONCLUSIONS
This study investigated the risk factors contributing to increased BMI among healthcare workers in a military hospital in Taiwan. We identified a significant increase in BMI among healthcare workers in the military hospital after the COVID-19 pandemic. Rotating shifts emerged as a significant risk factor for both increased BMI and obesity. The risk factors for BMI increase differed based on obesity status; work-related factors influenced BMI changes among obese individuals, while non-work-related factors were significant for non-obese individuals. These findings underscore the broader effects of the pandemic on the physical health of healthcare professionals, specifically highlights its impact of work-related factors among obese healthcare workers in military healthcare settings.
Acknowledgements
The authors thank Ms. Chia-Chen Peng, Taichung Armed Forces General Hospital, for her assistance for this study.
Abbreviations
BMI
body mass index
COVID-19
coronavirus disease 2019
GEE
generalized estimating equations
IQR
interquartile range
OR
odds ratio
RR
risk ratio
SD
standard deviation
TOCC
travel, occupation, contact, cluster
-
Funding: This research was supported by the Taichung Armed Forces General Hospital (grant No. TCAFGH-B-111008), National Science and Technology Council, Taiwan (grant No. NSTC 111-2314-B-039-020-MY2), and China Medical University, Taiwan (grant No. CMU112-MF-76).
-
Competing interests: The authors declare that they have no competing interests.
-
Availability of data and materials: The data that support the findings of this study are available from the corresponding author upon reasonable request.
-
Author contributions:
Conceptualization: Chen ZM, Lin RT.
Data curation: Chen ZM.
Formal analysis: Chen ZM, Lin RT.
Funding acquisition: Chen ZM, Lin RT.
Investigation: Chen ZM.
Methodology: Chen ZM, Lin RT.
Software: Chen ZM, Lin RT.
Validation: Chen ZM, Lin RT.
Visualization: Chen ZM, Lin RT.
Writing - original draft: Chen ZM, Lin RT.
Writing - review & editing: Chen ZM, Lin RT.
NOTES
- 1. Chong B, Jayabaskaran J, Kong G, Chan YH, Chin YH, Goh R, et al. Trends and predictions of malnutrition and obesity in 204 countries and territories: an analysis of the Global Burden of Disease Study 2019. EClinicalMedicine 2023;57:101850. 36864983.ArticlePubMedPMC
- 2. Kopelman P. Health risks associated with overweight and obesity. Obes Rev 2007;8(Suppl 1):13–17. 17316295.ArticlePubMed
- 3. Haslam DW, James WP. Obesity. Lancet 2005;366(9492):1197–1209. 16198769.ArticlePubMed
- 4. Hartanto A, Yong JC, Toh WX. Bidirectional associations between obesity and cognitive function in midlife adults: a longitudinal study. Nutrients 2019;11(10):2343. 31581696.ArticlePubMedPMC
- 5. Mittal TK, Cleghorn CL, Cade JE, Barr S, Grove T, Bassett P, et al. A cross-sectional survey of cardiovascular health and lifestyle habits of hospital staff in the UK: do we look after ourselves? Eur J Prev Cardiol 2018;25(5):543–550. 29198137.ArticlePubMedPMCPDF
- 6. Kunyahamu MS, Daud A, Jusoh N. Obesity among health-care workers: which occupations are at higher risk of being obese? Int J Environ Res Public Health 2021;18(8):4381. 33924182.ArticlePubMedPMC
- 7. Ministry of Health Malaysia, National Institutes of Health (NIH), Institute for Public Health. National Health and Morbidity Survey 2019: Non-Communicable Diseases, Healthcare Demand, and Health Literacy. Shah Alam, Malaysia: Institute for Public Health; 2019.
- 8. Yeh TL, Chen HH, Chiu HH, Chiu YH, Hwang LC, Wu SL. Morbidity associated with overweight and obesity in health personnel: a 10-year retrospective of hospital-based cohort study in Taiwan. Diabetes Metab Syndr Obes 2019;12:267–274. 30881069.PubMedPMC
- 9. Kim MJ, Son KH, Park HY, Choi DJ, Yoon CH, Lee HY, et al. Association between shift work and obesity among female nurses: Korean Nurses’ Survey. BMC Public Health 2013;13(1):1204. 24354395.ArticlePubMedPMCPDF
- 10. Keele R. To role model or not? Nurses’ challenges in promoting a healthy lifestyle. Workplace Health Saf 2019;67(12):584–591. 30827201.ArticlePubMedPDF
- 11. Fajfrová J, Pavlík V, Psutka J, Husarová M, Krutišová P, Fajfr M. Prevalence of overweight and obesity in professional soldiers of the Czech Army over an 11-year period. Vojnosanit Pregl 2016;73(5):422–428. 27430105.PubMed
- 12. Li CN. The relationship between body mass index and metabolic syndrome in the group of voluntary military service [dissertation]. Changhua County, Taiwan: MingDao University; 2017.
- 13. Chang CY. The study of nutrition knowledge, dietary behavior and body weight of military servicemen in Taiwan [dissertation]. Kaohsiung, Taiwan: I-Shou University; 2017.
- 14. Shiozawa B, Madsen C, Banaag A, Patel A, Koehlmoos T. Body mass index effect on health service utilization among active duty male United States army soldiers. Mil Med 2019;184(9-10):447–453. 30811530.ArticlePubMedPDF
- 15. Lee JH, Seo DH, Nam MJ, Lee GH, Yang DH, Lee MJ, et al. The prevalence of obesity and metabolic syndrome in the Korean military compared with the general population. J Korean Med Sci 2018;33(25):e172. 29915523.ArticlePubMedPMCPDF
- 16. Hou YH, Chang RE, Kao SY, Yaung CL. A survey of employee satisfaction and opinions toward deregulated operating models of military hospitals. J Med Health Technol 2004;6(3):187–205.
- 17. Pasquier P, Luft A, Gillard J, Boutonnet M, Vallet C, Pontier JM, et al. How do we fight COVID-19? Military medical actions in the war against the COVID-19 pandemic in France. BMJ Mil Health 2021;167(4):269–274.ArticlePubMed
- 18. Lee JM. Investigation of the armed forces hospitals-use a medical center as an example [dissertation]. Taoyuan City, Taiwan: Yuan Ze University; 2004.
- 19. Reeves SL, Newling-Ward E, Gissane C. The effect of shift-work on food intake and eating habits. Nutr Food Sci 2004;34(5):216–221.Article
- 20. Charan J, Biswas T. How to calculate sample size for different study designs in medical research? Indian J Psychol Med 2013;35(2):121–126. 24049221.ArticlePubMedPMCPDF
- 21. Ministry of Health and Welfare, Taiwan, Health Promotion Administration (HPA). Taiwan’s Obesity Prevention and Management Strategy. Taipei, Taiwan: HPA; 2018.
- 22. Cooper CB, Neufeld EV, Dolezal BA, Martin JL. Sleep deprivation and obesity in adults: a brief narrative review. BMJ Open Sport Exerc Med 2018;4(1):e000392.ArticlePubMedPMC
- 23. Souza RV, Sarmento RA, de Almeida JC, Canuto R. The effect of shift work on eating habits: a systematic review. Scand J Work Environ Health 2019;45(1):7–21. 30088659.ArticlePubMed
- 24. Atalayer D, Gibson C, Konopacka A, Geliebter A. Ghrelin and eating disorders. Prog Neuropsychopharmacol Biol Psychiatry 2013;40:70–82. 22960103.ArticlePubMedPMC
- 25. Zhou Q, Zhang M, Hu D. Dose-response association between sleep duration and obesity risk: a systematic review and meta-analysis of prospective cohort studies. Sleep Breath 2019;23(4):1035–1045. 30941582.ArticlePubMedPDF
- 26. de Rijk MG, de Vries JH, Mars M, Feskens EJ, Boesveldt S. Dietary taste patterns and diet quality of female nurses around the night shift. Eur J Nutr 2024;63(2):513–524. 38057604.ArticlePubMedPMCPDF
- 27. Li TM, Pien LC, Cheng WJ. Direction and magnitude of social jetlag are associated with obesity: results from a sample of hospital employees. Chronobiol Int 2022;39(9):1242–1248. 35796193.ArticlePubMed
- 28. Hung AY, Chien LC, Lin RT. Association between shift rotation and 30-year Framingham risk of cardiovascular disease among male workers in a medium-sized manufacturing factory. Ind Health 2023;61(1):14–23. 35249896.ArticlePubMedPMC
- 29. Skaal L, Pengpid S. Obesity and health problems among South African healthcare workers: do healthcare workers take care of themselves? S Afr Fam Pract 2011;53(6):563–567.Article
- 30. Zhang J, Xu L, Li J, Sun L, Qin W, Ding G, et al. Gender differences in the association between body mass index and health-related quality of life among adults: a cross-sectional study in Shandong, China. BMC Public Health 2019;19(1):1021. 31366336.ArticlePubMedPMCPDF
- 31. Guo X, Gong S, Chen Y, Hou X, Sun T, Wen J, et al. Lifestyle behaviors and stress are risk factors for overweight and obesity in healthcare workers: a cross-sectional survey. BMC Public Health 2023;23(1):1791. 37710220.ArticlePubMedPMCPDF
- 32. Legg M, Stahlman S, Chauhan A, Patel D, Hu Z, Wells N. Obesity prevalence among active component service members prior to and during the COVID-19 pandemic, January 2018-July 2021. MSMR 2022;29(3):8–16.
- 33. Coulthard H, Sharps M, Cunliffe L, van den Tol A. Eating in the lockdown during the Covid 19 pandemic; self-reported changes in eating behaviour, and associations with BMI, eating style, coping and health anxiety. Appetite 2021;161:105082. 33476651.ArticlePubMedPMC
- 34. Virtanen M, Jokela M, Lallukka T, Magnusson Hanson L, Pentti J, Nyberg ST, et al. Long working hours and change in body weight: analysis of individual-participant data from 19 cohort studies. Int J Obes 2020;44(6):1368–1375.ArticlePubMedPMCPDF
- 35. Rothman KJ. BMI-related errors in the measurement of obesity. Int J Obes 2008;32(Suppl 3):S56–S59.ArticlePDF
- 36. Choi BC, Pak AW. A catalog of biases in questionnaires. Prev Chronic Dis 2005;2(1):A13.
- 37. Zou J, Talluri R, Shete S. Approaches to estimate bidirectional causal effects using Mendelian randomization with application to body mass index and fasting glucose. PLoS One 2024;19(3):e0293510. 38457457.ArticlePubMedPMC
REFERENCES
REFERENCES
Figure & Data
REFERENCES
Citations
Citations to this article as recorded by 
- Association of whole-body and regional body fat mass indexes with depressive symptoms and suicidal behaviors in Korean adults: The moderating role of age
Seong-Uk Baek, Jin-Ha Yoon
Journal of Affective Disorders.2025; 385: 119362. CrossRef - Relationships Between Work, Lifestyles, and Obesity: Comparative Analysis Between the Spanish National Health Survey 2017 and the European Health Survey 2020 in Spain
Guillermo Moreno, Marta M. Hernández-Martín, Alfonso Meneses-Monroy, Antonio Moreno-Pimentel, L. Iván Mayor-Silva, Domingo de-Pedro-Jiménez
Journal of Occupational & Environmental Medicine.2025; 67(9): e662. CrossRef - Bidirectional genetic associations between chronotype and shift work: A Mendelian randomization study
Youjin Kim, Jongin Lee, Jeehee Min, Min Young Park, Seung-Yeon Lee, Seunghyun Lee, Wanhyung Lee
Chronobiology International.2025; 42(12): 1736. CrossRef
 Cite
CiteRotating shift and BMI increase among healthcare workers in a military hospital: pre- and post-pandemic analysis in Taiwan

Fig. 1 Study flow and number of subjects in each stage.
Fig. 1
Rotating shift and BMI increase among healthcare workers in a military hospital: pre- and post-pandemic analysis in Taiwan
| Characteristics | Job titles |
| |||||
|---|---|---|---|---|---|---|---|
| Total | Nurses | Technicians | Administrators | Physicians | |||
| 483 (100.0) | 176 (36.4) | 107 (22.2) | 149 (30.8) | 51 (10.6) | |||
| BMI (kg/m2) | < 0.001*** | ||||||
| Mean ± SD | 24.1 ± 3.9 | 23.6 ± 3.9 | 23.9 ± 3.9 | 24.2 ± 3.9 | 26.0 ± 3.4 | ||
| Median [IQR] | 23.4 [5.0] | 22.8 [4.8] | 22.9 [4.4] | 23.7 [4.9] | 25.7 [4.1] | ||
| Obesity (BMI ≥ 27) | 100 (20.7) | 33 (18.8) | 21 (19.6) | 30 (20.1) | 16 (31.4) | 0.275 | |
| Mean age (years) | 43.3 ± 9.5 | 40.1 ± 9.0 | 44.2 ± 9.2 | 46.9 ± 10.1 | 42.5 ± 5.5 | < 0.001*** | |
| Mean job tenure (years) | 13.6 ± 9.4 | 11.2 ± 8.3 | 14.9 ± 9.4 | 16.5 ± 10.8 | 10.8 ± 4.9 | < 0.001*** | |
| Sex | < 0.001*** | ||||||
| Men | 127 (26.3) | 10 (5.7) | 27 (25.2) | 40 (26.8) | 50 (98.0) | ||
| Women | 356 (73.7) | 166 (94.3) | 80 (74.8) | 109 (73.2) | 1 (2.0) | ||
| Military status | < 0.001*** | ||||||
| Soldiers | 111 (23.0) | 23 (13.1) | 9 (8.4) | 32 (21.5) | 47 (92.2) | ||
| Non-soldiers | 372 (77.0) | 153 (86.9) | 98 (91.6) | 117 (78.5) | 4 (7.8) | ||
| Work shift | < 0.001*** | ||||||
| Day work | 223 (46.2) | 46 (26.1) | 49 (45.8) | 121 (81.2) | 7 (13.7) | ||
| Rotating shift | 260 (53.8) | 130 (73.9) | 58 (54.2) | 28 (18.8) | 44 (86.3) | ||
| Mean weekly working hours, past one month | < 0.001*** | ||||||
| ≤ 40 hours | 460 (95.2) | 159 (90.3) | 106 (99.1) | 147 (98.7) | 48 (94.1) | ||
| > 40 hours | 23 (4.8) | 17 (9.7) | 1 (0.9) | 2 (1.3) | 3 (5.9) | ||
| Mean weekly exercising hours, past one month | 0.285 | ||||||
| < 2 hours | 395 (81.8) | 148 (84.1) | 81 (75.7) | 122 (81.9) | 44 (86.3) | ||
| ≥ 2 hours | 88 (18.2) | 28 (15.9) | 26 (24.3) | 27 (18.1) | 7 (13.7) | ||
| Cigarette smoking habits | 18 (3.7) | 2 (1.1) | 5 (4.7) | 11 (7.4) | 0 (0.0) | 0.010** | |
| Alcohol drinking habits | 122 (25.3) | 42 (23.9) | 31 (29.0) | 40 (26.8) | 9 (17.6) | 0.443 | |
| Determinants | Total | Obese individuals | Non-obese individuals | ||||
|---|---|---|---|---|---|---|---|
| RR (95% CI) | RR (95% CI) | RR (95% CI) | |||||
| Year | |||||||
| 2019 | 1.000 | - | 1.000 | - | 1.000 | - | |
| 2020 | 1.004 (1.000–1.009) | 0.059 | 1.002 (0.993–1.011) | 0.623 | 1.003 (0.999–1.007) | 0.158 | |
| 2021 | 1.008 (1.001–1.014) | 0.017* | 1.007 (0.996–1.019) | 0.208 | 1.003 (0.998–1.009) | 0.265 | |
| Age | 1.002 (1.000–1.004) | 0.096 | 0.998 (0.995–1.000) | 0.068 | 1.003 (1.001–1.005) | < 0.001*** | |
| Job tenure | 1.000 (0.997–1.002) | 0.648 | 1.002 (1.000–1.005) | 0.054 | 0.999 (0.997–1.001) | 0.212 | |
| Sex | |||||||
| Women | 1.000 | - | 1.000 | - | 1.000 | - | |
| Men | 1.077 (1.034–1.121) | < 0.001*** | 0.990 (0.954–1.028) | 0.601 | 1.062 (1.032–1.094) | < 0.001*** | |
| Job title | |||||||
| Nurses | 1.000 | - | 1.000 | - | 1.000 | - | |
| Technicians | 1.002 (0.965–1.039) | 0.934 | 1.011 (0.972–1.051) | 0.596 | 1.002 (0.977–1.027) | 0.887 | |
| Administrators | 1.017 (0.979–1.056) | 0.378 | 1.013 (0.973–1.056) | 0.525 | 1.009 (0.982–1.037) | 0.510 | |
| Physicians | 1.031 (0.976–1.090) | 0.271 | 1.022 (0.971–1.074) | 0.409 | 1.006 (0.967–1.047) | 0.754 | |
| Military status | |||||||
| Non-soldiers | 1.000 | - | 1.000 | - | 1.000 | - | |
| Soldiers | 0.994 (0.957–1.032) | 0.751 | 0.951 (0.915–0.988) | 0.010* | 1.026 (0.999–1.055) | 0.064 | |
| Work shift | |||||||
| Day work | 1.000 | - | 1.000 | - | 1.000 | - | |
| Rotating shift | 1.021 (1.008–1.035) | 0.002** | 1.021 (1.003–1.040) | 0.021* | 1.012 (0.999–1.026) | 0.073 | |
| Average weekly working hours, past one month | |||||||
| ≤ 40 hours | 1.000 | - | 1.000 | - | 1.000 | - | |
| > 40 hours | 0.993 (0.980–1.007) | 0.309 | 0.994 (0.974–1.015) | 0.577 | 1.006 (0.994–1.017) | 0.359 | |
| Average weekly exercising hours, past one month | |||||||
| < 2 hours | 1.000 | - | 1.000 | - | 1.000 | - | |
| ≥ 2 hours | 1.009 (0.994–1.024) | 0.259 | 1.013 (0.971–1.056) | 0.553 | 1.004 (0.990–1.017) | 0.590 | |
| Cigarette smoking habits | |||||||
| No | 1.000 | - | 1.000 | - | 1.000 | - | |
| Yes | 1.000 (0.993–1.006) | 0.906 | 0.994 (0.980–1.008) | 0.374 | 1.002 (0.994–1.010) | 0.590 | |
| Alcohol drinking habits | |||||||
| No | 1.000 | - | 1.000 | - | 1.000 | - | |
| Yes | 0.989 (0.953–1.026) | 0.542 | 0.983 (0.955–1.013) | 0.260 | 0.996 (0.962–1.031) | 0.830 | |
| Determinants | OR (95% CI) | ||
|---|---|---|---|
| Year | |||
| 2019 | 1.000 | - | |
| 2020 | 1.085 (0.956–1.231) | 0.207 | |
| 2021 | 1.143 (0.997–1.310) | 0.056 | |
| Age | 0.998 (0.964–1.033) | 0.911 | |
| Job tenure | 0.998 (0.962–1.035) | 0.911 | |
| Sex | |||
| Women | 1.000 | - | |
| Men | 2.004 (1.098–3.658) | 0.024* | |
| Job title | |||
| Nurses | 1.000 | - | |
| Technicians | 0.962 (0.512–1.807) | 0.904 | |
| Administrators | 1.382 (0.761–2.509) | 0.288 | |
| Physicians | 1.552 (0.640–3.760) | 0.331 | |
| Military status | |||
| Non-soldiers | 1.000 | - | |
| Soldiers | 0.716 (0.383–1.341) | 0.297 | |
| Work shift | |||
| Day work | 1.000 | - | |
| Rotating shift | 1.546 (1.099–2.175) | 0.012* | |
| Average weekly working hours, past one month | |||
| ≤ 40 hours | 1.000 | - | |
| > 40 hours | 0.716 (0.427–1.200) | 0.205 | |
| Average weekly exercising hours, past one month | |||
| < 2 hours | 1.000 | - | |
| ≥ 2 hours | 1.082 (0.709–1.650) | 0.715 | |
| Cigarette smoking habits | |||
| No | 1.000 | - | |
| Yes | 0.950 (0.782–1.154) | 0.605 | |
| Alcohol drinking habits | |||
| No | 1.000 | - | |
| Yes | 0.888 (0.346–2.279) | 0.804 | |
Table 1 Baseline characteristics in 2019, by job titles
Values are presented as mean ± standard deviation, median [interquartile range], or number (%).
BMI: body mass index; SD: standard deviation; IQR: interquartile range.
a Kruskal-Wallis test was performed to compare the group differences for continuous variables and Fisher’s exact test was performed to compare the group differences for binary variables.
*
Table 2 Association between risk factors and BMI increase among total participants and by obesity status
The multivariate analysis was performed using generalized estimating equations, accounting for year, age, job tenure, sex, job title, military status, work shift, average weekly working hours, average weekly exercise hours, cigarette smoking habits, and alcohol consumption.
BMI: body mass index; RR: risk ratio; CI: confidence interval.
*
Table 3 Association between risk factors and obesity among total participants
The multivariate analysis was performed using generalized estimating equations, accounting for year, age, job tenure, sex, job title, military status, work shift, average weekly working hours, average weekly exercise hours, cigarette smoking habits, and alcohol consumption.
OR: odds ratio; CI: confidence interval.
*

