
Articles
- Page Path
- HOME > Ann Occup Environ Med > Volume 36; 2024 > Article
- Original Article Exploring the association between non-regular employment and adverse birth outcomes: an analysis of national data in Japan
-
Tasuku Okui
 , Naoki Nakashima
 -
Annals of Occupational and Environmental Medicine 2024;36:e6.
DOI: https://doi.org/10.35371/aoem.2024.36.e6
Published online: March 18, 2024
Medical Information Center, Kyushu University Hospital, Fukuoka, Japan.
- Correspondence: Tasuku Okui. Medical Information Center, Kyushu University Hospital, 3 Chome-1-1 Maidashi, Higashi Ward, Fukuoka 812-8582, Japan. task10300@gmail.com
• Received: November 30, 2023 • Revised: February 1, 2024 • Accepted: February 26, 2024
Copyright © 2024 Korean Society of Occupational & Environmental Medicine
This is an Open Access article distributed under the terms of the Creative Commons Attribution Non-Commercial License (https://creativecommons.org/licenses/by-nc/4.0/) which permits unrestricted non-commercial use, distribution, and reproduction in any medium, provided the original work is properly cited.
This article has been corrected. See "Erratum: Exploring the association between non-regular employment and adverse birth outcomes: an analysis of national data in Japan" in Volume 36 on page e30.
Abstract
-
Background As few studies have explored the association between non-regular or precarious employment in parents and adverse birth outcomes, this study aimed to investigate this association using national data in Japan.
-
Methods This study utilized the census data from 2020 and birth data from the vital statistics in 2021 and 2022 in the analysis. Adverse birth outcomes, including preterm birth, term low birth weight (TLBW), and small-for-gestational-age, were examined. Data linkage was conducted between birth data and census data to link parental employment statuses and educational attainments with birth data. Rates of adverse birth outcomes were calculated for each parental employment status. Additionally, regression analysis was used to determine adjusted risk ratios (RRs) of parental employment statuses for each birth outcome.
-
Results After data linkage, 334,110 birth records were included in the statistical analysis. Rates for non-regular workers were consistently higher than those for regular workers across all adverse birth outcomes for maternal employment status. Results of regression analyses indicated that the risks of preterm birth for non-regular workers were statistically significantly higher than those for regular workers, both in mothers and fathers with a RR (95% confidence intervals [CIs]) of 1.053 (1.004–1.104) and 1.142 (1.032–1.264), respectively. Furthermore, the risk of TLBW birth for non-regular workers was statistically significantly higher than that for regular workers in fathers (RR [95% CI]: 1.092 [1.043–1.143]).
-
Conclusions Our findings demonstrate that non-regular workers have a higher risk of some adverse birth outcomes compared to regular workers.
BACKGROUND
A non-regular worker, often referred to as a precarious worker, is an employee with an unstable employment status, typically encompassing part-time workers and contractors. The number of non-regular workers in Japan has exhibited a growing trend over the decades, constituting 36.9% of the workforce in 2022.1 Notably, some health inequalities between regular and non-regular workers have been observed,2,3 extending to overall mortality and suicide risk.4,5 In Japan, non-regular workers are more prone to psychological distress and poorer mental health compared to their regular counterparts.6,7 Moreover, they tend to receive less support from health professionals in the workplace compared to regular workers.8
Furthermore, non-regular employment is associated with adverse health outcomes in mothers. Previous studies have demonstrated that precarious or part-time working conditions in mothers constitute a risk factor for postpartum depression.9,10 In contrast, studies investigating an association between non-regular or precarious employment in parents and adverse birth outcomes, such as low birth weight and preterm birth are limited. One study in the U.S. showed that mothers with precarious employment had a higher risk of low birth weight.11 In Japan, a study investigated non-regular employment in mothers with small-for-gestational age (SGA) and preterm birth,12 finding no observed association. However, this study utilized data from 2001, making it meaningful to explore this association using more recent data. Moreover, no study has investigated the association between non-regular employment in fathers and adverse birth outcomes. In Japan, certain socioeconomic factors, including household income and parental educational levels, influence SGA and preterm birth.12,13,14 Therefore, there is a possibility that non-regular employment in parents may also affect adverse birth outcomes.
In this study, we investigated the association between parental employment statuses and adverse birth outcomes using national data in Japan. Specifically, we focused on preterm birth, term low birth weight (TLBW), and SGA as adverse birth outcomes because these are representative outcomes that are often used to investigate the effect of a factor.15,16,17 In addition, infants born with these outcomes are more predisposed to infant mortality and noncommunicable diseases in their childhood and adulthood,18,19,20 and it is meaningful to investigate the associations.
METHODS
This study analyzed census data from 2020 and birth data from vital statistics in 2021 and 2022. These datasets were provided from the Ministry of Internal Affairs and Communications and the Ministry of Health, Labour, and Welfare, in accordance with article 33 of the Statistics Act in Japan. To assess parental employment statuses before childbirth in the analysis, we employed birth data from 2021 and 2022. Census data included information on prefecture, municipality, survey area number (household number in the area), age, birth month, sex, marital status, family relationship with the head of a household, educational attainment, working status, employment status, and nationality for each individual. Employment status was categorized as regular workers (regular employees or board members), non-regular workers (part-time workers, temporary workers, contractors, or dispatched workers), self-employed workers (self-employed workers or family workers), and unemployed individuals. Educational attainment was classified as “less than high school,” “high school,” “technical school or junior college,” “university or more,” and “currently enrolled in school.” Birth year was calculated from age and birth month for each individual. Due to larger number of nationality categories in the census data compared with the birth data, we regrouped them into categories consistent with those used in birth data.
Furthermore, information on prefecture, municipality, infant’s sex, infant’s birthday, number of fetuses, gestational age (weeks and days), birthweight, wedlock status, maternal age, parity (maternal past experience of stillbirths and live births), parental nationalities, and parental birthdays were used for each birth data in the vital statistics. Maternal past experiences of stillbirths and live births were grouped into yes or no. Birth month of a parent was grouped into seasons (3 months) because only that information was available in the census data.
We used preterm birth, TLBW, and SGA as adverse birth outcomes. Preterm birth was defined as birth that occurs at a gestational age of less than 37 weeks, while those that occurred at a gestational age of 37 weeks or more were defined as non-preterm births. TLBW was defined as birth with a birth weight of less than 2,500 g among births at a gestational age of at least 37 weeks.21 Therefore, births with birth weights of 2,500 g or more that occur at a gestational age of 37 weeks or more were defined as non-TLBW births. SGA was defined as births with a birth weight below the 10th percentile of the newborn’s anthropometric chart in Japan for each combination of infant’s sex, gestational age, and parity.22 Because the anthropometric chart in Japan covers 22–41 completed weeks of gestation, our analysis of SGA births focused solely on births within this gestational age range. Therefore, the SGA birth rate was defined as the number of SGA births per number of births with 22–41 completed weeks of gestation.
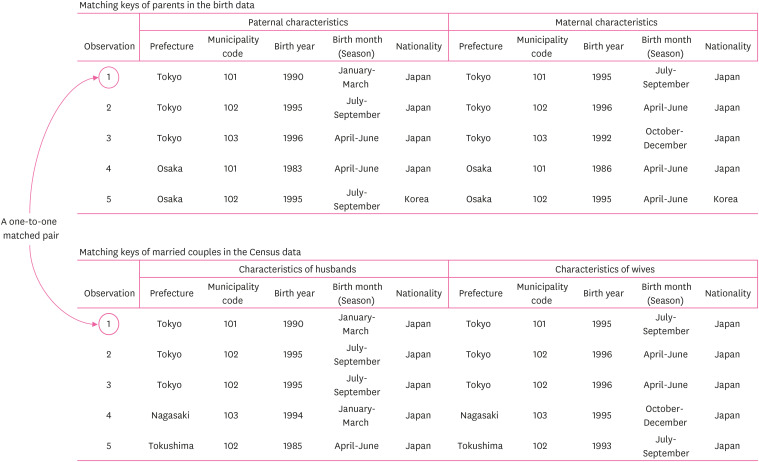
Data linkage was conducted between birth data and the census data to link parental employment statuses and educational attainments with birth data. Since paternal characteristics were included in the analysis, only birth data within a marriage were used. In Japan, common IDs or social security numbers are not available for the census and the birth data. Therefore, a combination of common information of both data (prefecture, municipality, birth year, birth month, and nationality) was used as matching keys to match the two datasets. The deterministic data linkage was conducted for fathers in birth data and men in the census, as well as between mothers and women.
During the data linkage, some restrictions were applied because there were a large number of potential candidates for parents in many cases. Specifically, we used only husbands and wives who were in a marital relationship and were living in a same household for candidates of parents. Whether or not a pair of men and women were in a marital relationship was judged from the family relationship with the head of a household. A pair of the head of a household and his or her spouse who were married or a pair of a child of the head of a household and his or her spouse who were married was used as a pair in a marital relationship. Only fathers and mothers forming one-to-one matched pairs with the census data were included in the analysis. “One-to-one matched” means that the combination of the matching keys for father (husband) and mother (wife) is unique in both the census and birth data and that the combination of matching keys is the same between the census and birth data. Fig. 1 shows a schematic figure of the census and the birth data used in the data linkage. For ease of explanation, we consider a situation where only five observations exist for both census data and birth data. Observation number 1 in the census and birth data have the same matching keys. In addition, the combinations of matching keys of observation number 1 are unique both among the census and birth data. In this case, observation number 1 in the census and birth data become a one-to-one matched pair in the data linkage. Observation number 2 in the birth data has the same matching keys as observation number 2 and observation number 3 in the census data. In this case, the combination of matching keys is not unique in the census data, and observation number 2 in the birth data is not matched with the census data.
We tallied the number of births based on parental employment statuses. Additionally, preterm birth rate, TLBW rate, and SGA rate were calculated for each parental employment status. We used a log-binomial regression model to calculate risk ratios (RRs) of parental employment statuses for each birth outcome. Log-binomial regression is a regression analysis method used for binary outcomes, and RRs of explanatory variables can be calculated.23 The glm function in R was used for fitting the log-binomial model, and binomial distribution and the log link function were used as the distribution of an outcome and the link function in the glm. As explanatory variables, infant’s sex, maternal nationality, past experience of live births, past experience of stillbirths, maternal age group, parental educational attainments, and parental employment statuses were included. Adjusted RRs, along with 95% confidence intervals (CIs) and p-values, were calculated for each employment status, using regular workers as the reference. A two-sided test was conducted, and a p-value less than 0.05 was considered statistically significant.
In the data linkage, probability of being one-to-one matched with the census data differ depending birth characteristics. For example, birth data of a prefecture with larger population tend not to be one-to-one matched with the census data. As a result, distribution of birth characteristics of the matched data that were slightly different from those of the original birth data. In order to adjust for the difference from the original birth data, we estimated the probability of being one-to-one matched with the census data for each birth data. The inverse of the probability was used as a weight for each matched birth data in the calculation of adverse birth outcome rates and regression analysis. The mechanism is same as that of the inverse probability weighting method,24 which is commonly employed in epidemiological studies to address selection bias. A larger weight is assigned to a birth with a lower probability of being one-to-one matched, and vice versa. Consequently, the distribution of characteristics in the weighted matched birth data become more similar to those of the original birth data compared with the unweighted dataset. The probability of being one-to-one matched with the census data was computed through logistic regression using all births that were used for data linkage. Parental nationalities, parental age groups, and prefecture were used as explanatory variables because those kinds of information was used in data linkage. In the calculation of the rate of each adverse birth outcome, the rate was calculated using the sum of the product of the weight and the binary status of an adverse birth outcome for each birth data as the numerator and the sum of the weight as the denominator. In addition, the weight values were scaled to ensure that the mean of the weights equaled one, preventing underestimation of the standard error of regression coefficients.25
We used singleton birth data in the statistical analysis. Moreover, a complete-case analysis was conducted to handle missing data, and multiple imputation was employed as a sensitivity analysis. All statistical analyses were conducted using R4.1.3,26 with the lmtest and mice packages utilized.27,28 Notably, the statistics presented in this study were generated by the authors using data provided by the Ministries in Japan and are not statistics published by the Ministries.
This study was approved by the Kyushu University Institutional Review Board for Clinical Research (No. 22221-03). Informed consent was not required for this study because we used the official statistics data that were provided from the Japanese government on the basis of the Statistics Act.
RESULTS
Fig. 2 shows the flowchart of the data selection process. After data linkage, 334,110 births, which were 21.2% of the original birth data with information of both parents, were used in the analysis.
Fig. 2

The flowchart of selection of the study population. One-to-one matched births are births whose matching keys were unique and were exactly matched with married couples in the census data. One-to-one matched men and women are couples whose matching keys were unique and were exactly matched with those of parents in the birth data. The 334,196 × 2 = 668,392 parents in the birth data were matched with 668,392 men and women (334,196 couples) in the census data.
Table 1 shows the number (%) of live births categorized by each birth characteristic for maternal employment statuses. The largest number of births came from regular workers among maternal employment statuses. Parental educational attainments tended to be lower in non-regular workers compared to regular workers. Specifically, the proportions of university graduates for regular and non-regular workers were 42.4% and 21.5%, respectively. Similarly, the proportions of university graduates among fathers for regular workers and non-regular workers were 46.7% and 34.3%, respectively.
Table 1
The number (%) of live births by each birth characteristics for maternal employment statuses
Table 2 shows the number (%) of live births categorized by each birth characteristic for paternal employment statuses. Most births were from regular workers among paternal employment statuses. Parental educational attainments tended to be lower in non-regular workers compared with regular workers. Specifically, the proportions of university graduates among mothers for regular workers and non-regular workers were 32.9% and 30.0%, respectively. In addition, the proportions of university graduates for regular and non-regular workers were 43.7% and 29.9%, respectively.
Table 2
The number (%) of live births by each birth characteristics for paternal employment statuses
Supplementary Table 1 shows the number (%) of live births categorized by characteristics for the matched (unweighted and weighted) and the original birth data. The total (number of births) for the unweighted data and the total (sum of the weights) for the weighted data became the same because the weight was scaled to ensure that the mean of the weights equaled one. In many cases, the percentage of each category for the weighted matched birth data became more similar to the original birth data compared with the unweighted data. For example, the proportions of non-Japanese mothers and fathers were 6.8% and 6.9%, respectively, in the unweighted data, whereas they were 3.2% and 3.5% in the weighted data, indicating a closer alignment with the original birth data.
Table 3 shows the number and rate (%) of adverse birth outcomes categorized by parental employment statuses. Rates for non-regular workers were consistently higher than those for regular workers across all adverse birth outcomes for maternal employment status. Specifically, the rates of preterm birth, TLBW, and SGA birth for regular workers were 4.5%, 5.1%, and 6.5%, respectively, whereas those for non-regular workers were 5.0%, 5.5%, and 6.8%, respectively. Regarding paternal employment status, the preterm birth rate of non-regular workers (5.6%) was higher than that of regular workers (4.6%), while an opposite trend was observed for TLBW and SGA rates. Specifically, the rates of TLBW and SGA birth for regular workers were 5.1% and 6.5%, respectively, whereas those for non-regular workers were 4.9% and 6.4%, respectively.
Table 3
The number and rate (%) of the adverse birth outcomes by parental employment statuses
Table 4 shows the results of the log-binomial regression analysis, indicating RRs of parental employment statuses on adverse outcomes. Risks of preterm birth for non-regular workers were statistically significantly higher than those of regular workers, both in mothers and fathers, and RRs (95% CI) were 1.053 (1.004–1.104) and 1.142 (1.032–1.264) for mothers and fathers, respectively. Additionally, the risk of TLBW birth for non-regular workers was statistically significantly higher than that for regular workers in fathers, and the RR (95% CI) was 1.092 (1.043–1.143).
Table 4
The result of the log-binomial regression analysis showing RR of parental employment statuses on the adverse outcomes
TLBW: term low birthweight; SGA: small-for-gestational-age; RR: risk ratio; CI: confidence interval.
aInfant's sex, maternal nationality, and maternal age group, past experience of live births, past experience of stillbirths, parental educational attainments, and spouse's employment status were adjusted.
Supplementary Table 2 shows the results of the log-binomial regression analysis, showing RRs of parental employment statuses on adverse outcomes using multiple imputation. A similar result was observed as in the complete-case analysis. Specifically, the RRs of preterm birth for non-regular workers compared with regular workers among mothers and fathers were 1.056 (1.001–1.114) and 1.117 (1.007–1.239), respectively. Additionally, the RR of TLBW for non-regular workers compared with regular workers among mothers was 1.082 (1.024–1.144).
DISCUSSION
This study explored the association between parental employment statuses and adverse birth outcomes. The findings revealed a positive association between non-regular employment among mothers and preterm birth, as well as TLBW when compared with regular workers. Additionally, non-regular employment among fathers was associated with preterm birth. One study in the U.S. showed that mothers with precarious employment had a higher risk of low birth weight,11 which was relatively consistent with the results of this study. In a previous study using data from 2001 in Japan,12 an association between non-regular employment among mothers and SGA and preterm births was not shown. We used birth data in recent years and data with a larger number of births, which might be a reason for the difference in the results. Several factors may contribute to these associations, including differences in income, health statuses, and the utilization of maternity leave based on employment status.
In Japan, non-regular employment has been associated with serious psychological distress,29 and psychological distress or poor mental health during pregnancy is recognized as a risk factor for low birth weight and preterm birth.30,31,32 Additionally, precarious employment is associated with poorer self-rated health and activity limitations due to health problems,33,34 and it is possible that precarious employment also affects the physical health of mothers and fathers. Moreover, average income for regular workers is higher than that for non-regular workers, irrespective of age and gender in Japan.35 Income levels are associated with various risk factors for adverse birth outcomes. For instance, smoking prevalence is higher among individuals with lower income for both men and women in Japan,36 and precarious workers are more likely to smoke than full-time workers.29 Given that maternal smoking is a risk factor for preterm birth and low birth weight,37 these associations may contribute to the observed outcomes. Moreover, secondhand smoke exposure is associated with hypertensive disorders in pregnancy,38,39 and paternal smoking status can also influence adverse birth outcomes.40 Furthermore, maternal physical health (including the body mass index), maternal lifestyle (including alcohol consumption), and working and environmental conditions are suggested to be mediators of lower socioeconomic status and preterm birth,41 and these factors can negatively affect birth outcomes.
Prenatal care utilization is another factor that can affect birth outcomes. Missing a prenatal checkup is a risk factor for low birth weight in Japan42 and the frequency of prenatal care utilization can be influenced by household income levels, as participating in prenatal care is not always free of charge in many municipalities in Japan. Furthermore, the proportion of female non-regular workers taking maternity leave was 62.5% in Japan in 2020, and it was lower than the rate of all workers (81.6%),43 despite of the legal permission for non-regular workers to take maternity leave. Given that maternity leave has been shown to be effective in improving adverse birth outcomes in other countries,44,45,46 differences in the acquisition rate of maternity leave may contribute to the observed variations in birth outcomes.
The study suggested an association between non-regular employment and certain adverse birth outcomes. Conducting surveys to explore variations in health-related behaviors, utilization status of medical care, and physical characteristics based on employment statuses will be crucial for a more comprehensive understanding of these results. Although the reason for the difference cannot be elucidated from this study, the lower proportion of pregnant women taking maternity leave among non-regular workers may need to be corrected. In contrast, it is plausible that non-regular workers may opt to work during pregnancy to enhance their income. Addressing this potential disparity in maternity leave acquisition rates may require offering more adequate wage compensation. Future investigations also need to assess whether differences in maternity allowances exist based on employment statuses.
There are some limitations in this study. Firstly, the results of this study relied on data linkage between different datasets, leading to the exclusion of some birth data from the analysis. A major reason why only a small portion of the original birth data was used in the statistical analysis is that we used only one-to-one matched pairs in the data linkage. Only data whose combination of matching keys of couples was unique among matched pairs were used, and those data were only a small portion of the original data. We dealt with the selection bias caused by data linkage by assigning different weights to each matched birth data. As another limitation, there is a possibility of incorrect matching between birth data and census data, particularly if individuals or parents changed municipalities during the study period. For example, if parents who gave birth moved to another municipality during this period, the birth data might be erroneously matched with different individuals in the census. Additionally, the study lacked information on income data, and it would be meaningful to incorporate this aspect in future studies.
CONCLUSIONS
We investigated the association between parental employment statuses and adverse birth outcomes using national data in Japan. The regression analysis revealed that the risks of preterm birth for non-regular workers were higher than those for regular workers, both in mothers and fathers. Additionally, the risk of TLBW for non-regular workers was higher than that for regular workers in fathers. Our findings indicated that non-regular workers faced a higher risk of certain adverse birth outcomes compared to regular workers, particularly among mothers.
Abbreviations
-
Funding: This study was supported by JSPS KAKENHI grant number JP22K17372.
-
Competing interests: The authors declare that they have no competing interests.
-
Authors contributions:
NOTES
SUPPLEMENTARY MATERIALS
Supplementary Table 1
Number (%) of live births categorized by characteristics for the matched (unweighted and weighted) and the original birth data
Supplementary Table 2
The result of the log-binomial regression analysis showing RR of parental employment statuses on the adverse outcomes using multiple imputation
- 1. Ministry of Health, Labour and Welfare. The labour force survey (detailed aggregation) overview of average results in 2022. Updated 2023]. Accessed November 11, 2023]. https://www.stat.go.jp/data/roudou/sokuhou/nen/dt/pdf/ndtindex.pdf .
- 2. Tompa E, Scott-Marshall H, Dolinschi R, Trevithick S, Bhattacharyya S. Precarious employment experiences and their health consequences: towards a theoretical framework. Work 2007;28(3):209–224. 17429147.ArticlePubMedPDF
- 3. Benach J, Vives A, Amable M, Vanroelen C, Tarafa G, Muntaner C. Precarious employment: understanding an emerging social determinant of health. Annu Rev Public Health 2014;35(1):229–253. 24641559.ArticlePubMed
- 4. Min KB, Park SG, Hwang SH, Min JY. Precarious employment and the risk of suicidal ideation and suicide attempts. Prev Med 2015;71:72–76. 25532676.ArticlePubMed
- 5. Nardi A, Dei Bardi L, Davoli M, Agabiti N, Cesaroni G. Differences in mortality between temporary and permanent workers: results from the Rome Longitudinal Study. BMJ Open 2022;12(5):e058594.ArticlePubMedPMC
- 6. Inoue M, Nishikitani M, Tsurugano S. Female non-regular workers in Japan: their current status and health. Ind Health 2016;54(6):521–527. 27818453.ArticlePubMedPMC
- 7. Shimazaki T, Yamauchi T, Takenaka K, Suka M. The link between involuntary non-regular employment and poor mental health: a cross-sectional study of Japanese workers. Int J Psychol 2024;59(1):1–29. 37712514.ArticlePubMed
- 8. Sakai K, Nagata T, Odagami K, Adi NP, Nagata M, Mori K. Inequality in workplace support for various types of precarious workers compared with permanent workers in Japan: a cross-sectional study. J Occup Health 2023;65(1):e12431. 37833831.ArticlePubMedPMCPDF
- 9. Aochi Y, Honjo K, Kimura T, Ikehara S, Iso H. Japan Environment and Children’s Study Group. Association between maternal employment status during pregnancy and risk of depressive symptomatology 1 month after childbirth: the Japan Environment and Children’s Study. J Epidemiol Community Health 2021;75(6):531–539. 33468603.ArticlePubMed
- 10. Karl M, Schaber R, Kress V, Kopp M, Martini J, Weidner K, et al. Precarious working conditions and psychosocial work stress act as a risk factor for symptoms of postpartum depression during maternity leave: results from a longitudinal cohort study. BMC Public Health 2020;20(1):1505. 33023543.ArticlePubMedPMCPDF
- 11. Patil D, Enquobahrie DA, Peckham T, Seixas N, Hajat A. Retrospective cohort study of the association between maternal employment precarity and infant low birth weight in women in the USA. BMJ Open 2020;10(1):e029584.ArticlePubMedPMC
- 12. Fujiwara T, Ito J, Kawachi I. Income inequality, parental socioeconomic status, and birth outcomes in Japan. Am J Epidemiol 2013;177(10):1042–1052. 23576676.ArticlePubMed
- 13. Hayashi I, Takakura K, Yamaguchi K, Sumitomo M, Suzuki M, Sumitomo A, et al. Association between socioeconomic status and small-for-gestational-age in Japan: a single center retrospective cohort study. J Obstet Gynaecol Res 2020;46(1):110–118. 31392834.ArticlePubMedPDF
- 14. Okui T. Analysis of an association between preterm birth and parental educational level in Japan using national data. Children (Basel) 2023;10(2):342. 36832471.ArticlePubMedPMC
- 15. Melody S, Wills K, Knibbs LD, Ford J, Venn A, Johnston F. Adverse birth outcomes in Victoria, Australia in association with maternal exposure to low levels of ambient air pollution. Environ Res 2020;188:109784. 32574853.ArticlePubMed
- 16. Lee PC, Wu CD, Tsai HJ, Tsai HY, Lin SH, Wu CK, et al. Residential greenness and birth outcomes: evaluating the mediation and interaction effects of particulate air pollution. Ecotoxicol Environ Saf 2021;211:111915. 33461015.ArticlePubMed
- 17. Ruckart PZ, Bove FJ, Maslia M. Evaluation of contaminated drinking water and preterm birth, small for gestational age, and birth weight at Marine Corps Base Camp Lejeune, North Carolina: a cross-sectional study. Environ Health 2014;13(1):99. 25413571.ArticlePubMedPMCPDF
- 18. Ray JG, Park AL, Fell DB. Mortality in infants affected by preterm birth and severe small-for-gestational age birth weight. Pediatrics 2017;140(6):e20171881. 29117948.ArticlePubMedPDF
- 19. Bianchi ME, Restrepo JM. Low birthweight as a risk factor for non-communicable diseases in adults. Front Med (Lausanne) 2022;8:793990. 35071274.ArticlePubMedPMC
- 20. Luu TM, Katz SL, Leeson P, Thébaud B, Nuyt AM. Preterm birth: risk factor for early-onset chronic diseases. CMAJ 2016;188(10):736–746. 26644500.ArticlePubMedPMC
- 21. Westergaard N, Gehring U, Slama R, Pedersen M. Ambient air pollution and low birth weight - are some women more vulnerable than others? Environ Int 2017;104:146–154. 28390661.ArticlePubMed
- 22. Neonatal Committee of the Japan Pediatric Society. About revision of the new neonatal anthropometric chart by gestational age. J Japan Pediatr Soc 2010;114(11):1771–1806.
- 23. McNutt LA, Wu C, Xue X, Hafner JP. Estimating the relative risk in cohort studies and clinical trials of common outcomes. Am J Epidemiol 2003;157(10):940–943. 12746247.ArticlePubMed
- 24. Seaman SR, White IR. Review of inverse probability weighting for dealing with missing data. Stat Methods Med Res 2013;22(3):278–295. 21220355.ArticlePubMedPDF
- 25. Tanaka H, Mackenbach JP, Kobayashi Y. Estimation of socioeconomic inequalities in mortality in Japan using national census-linked longitudinal mortality data. J Epidemiol 2023;33(5):246–255. 34629363.ArticlePubMedPMC
- 26. R Core Team. R: a language and environment for statistical computing. Updated 2023]. Accessed November 11, 2023]. https://www.R-project.org/ .
- 27. Zeileis A, Hothorn T. Diagnostic checking in regression relationships. R News 2002;2(3):7–10.
- 28. van Buuren S, Groothuis-Oudshoorn K. Mice: multivariate imputation by chained equations in R. J Stat Softw 2011;45(3):1–67.
- 29. Tsurugano S, Inoue M, Yano E. Precarious employment and health: analysis of the comprehensive national survey in Japan. Ind Health 2012;50(3):223–235. 22453210.ArticlePubMed
- 30. Voit FAC, Kajantie E, Lemola S, Räikkönen K, Wolke D, Schnitzlein DD. Maternal mental health and adverse birth outcomes. PLoS One 2022;17(8):e0272210. 36044423.ArticlePubMedPMC
- 31. Daalderop LA, Lagendijk J, Steegers EAP, El Marroun H, Posthumus AG. Psychological distress during pregnancy and adverse maternal and perinatal health outcomes: the role of socioeconomic status. Int J Gynaecol Obstet 2023;163(3):920–930. 37259252.ArticlePubMed
- 32. Loomans EM, van Dijk AE, Vrijkotte TG, van Eijsden M, Stronks K, Gemke RJ, et al. Psychosocial stress during pregnancy is related to adverse birth outcomes: results from a large multi-ethnic community-based birth cohort. Eur J Public Health 2013;23(3):485–491. 22850187.ArticlePubMed
- 33. Pulford A, Thapa A, Thomson RM, Guilding A, Green MJ, Leyland A, et al. Does persistent precarious employment affect health outcomes among working age adults? A systematic review and meta-analysis. J Epidemiol Community Health 2022;76(11):909–917. 36137738.ArticlePubMedPMC
- 34. Bhattacharya A, Ray T. Precarious work, job stress, and health-related quality of life. Am J Ind Med 2021;64(4):310–319. 33543533.ArticlePubMedPMCPDF
- 35. Ministry of Health, Labour and Welfare. Overview of the basic survey on wage structure in 2022. Updated 2019]. Accessed November 11, 2023]. https://www.mhlw.go.jp/toukei/itiran/roudou/chingin/kouzou/z2022/dl/13.pdf .
- 36. Fukuda Y, Nakamura K, Takano T. Socioeconomic pattern of smoking in Japan: income inequality and gender and age differences. Ann Epidemiol 2005;15(5):365–372. 15840550.ArticlePubMed
- 37. Ko TJ, Tsai LY, Chu LC, Yeh SJ, Leung C, Chen CY, et al. Parental smoking during pregnancy and its association with low birth weight, small for gestational age, and preterm birth offspring: a birth cohort study. Pediatr Neonatol 2014;55(1):20–27. 23850094.ArticlePubMed
- 38. Prince PM, Umman M, Fathima FN, Johnson AR. Secondhand smoke exposure during pregnancy and its effect on birth outcomes: evidence from a retrospective cohort study in a tertiary care hospital in Bengaluru. Indian J Community Med 2021;46(1):102–106. 34035587.ArticlePubMedPMC
- 39. Tanaka K, Nishigori H, Watanabe Z, Tanoue K, Iwama N, Satoh M, et al. Secondhand smoke exposure is associated with the risk of hypertensive disorders of pregnancy: the Japan Environment and Children’s Study. Hypertens Res 2023;46(4):834–844. 36732667.ArticlePubMedPMCPDF
- 40. Wang L, Deng Y, Yang Y, Liu F, Xu Q, Peng Z, et al. Paternal smoking and preterm birth: a population-based retrospective cohort study among non-smoking women aged 20–49 years in rural China. Reprod Health 2022;19(1):72. 35331280.ArticlePubMedPMCPDF
- 41. McHale P, Maudsley G, Pennington A, Schlüter DK, Barr B, Paranjothy S, et al. Mediators of socioeconomic inequalities in preterm birth: a systematic review. BMC Public Health 2022;22(1):1134. 35668387.ArticlePubMedPMCPDF
- 42. Nagamine M, Matsumura K, Tsuchida A, Inadera H. Japan Environment and Children’s Study (JECS) Group. Relationship between prenatal checkup status and low birth weight: a nationwide birth cohort-the Japan Environment and Children’s Study. Ann Epidemiol 2023;83:8–14. 37094623.ArticlePubMed
- 43. Ministry of Health, Labour and Welfare. Overview of results of the basic survey of gender equality in employment management. Updated 2019]. Accessed November 11, 2023]. https://www.mhlw.go.jp/toukei/list/dl/71-r02/07.pdf .
- 44. Kwegyir-Afful E, Adu G, Spelten ER, Räsänen K, Verbeek J. Maternity leave duration and adverse pregnancy outcomes: an international country-level comparison. Scand J Public Health 2018;46(8):798–804. 29212432.ArticlePubMedPDF
- 45. Rossin M. The effects of maternity leave on children’s birth and infant health outcomes in the United States. J Health Econ 2011;30(2):221–239. 21300415.ArticlePubMedPMC
- 46. Stearns J. The effects of paid maternity leave: evidence from temporary disability insurance. J Health Econ 2015;43:85–102. 26218984.ArticlePubMed
REFERENCES
REFERENCES
Figure & Data
REFERENCES
Citations
Citations to this article as recorded by 
- Perinatal challenges for mothers of Haitian origin and their newborns in French Guiana: a historical cohort from 2013 to 2021
Juliette Laumonnier, Leslie Alcouffe, Françoise Vendittelli, Sabrina Covis, Stéphanie Bernard, Mathieu Nacher, Narcisse Elenga, Lindsay Osei
BMJ Open.2026; 16(1): e098713. CrossRef - Assisted reproductive technology in Japan: A summary report for 2022 by the Ethics Committee of the Japan Society of Obstetrics and Gynecology
Yukiko Katagiri, Seung Chik Jwa, Akira Kuwahara, Takeshi Iwasa, Masanori Ono, Keiichi Kato, Hiroshi Kishi, Yoshimitsu Kuwabara, Fuminori Taniguchi, Miyuki Harada, Akira Iwase, Norihiro Sugino
Reproductive Medicine and Biology.2024;[Epub] CrossRef
 Cite
CiteExploring the association between non-regular employment and adverse birth outcomes: an analysis of national data in Japan

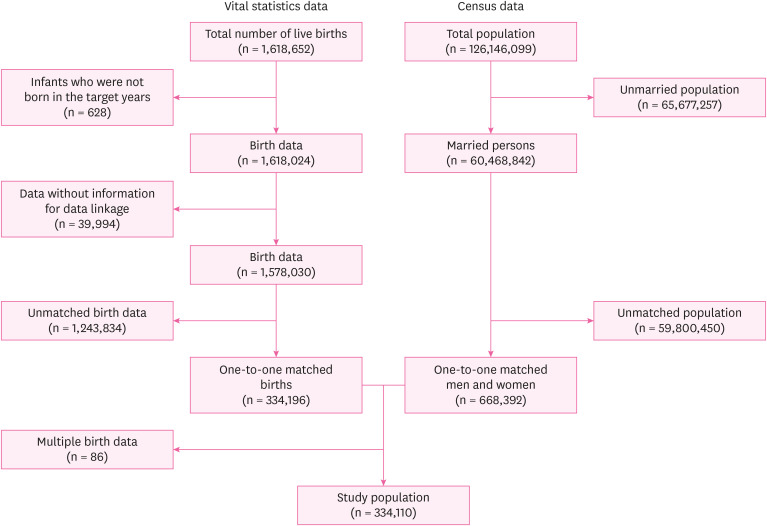
Fig. 1 Schematic figure of the census and the birth data used in data linkage.
Fig. 2 The flowchart of selection of the study population. One-to-one matched births are births whose matching keys were unique and were exactly matched with married couples in the census data. One-to-one matched men and women are couples whose matching keys were unique and were exactly matched with those of parents in the birth data. The 334,196 × 2 = 668,392 parents in the birth data were matched with 668,392 men and women (334,196 couples) in the census data.
Fig. 1
Fig. 2
Exploring the association between non-regular employment and adverse birth outcomes: an analysis of national data in Japan
| Birth characteristics | Maternal employment status | ||||
|---|---|---|---|---|---|
| Regular worker | Non-regular worker | Self-employed worker | Non-employed person | ||
| Total | 125,119 (100.0) | 66,478 (100.0) | 10,359 (100.0) | 86,169 (100.0) | |
| Infant's sex | |||||
| Female | 61,073 (48.8) | 32,358 (48.7) | 5,114 (49.4) | 42,058 (48.8) | |
| Male | 64,046 (51.2) | 34,120 (51.3) | 5,245 (50.6) | 44,111 (51.2) | |
| Maternal age group | |||||
| Under 20 years | 20 (0.0) | 61 (0.1) | 6 (0.1) | 254 (0.3) | |
| 20–24 years | 5,896 (4.7) | 4,219 (6.3) | 359 (3.5) | 8,252 (9.6) | |
| 25–29 years | 36,239 (29.0) | 17,917 (27.0) | 1,991 (19.2) | 23,586 (27.4) | |
| 30–34 years | 46,511 (37.2) | 23,522 (35.4) | 3,567 (34.4) | 29,224 (33.9) | |
| 35–39 years | 28,531 (22.8) | 16,226 (24.4) | 3,334 (32.2) | 19,392 (22.5) | |
| 40 years or more | 7,922 (6.3) | 4,533 (6.8) | 1,102 (10.6) | 5,461 (6.3) | |
| Maternal nationality | |||||
| Japanese | 120,537 (96.3) | 61,263 (92.2) | 9,792 (94.5) | 80,141 (93.0) | |
| Non-Japanese | 4,582 (3.7) | 5,215 (7.8) | 567 (5.5) | 6,028 (7.0) | |
| Past experience of live births | |||||
| No | 59,510 (47.6) | 26,399 (39.7) | 3,147 (30.4) | 23,362 (27.1) | |
| Yes | 65,609 (52.4) | 40,079 (60.3) | 7,212 (69.6) | 62,807 (72.9) | |
| Past experience of stillbirths | |||||
| No | 124,606 (99.6) | 66,097 (99.4) | 10,282 (99.3) | 85,682 (99.4) | |
| Yes | 513 (0.4) | 381 (0.6) | 77 (0.7) | 487 (0.6) | |
| Maternal educational attainment | |||||
| Less than high school | 1,640 (1.3) | 4,265 (6.4) | 683 (6.6) | 6,034 (7.0) | |
| High school | 31,981 (25.6) | 27,216 (40.9) | 3,834 (37.0) | 32,710 (38.0) | |
| Technical school or junior college | 36,541 (29.2) | 18,955 (28.5) | 2,831 (27.3) | 22,972 (26.7) | |
| University or more | 52,996 (42.4) | 14,264 (21.5) | 2,722 (26.3) | 22,254 (25.8) | |
| Currently enrolled in school | 261 (0.2) | 375 (0.6) | 30 (0.3) | 692 (0.8) | |
| Missing | 1,700 (1.4) | 1,403 (2.1) | 259 (2.5) | 1,507 (1.7) | |
| Paternal educational attainment | |||||
| Less than high school | 4,771 (3.8) | 5,187 (7.8) | 945 (9.1) | 6,623 (7.7) | |
| High school | 41,131 (32.9) | 26,933 (40.5) | 3,846 (37.1) | 31,802 (36.9) | |
| Technical school or junior college | 18,462 (14.8) | 9,806 (14.8) | 1,745 (16.8) | 10,960 (12.7) | |
| University or more | 58,393 (46.7) | 22,833 (34.3) | 3,526 (34.0) | 34,698 (40.3) | |
| Currently enrolled in school | 691 (0.6) | 334 (0.5) | 37 (0.4) | 581 (0.7) | |
| Missing | 1,671 (1.3) | 1,385 (2.1) | 260 (2.5) | 1,505 (1.7) | |
| Paternal employment status | |||||
| Regular worker | 114,772 (91.7) | 57,795 (86.9) | 4,658 (45.0) | 74,217 (86.1) | |
| Non-regular worker | 3,301 (2.6) | 3,811 (5.7) | 247 (2.4) | 3,093 (3.6) | |
| Self-employed worker | 5,244 (4.2) | 3,652 (5.5) | 5,231 (50.5) | 5,696 (6.6) | |
| Non-employed person | 1,647 (1.3) | 964 (1.5) | 130 (1.3) | 2,367 (2.7) | |
| Missing | 155 (0.1) | 256 (0.4) | 93 (0.9) | 796 (0.9) | |
| Birth characteristics | Paternal employment status | ||||
|---|---|---|---|---|---|
| Regular worker | Non-regular worker | Self-employed worker | Non-employed person | ||
| Total | 252,136 (100.0) | 10,513 (100.0) | 19,989 (100.0) | 5,156 (100.0) | |
| Infant's sex | |||||
| Female | 122,882 (48.7) | 5,140 (48.9) | 9,848 (49.3) | 2,560 (49.7) | |
| Male | 129,254 (51.3) | 5,373 (51.1) | 10,141 (50.7) | 2,596 (50.3) | |
| Maternal age group | |||||
| Under 20 years | 254 (0.1) | 35 (0.3) | 21 (0.1) | 23 (0.4) | |
| 20–24 years | 15,895 (6.3) | 1,076 (10.2) | 1,123 (5.6) | 552 (10.7) | |
| 25–29 years | 70,708 (28.0) | 2,864 (27.2) | 4,616 (23.1) | 1,452 (28.2) | |
| 30–34 years | 90,901 (36.1) | 3,430 (32.6) | 6,859 (34.3) | 1,589 (30.8) | |
| 35–39 years | 58,361 (23.1) | 2,336 (22.2) | 5,583 (27.9) | 1,126 (21.8) | |
| 40 years or more | 16,017 (6.4) | 772 (7.3) | 1,787 (8.9) | 414 (8.0) | |
| Maternal nationality | |||||
| Japanese | 240,444 (95.4) | 7,642 (72.7) | 19,070 (95.4) | 4,198 (81.4) | |
| Non-Japanese | 11,692 (4.6) | 2,871 (27.3) | 919 (4.6) | 958 (18.6) | |
| Past experience of live births | |||||
| No | 100,151 (39.7) | 4,131 (39.3) | 5,936 (29.7) | 2,179 (42.3) | |
| Yes | 151,985 (60.3) | 6,382 (60.7) | 14,053 (70.3) | 2,977 (57.7) | |
| Past experience of stillbirths | |||||
| No | 250,911 (99.5) | 10,446 (99.4) | 19,865 (99.4) | 5,116 (99.2) | |
| Yes | 1,225 (0.5) | 67 (0.6) | 124 (0.6) | 40 (0.8) | |
| Maternal educational attainment | |||||
| Less than high school | 9,559 (3.8) | 932 (8.9) | 1,566 (7.8) | 489 (9.5) | |
| High school | 82,426 (32.7) | 3,729 (35.5) | 7,489 (37.5) | 1,888 (36.6) | |
| Technical school or junior college | 72,123 (28.6) | 2,243 (21.3) | 5,741 (28.7) | 1,106 (21.5) | |
| University or more | 83,042 (32.9) | 3,159 (30.0) | 4,582 (22.9) | 1,426 (27.7) | |
| Currently enrolled in school | 990 (0.4) | 189 (1.8) | 71 (0.4) | 104 (2.0) | |
| Missing | 3,996 (1.6) | 261 (2.5) | 540 (2.7) | 143 (2.8) | |
| Paternal educational attainment | |||||
| Less than high school | 12,301 (4.9) | 1,290 (12.3) | 3,098 (15.5) | 776 (15.1) | |
| High school | 89,543 (35.5) | 4,006 (38.1) | 7,970 (39.9) | 2,036 (39.5) | |
| Technical school or junior college | 35,425 (14.0) | 1,395 (13.3) | 3,580 (17.9) | 548 (10.6) | |
| University or more | 110,210 (43.7) | 3,141 (29.9) | 4,775 (23.9) | 1,313 (25.5) | |
| Currently enrolled in school | 820 (0.3) | 426 (4.1) | 50 (0.3) | 346 (6.7) | |
| Missing | 3,837 (1.5) | 255 (2.4) | 516 (2.6) | 137 (2.7) | |
| Maternal employment status | |||||
| Regular worker | 114,772 (45.5) | 3,301 (31.4) | 5,244 (26.2) | 1,647 (31.9) | |
| Non-regular worker | 57,795 (22.9) | 3,811 (36.3) | 3,652 (18.3) | 964 (18.7) | |
| Self-employed worker | 4,658 (1.8) | 247 (2.3) | 5,231 (26.2) | 130 (2.5) | |
| Non-employed person | 74,217 (29.4) | 3,093 (29.4) | 5,696 (28.5) | 2,367 (45.9) | |
| Missing | 694 (0.3) | 61 (0.6) | 166 (0.8) | 48 (0.9) | |
| Employment status | Outcome | |||
|---|---|---|---|---|
| Preterm birth | TLBW | SGA | ||
| Maternal employment status | ||||
| Regular worker | 5,620 (4.5) | 6,106 (5.1) | 8,163 (6.5) | |
| Non-regular worker | 3,089 (5.0) | 3,251 (5.5) | 4,221 (6.8) | |
| Self-employed worker | 448 (4.8) | 441 (5.0) | 581 (6.2) | |
| Non-employed person | 3,972 (4.8) | 3,892 (4.9) | 5,319 (6.4) | |
| Paternal employment status | ||||
| Regular worker | 11,584 (4.6) | 12,265 (5.1) | 16,292 (6.5) | |
| Non-regular worker | 474 (5.6) | 395 (4.9) | 538 (6.4) | |
| Self-employed worker | 828 (4.7) | 815 (4.9) | 1,149 (6.6) | |
| Non-employed person | 243 (5.6) | 214 (5.2) | 305 (7.0) | |
| Employment status | Preterm birth | TLBW | SGA | ||||
|---|---|---|---|---|---|---|---|
| Adjusted RR (95% CI)a | Adjusted RR (95% CI)a | Adjusted RR (95% CI)a | |||||
| Maternal employment status | |||||||
| Regular worker | Reference | Reference | Reference | ||||
| Non-regular worker | 1.053 (1.004–1.104) | 0.034 | 1.092 (1.043–1.143) | < 0.001 | 1.032 (0.992–1.073) | 0.120 | |
| Self-employed worker | 0.993 (0.896–1.101) | 0.899 | 1.006 (0.904–1.119) | 0.919 | 0.943 (0.862–1.032) | 0.203 | |
| Non-employed person | 1.044 (0.998–1.091) | 0.059 | 1.028 (0.984–1.075) | 0.210 | 0.986 (0.950–1.024) | 0.476 | |
| Paternal employment status | |||||||
| Regular worker | Reference | Reference | Reference | ||||
| Non-regular worker | 1.142 (1.032–1.264) | 0.010 | 0.989 (0.891–1.098) | 0.835 | 1.015 (0.929–1.110) | 0.740 | |
| Self-employed worker | 0.971 (0.901–1.047) | 0.441 | 0.943 (0.874–1.018) | 0.135 | 1.003 (0.942–1.069) | 0.915 | |
| Non-employed person | 1.132 (0.986–1.300) | 0.079 | 1.019 (0.884–1.174) | 0.796 | 1.099 (0.975–1.238) | 0.122 | |
Table 1 The number (%) of live births by each birth characteristics for maternal employment statuses
Table 2 The number (%) of live births by each birth characteristics for paternal employment statuses
Table 3 The number and rate (%) of the adverse birth outcomes by parental employment statuses
Weighted number (%) are shown.
TLBW: term low birthweight; SGA: small-for-gestational-age.
Table 4 The result of the log-binomial regression analysis showing RR of parental employment statuses on the adverse outcomes
TLBW: term low birthweight; SGA: small-for-gestational-age; RR: risk ratio; CI: confidence interval.
aInfant's sex, maternal nationality, and maternal age group, past experience of live births, past experience of stillbirths, parental educational attainments, and spouse's employment status were adjusted.

