
Articles
- Page Path
- HOME > Ann Occup Environ Med > Volume 35; 2023 > Article
- Original Article Mediation analysis of chronotype, sleep-related factors, and depressive symptoms among workers: a cross-sectional study
-
Seo Young Kim1
 , Hyo Jeong Kim1, Seong-Sik Cho2, Min Young Park1, Mo-Yeol Kang1
 -
Annals of Occupational and Environmental Medicine 2023;35:e47.
DOI: https://doi.org/10.35371/aoem.2023.35.e47
Published online: November 20, 2023
1Department of Occupational and Environmental Medicine, Seoul St. Mary’s Hospital, College of Medicine, The Catholic University of Korea, Seoul, Korea.
2Department of Occupational and Environmental Medicine, College of Medicine, Dong-A University, Busan, Korea.
- Correspondence: Mo-Yeol Kang. Department of Occupational and Environmental Medicine, Seoul St. Mary’s Hospital, College of Medicine, The Catholic University of Korea, 222 Banpo-daero, Seocho-gu, Seoul 06591, Korea. snaptoon@naver.com
• Received: August 15, 2023 • Revised: October 7, 2023 • Accepted: October 30, 2023
Copyright © 2023 Korean Society of Occupational & Environmental Medicine
This is an Open Access article distributed under the terms of the Creative Commons Attribution Non-Commercial License (https://creativecommons.org/licenses/by-nc/4.0/) which permits unrestricted non-commercial use, distribution, and reproduction in any medium, provided the original work is properly cited.
Abstract
-
Background This study aimed to examine the impact of chronotype on depressive symptoms and explore the mediating effects of sleep quality, pre-sleep cognitive arousal, and social jetlag in a sample of wage earners.
-
Methods A total of 3,917 waged workers were surveyed online in July 2022. Logistic regression and mediation analysis were used to assess the relationship between chronotype (morningness, intermediate, and eveningness) and depressive symptoms (Patient Health Questionnaire ≥ 5), and the mediating effects of Insomnia Severity Index (ISI), Pittsburgh Sleep Quality Index (PSQI), and Pre-Sleep Arousal Scale (PSAS). All analyses were adjusted for age, education level, income level, marital status, coffee consumption, alcohol consumption, physical activity, occupation, employment status, and working hours to calculate odds ratios (ORs).
-
Results The chronotypes of all the participants were divided into morningness (4.7%), intermediate (93.5%), and eveningness (1.8%). Multiple logistic regression analysis showed an increased risk of depression in the eveningness chronotype (OR: 2.96; 95% confidence interval [CI]: 1.51, 5.86). Regarding the mediation analysis, ISI mediated 28.44% (95% CI: 16.39–40.5), PSQI for 31.25% (95% CI: 19.36, 43.15), and PSAS-Cognitive Score (PSAS-C) for 23.58% (95% CI: 10.66, 36.50) of the association between chronotype and depressive symptoms. However, social jetlag did not significantly mediate this relationship. (percentage mediated = 0.75%, 95% CI: −3.88, 5.39)
-
Conclusions Evening chronotypes exhibit an increased risk of depressive symptoms, which ISI, PSQI, and PSAS-C partially mediated. This suggests that interventions to improve sleep quality and maintain adequate sleep habits may effectively prevent and treat depression in employees with an eveningness chronotype.
BACKGROUND
Depression is highly prevalent in the working population and significantly impacts productivity.1,2 However, the mechanisms underlying its development and maintenance among workers are poorly understood. Recent studies have focused on the role of chronotypes in the pathophysiology of depression.
The concept of “chronotype” refers to an individual's preference for sleep and wake times rooted in their inherent circadian rhythms. Typically categorized as morningness (early risers, most active in the morning) and eveningness (late sleepers, most active in the evening), an individual's chronotype can significantly influence their choice of activity times throughout the day.3 The influence of these varying chronotypes on mental health outcomes is a topic of ongoing research, particularly their potential role in the onset and persistence of depression.4
The association between evening chronotypes and increased risk of depressive symptoms or disorders has been highlighted in several studies, including findings among newly hired nurses in Korea5 and individuals in a Finnish birth cohort study.6 However, these associations were not statistically significant after adjusting for sleep variables or hours worked, suggesting that sleep-related factors play a role in the relationship between eveningness and poor work productivity.
Although the association between chronotypes and depression is well established, the underlying mediating factors remain poorly understood. Poor sleep quality is a purported potential mediator of the relationship between chronotypes and depression. Horne et al.7 (2019) and Chiu et al.8 (2017) reported that poor sleep quality is a potential mediator between eveningness and depressive symptoms.
However, there are conflicting researches regarding the mediating effect of sleep on the association between eveningness and depression.9,10 Müller et al.11 found that evening hours and subjective sleep quality were independent risk factors for increased depressive symptoms. Recent researches also indicating that evening sleep and insomnia are independent predictors of nonrelapse in individuals with depression.12 Consequently, the relationship between evening chronotypes and depression and the mediating role of sleep status remains inconclusive.
In addition to sleep quality, research points to the contribution of social and psychological factors, such as increased rumination and social jetlag, to the relationship between evening chronotypes and depressive symptoms.9,13 Nonetheless, research investigating the relationship between sleep-related sociopsychological factors, chronotype, and depressive symptoms remains limited, necessitating further epidemiological studies.
Despite the significant impact of depression on productivity, research on the association between chronotypes and depressive symptoms has primarily focused on the general population or individuals with depression, with limited studies specifically conducted in the context of the workforce. Existing epidemiological studies involving nurses and shift workers often lack applicability to the broader working population.14 This study aimed to investigate the relationship between chronotype and depressive symptoms in the general working population in Korea and explore the mediators of this relationship. By investigating the potential mediation of sleep-related factors in the relationship between chronotype and depressive symptoms, our study aimed to provide insights into developing interventions to reduce the risk of depression among workers with circadian rhythm disorders.
METHODS
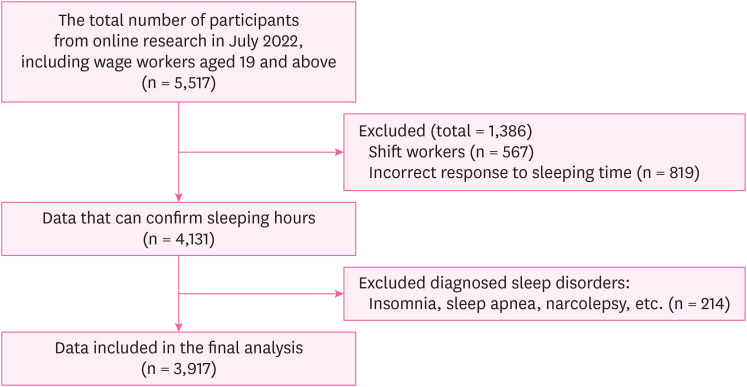
Participants were recruited in July 2022 using the online survey platform EMBRAIN. A total of 5,517 participants completed the initial screening process (wage earners aged 19 years and older), and those who met the following criteria were included: regular daytime work schedules, correct sleeping time, and no self-reported diagnosed sleep disorders. A total of 3,917 participants met the inclusion criteria and were included in the final analysis. A flowchart of the participants is shown in Fig. 1.
Chronotype
Chronotypes were assessed using the Morningness-Eveningness Questionnaire (MEQ),4 a self-reported questionnaire that measures an individual's preferred timing for sleep and activity. The participants were classified into three chronotype groups based on their MEQ scores: morning types (MEQ scores ≥ 18), intermediate types (MEQ scores of 12–17), and evening types (MEQ scores ≤ 11).
Depressive symptoms
Depressive symptoms were assessed using the Patient Health Questionnaire-9 (PHQ-9), a self-report questionnaire that measures the severity of depressive symptoms. The PHQ-9 measures the severity of depressive symptoms, with scores ranging from 0 to 27. PHQ-9 scores ≥ 5 were indicative of potential depressive symptoms. This cutoff was established to include a wide range of depressive symptoms, including early and mild symptoms, to identify individuals potentially at risk of developing depression.15
Sleep-related variables
Insomnia was evaluated using the Korean version of the Insomnia Severity Index (ISI). The ISI comprises seven items, each scored on a scale of 0–4 points, resulting in a possible score range of 0 to 28 points. A total score exceeding 8 points indicated as the high-risk group for insomnia.16
Sleep quality was assessed using the Pittsburgh Sleep Quality Index (PSQI), a self-reported questionnaire that measures subjective sleep quality, sleep latency, sleep duration, habitual sleep efficiency, sleep disturbances, use of sleep medication, and daytime dysfunction,17 with a total possible score of 21 points, with a higher score indicating poorer sleep quality. Sleep quality was classified into three levels: "good" for scores < 5, "moderate" for scores of 5–10, and "poor" for scores ≥ 11.
Pre-sleep cognitive arousal was measured using the Pre-Sleep Arousal Scale (PSAS), consisting of eight items that assess the level of cognitive arousal before bedtime.18 A clinically relevant cut-off score ≥ 20 has been reported for the PSAS.19
Social jetlag was measured using the Munich Chronotype Questionnaire, consisting of 24 items that assess the discrepancy between the timing of biological rhythms and social schedules. The difference between mid-sleep on workdays and free days was used as a measure of social jetlag.13 The level of social jetlag was categorized as follows: "mild" (< 1 hour), "moderate" (1–2 hours), and "severe" (> 2 hours).
Covariates
Work-related variables were adjusted to minimize the potential influence of physical activity on the relationship between chronotype and depressive symptoms. Work-related variables included job category (blue-collar: manual labor, white-collar: professional/clerical, pink-collar: service-oriented roles), job tenure (worked < 3 years or not), employment status (part-time; full-time), multiple job holdings (none; same field; different fields), and weekly working hours (number of hours during a typical day).
Sociodemographic variables, including sex (total sample), age, education, marital status, cohabitation status, smoking status, coffee drinking, alcohol consumption, income level, and physical activity, were collected through self-reported questionnaires and adjusted in this analysis.
Regarding income level, participants subjectively assessed their income, which was divided into six levels: "Very hard," "Hard," "Not enough," "Enough," "Sufficient," and "Very sufficient." Given the association between smoking status, insomnia, and mood regulation, participants were categorized into three groups20; “Current smoker,” “Ex-smoker,” and “None.” Coffee drinking were also categorized into three groups; “≤ 3 times/week,” “near-daily,” and “2–3 times/day.” Alcohol intake was assessed using the Five-Shot Questionnaire, which consists of five multiple-choice questions about alcohol use. Individuals were categorized as nondrinkers or dangerous drinkers based on their responses. A scores < 2.0 indicate alcohol abuse or dependency.21 The Global Physical Activity Questionnaire (GPAQ) was used to account for the potential influence of physical activity on the relationship between chronotype and depressive symptoms.22 The total GPAQ score represents the sum of the total levels (MET.min/week) of activities at work, moving from one place to another, and leisure activities. The participants were categorized into three groups based on the total GPAQ scoring protocol: high, moderate, and low.
All statistical analyses were performed using the SAS software (version 9.4; SAS Institute, Cary, NC, USA). Logistic regression analysis was used to examine the association between the chronotypes and depressive symptoms, and the odds ratios (ORs) with 95% confidence intervals (CIs) were calculated. Model 1 represented the unadjusted analysis, whereas model 2 was adjusted for sociodemographic variables (i.e. age, sex, educational level, marital status, cohabitation status, smoking status, coffee consumption, alcohol consumption, income level, and physical activity). Model 3 further incorporated adjustments for work-related variables, including job category, tenure, employment status, multiple job holdings, and working hours. Because sex differences were identified in the relationship between chronotypes and depressive symptoms, all regression models were stratified by sex.23
Furthermore, we investigated the mediating effects of ISI, PSQI, PSAS-Cognitive Score (PSAS-C), and social jetlag on the association between chronotype and depressive symptoms using the mediation analysis method proposed by Baron and Kenny24 (1986). The analysis calculated the total, direct, and indirect effects. A conceptual diagram of these mediating effects is shown in Fig. 2.
Fig. 2
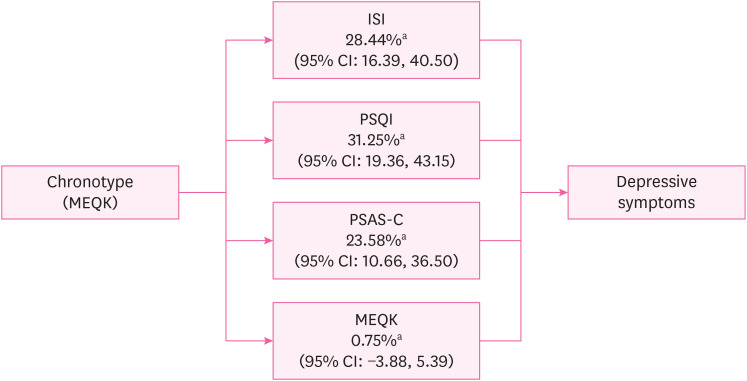
Conceptual diagram of sleep-related mediators in the relationship between chronotype and depressive symptoms. This result was adjusted for sex, age, education level, marital status, cohabitation status, smoking status, coffee consumption, alcohol consumption, income level, physical activity, and work-related variables (job category, job tenure, employment status, multiple job holdings, and working hours).
ISI: Insomnia Severity Index; PSQI: Pittsburgh Sleep Quality Index; PSAS-C: Pre-Sleep Arousal Scale-Cognitive Score; MEQK: Morningness-Eveningness Questionnaire Korean version; CI: confidence interval.
aPercentage mediated (%, CI).
This study was approved by the Institutional Review Board (IRB) of the Dong-A University of Korea (IRB number: 2-1040709-AB-N-01-202202-HR-017-06). All participants provided informed consent before participating in the study.
RESULTS
The baseline characteristics of the workers were analyzed according to their chronotypes (Tables 1 and 2). Of the 3,917 participants, 1.8% were morning-type, 93.5% intermediate, and 4.7% evening-type. The sex distribution did not significantly differ among chronotypes (p = 0.525). Average age was 43.4 ± 11.9, with morningness having the oldest mean (53.2 ± 10.8) and eveningness the youngest (33.8 ± 8.5). Eveningness participants were predominantly unmarried or divorced (72.6%) (p < 0.001). Activity levels (GPAQ) differed: morningness had the most active (14.3%) and eveningness the least (2.7%) (p = 0.027). Chronotypes showed no significant difference in education, alcohol use, income, job category, tenure, employment status, multiple jobs, or working hours. The depression variable showed a notable difference (p < 0.001); eveningness had the highest percentage of depression (66.1%) and morningness the lowest (25.7%).
Table 1
Baseline characteristics of workers according to the chronotype
Values are presented as number of participants (%).
Total GPAQ are counted as the sum of the total MET minutes of activities at work, moving from one place to another, leisure activities.
GPAQ = Global Physical Activity Questionnaire; PHQ-9: Patient Health Questionnaire-9.
aThe results were obtained by χ2 test.
Table 2
Baseline sleep characteristics of workers according to the chronotype
Table 2 shows baseline sleep characteristics. The proportion of participants who reported having trouble sleeping being highest in the eveningness group (72.6%) and lowest in the morningness group (40%) (p < 0.001). The PSQI also showed a significant difference between chronotypes, with the eveningness group having the largest percentage of participants with poor sleep quality (45.7%) and the morningness group having the lowest percentage (18.6%) (p < 0.001). In the PSAS-C, 78% of the eveningness group exceeded the cut-off point of 20, indicating high arousal, compared to 60% in the morningness group (p = 0.013). Social jetlag varied notably between chronotypes: 47.3% of eveningness had severe jetlag, compared to 15.7% in morningness (p < 0.001).
The multiple logistic regression analysis results are presented in Table 3. Compared to the morningness group, the eveningness group had a notably higher OR for depression across all models. In model 1 (crude model), the OR for eveningness was 5.63 (95% CI: 3.04, 10.43). In model 2, after adjustments, the ORs were 2.87 (95% CI: 1.49, 5.54) for eveningness and 1.40 (95% CI: 0.79, 2.49) for intermediate. Further adjustment for work-related factors in model 3 slightly attenuated the OR to 3.02 (95% CI: 1.56, 5.84) and 1.47 (95% CI: 0.83, 2.62) in the intermediate group.
Table 3
Odds ratios (95% confidence interval) of chronotype for depressive symptoms among workers
The p-value for all the result are < 0.01.
aAdjusted by sex (total sample), age, education level, marital status, living situation, smoking status, coffee consumption, alcohol consumption, income level, physical activity; bAdjusted by sex (total sample), age, education level, marital status, living situation, smoking status, coffee consumption, alcohol consumption, income level, physical activity, and work-related variables (job category, job tenure, employment status, multiple jobholding, and working hours).
In the sex-stratified analysis, the OR for depressive symptoms in the eveningness group was higher for both in model 1 (men: 4.73, 95% CI: 2.07, 10.82; women: 6.61, 95% CI: 2.61, 16.73). Adjustments in model 2 yielded ORs of 3.11 (95% CI: 1.27, 7.58) for men and 2.85 (95% CI: 1.07, 7.61) for women. Further adjustments in model 3 resulted in ORs of 3.46 (95% CI: 1.39, 8.58) for men and 2.77 (95% CI: 1.03, 7.48) for women.
The stratified analysis of sleep-related variables is presented in Supplementary Table 1. The insomnia group (ISI ≥ 8) and in the PSQI, evening chronotype workers displayed a higher OR for depressive symptoms in the crude model. However, upon adjustments in Model 2 and Model 3, the ORs showed non-significant CIs.
When evaluating the PSAS-C, evening chronotype workers in the "Normal" category had an OR that decreased in the following models. Yet, in the "Risk" group, there was a significant association in both model 2 with an OR of 2.68 (95% CI: 1.22, 5.85) and in model 3 with an OR of 2.72 (95% CI: 1.24, 5.97).
In social jetlag, evening chronotype workers in the "Mild" category registered notable ORs of 4.67 (95% CI: 1.62, 13.51) in model 2 and 5.43 (95% CI: 1.84, 15.99) in model 3. However, in the "Moderate" and "Poor" groups of social jetlag, the CIs were not significant.
Table 4 presents the results of the mediation analysis. The ISI, PSQI, PSAS-C, and social jetlag were included as potential mediators. After adjusting for sociodemographic and work-related variables, ISI, PSQI, and PSAS-C partially mediated the relationship between chronotype and depressive symptoms. The mediating effect of ISI was 28.44% (95% CI: 16.39, 40.50), PSQI was 31.25% (95% CI: 19.36, 43.15), and PSAS-C was 23.58% (95% CI: 10.66, 36.50). Social jetlag did not significantly mediate the relationship between chronotype and depressive symptoms, demonstrating a minimal mediating effect of only 0.75% (95% CI: −3.88, 5.39). The total indirect effect was negative for all four mediator variables, indicating that these variables partially mediated the negative relationship between chronotype and depressive symptoms. However, the statistical significance of the total indirect effect of social jetlag was not confirmed, as the 95% CI ranged from −0.02 to 0.005, including zero within its range.
Table 4
Summary of the results from the mediation analysisa
ISI: Insomnia Severity Index; PSQI: Pittsburgh Sleep Quality Index; PSAS-C: Pre-Sleep Arousal Scale-Cognitive Score; CI: confidence interval.aAdjusted by sex, age, education level, marital status, cohabitation status, smoking status, coffee consumption, alcohol consumption, income level, physical activity, and work-related variables (job category, job tenure, employment status, multiple job holdings, and working hours).
*p <0.01.
DISCUSSION
This study investigated the relationship between chronotype and depressive symptoms among the general working population in Korea while also examining the mediating role of various sleep-related variables. Multiple logistic regression analysis indicated that individuals with an eveningness chronotype had significantly higher odds of experiencing depressive symptoms than those of individuals with a morningness chronotype, even after adjusting for potential confounding variables, such as sociodemographic factors and work-related characteristics. Furthermore, the mediation analysis results revealed that the relationship between chronotypes and depressive symptoms could be partially explained by sleep-related variables. However, social jetlag did not have a substantial mediating effect.
These results align with previous researches, indicating that individuals with eveningness chronotypes are more prone to experiencing depressive symptoms than those with morningness chronotypes.25,26 Despite conflicting reports, compelling evidence suggests that eveningness reduces sleep quality, which directly impacts depression.
Another point of contention is whether the evening chronotype results from depressive symptoms or a potential causative factor. A meta-analysis in 2017 revealed no significant distinction in the relationship between chronotype and depressive symptoms when comparing the results of patients with depression to those of the general population, suggesting that the evening chronotype could serve as a risk factor for depression. However, the mechanisms underlying this potential relationship are unknown.27 According to the vulnerability-stress hypothesis of depression, the interplay between psychological vulnerability factors (e.g., negative biases, preferential processing of negative content) and environmental stressors (e.g., bereavement, financial uncertainty) contributes to depression.28 Several studies have also associated eveningness with high neuroticism, depressive personality types, negative biases in emotion processing, and impaired emotion regulation in healthy individuals without a history of depression.9,29,30 When these factors coincide with adversity, it can trigger depressive symptoms.25
One potential biological mechanism to explain the association between chronotype, sleep-related problems, and depression is the dysregulation of the circadian system. The circadian system regulates physiological processes, including the sleep-wake cycle and the release of hormones such as cortisol and melatonin, and its disruption in individuals with the eveningness chronotype may lead to sleep-related issues and dysregulation of the hypothalamic-pituitary-adrenal axis, potentially resulting in hypercortisolemia. This chain of events contributes to the onset and persistence of depressive symptoms.31,32
Additionally, neurobiological research has revealed abnormalities in brain regions such as the hippocampus, amygdala, and dorsal anterior cingulate cortex among individuals with the eveningness chronotype involved in emotion regulation.29,33 The current study expanded on these findings by stratifying potential mediating factors that may explain the relationship between chronotypes and depressive symptoms.
Our mediation analysis revealed that insomnia severity, sleep quality, and PSAS partially mediated the association between chronotype and depressive symptoms, suggesting that sleep-related problems commonly observed in individuals with the eveningness chronotype may contribute to an increased risk of depression. This reinforces the previously described idea that misalignment between the circadian rhythm and sleep-wake cycle, coupled with chronic insomnia, can impact mood and increase the risk of depression.
PSAS was identified as a partial mediator between chronotypes and depressive symptoms, with the higher PSAS-C group notably associating the evening chronotype with depressive symptoms in the stratified logistic regression analysis. Elevated pre-sleep cognitive arousal levels have been associated with poor sleep quality and an increased risk of depression. For instance, a study conducted during the coronavirus disease 2019 (COVID-19) pandemic in Italy found that the evening chronotype was a specific predictor of PSAS-C, and higher PSAS-C was linked to poorer sleep quality.34 Furthermore, previous research assessing the psychometric properties of the PSAS showed correlations with anxiety and depression.18 However, the exact mechanism underlying this association remains unclear. One possibility is that the items used in the PSAS-C to assess persistent cognition reflect rumination. Rumination, a key cognitive process in mood disorders, may be prolonged due to a delay in circadian rhythm timing among individuals with the evening chronotype, potentially leading to the development of depression.35,36 Antypa et al.9 (2017) also reported that rumination, worry, and hopelessness mediate the relationship between chronotype and depression. Most recently, Nowakowska-Domagała et al.37 (2022) reported that rumination mediated the relationship between poor sleep quality and increased depression. These findings can be attributed to the mechanisms involving a mismatch in circadian rhythms, which can result in chronic stress due to working at non-preferred times. This mismatch can lead to a surge in cortisol, a hormone that regulates the stress response, along with a decrease in the slope of cortisol concentrations, potentially affecting the morning effect. These alterations in cortisol dynamics may contribute to rumination and increase the risk of developing depression.38
While the ISI and the PSQI were not significant in the stratified logistic analysis, mediation analysis revealed their mediating role in the association between the chronotype and depressive symptoms. This suggests that the direct impact of chronotype on depressive symptoms may not be immediately evident among insomnia and PSQI, but the indirect path via the variables can be significant. Regarding social jetlag, while mild forms are perceived as near-normal with minimal disruption, the non-significant results in moderate and poor categories suggest either a threshold effect stabilizing its relationship with depressive symptoms or potential resilience among those experiencing persistent jetlag. However, even though the mild category correlated with depressive symptoms, the mediation effect was limited, indicating the need for further research to elucidate the dynamics between social jetlag, chronotype, and depressive symptoms.
While the biological and physiological mechanisms between chronotype and depressive symptoms have been widely studied, the political implications also need consideration. Chronotypes, directly related to productivity and well-being, can influence labor policies and workplace regulations. Recognizing the diverse sleep patterns and the mental health outcomes could encourage policymakers to advocate for flexible working hours, especially for those with eveningness chronotypes. Moreover, a creative strategy would involve integrating these findings into health campaigns and promotions. It's essential to educate both the general population and employers about the importance of aligning work schedules with an individual's inherent circadian rhythm. In contemporary labor context, with its irregular working hours, night shifts, and long working hour, it's crucial to align working schedules with individual’s circadian preferences. This alignment could lead not only to improved health outcomes but also to enhanced workplace productivity. Therefore, adapting work schedules to better match the circadian rhythms of employees could serve as a pivotal step toward improving both individual health and organizational performance.
This study has several limitations. First, its cross-sectional design precludes causal inferences. While there is a possibility of reverse causation, whereby individuals with depressive symptoms may exhibit an evening chronotype, the impact of reverse causation bias is likely minimal, given the genetic influence and stability of the chronotype.39,40,41,42 Furthermore, this study intentionally excluded shift workers, thereby reducing possible bias from daily light exposure. Nevertheless, future studies with longitudinal designs are necessary to conclusively determine the directionality of the observed associations. Second, the reliance on online surveys and convenience sampling may limit the generalizability of the findings to a broader population. The higher prevalence of depressive symptoms and the proportion of white-collar workers in the study population compared to the general population of South Korea could have induced selection bias.43,44 Moreover, the survey was conducted during the COVID-19 pandemic, which may have influenced the prevalence of depressive symptoms.45 The proportion of evening chronotypes was also significantly lower than that in the general Korean population (15.4% vs. 4.8%).23 However, this study focused specifically on wage earners and differed from the sample of the broader population surveyed in the Korea National Health and Nutrition Examination Survey, which includes approximately 40% of the population without a job. Third, the survey did not capture specifics about the participant's industry or their position within the company. Fourth, there could be various other mediating factors (i.e. anxiety, screen time, etc), but our data did not encompass enough information to include these variables. Lastly, the assessments of chronotypes, depressive symptoms, and insomnia relied on self-reported questionnaires. The use of the dim light melatonin onset technique to determine the timing of melatonin secretion in the evening under low-light conditions may provide more reliable clinical measurements.46
CONCLUSIONS
The eveningness chronotype may be associated with a higher risk of depressive symptoms among workers, partially mediated by sleep-related variables. These findings necessitates workplace interventions, particularly focusing on sleep hygiene and flexible scheduling, to support those with the eveningness chronotype. Further research is needed to fully understand the mechanisms underlying these associations and identify effective interventions for promoting healthy sleep and mental health among workers.
Acknowledgements
The authors appreciate the Occupational Safety and Health Research Institute for providing the raw data from the 6th Korean Working Conditions Survey.
Abbreviations
CI
confidence interval
COVID-19
coronavirus disease 2019
GPAQ
Global Physical Activity Questionnaire
IRB
Institutional Review Board
ISI
Insomnia Severity Index
MEQ
Morningness-Eveningness Questionnaire
OR
odds ratio
PHQ-9
Patient Health Questionnaire-9
PSAS
Pittsburgh Sleep Quality Index
PSAS-C
PSAS-Cognitive Score
PSQI
Pittsburgh Sleep Quality Index
-
Funding: This research is supported by National Research Foundation of Korea (NRF-2022R1F1A1066498).
-
Competing interests: The authors declare that they have no competing interest.
-
Author Contributions:
NOTES
SUPPLEMENTARY MATERIAL
Supplementary Table 1
Odds ratios (95% confidence interval) of chronotype for depressive symptoms among workers (stratified by sleep-related variables)
- 1. Eaton WW, Anthony JC, Mandel W, Garrison R. Occupations and the prevalence of major depressive disorder. J Occup Med 1990;32(11):1079–1087. 2258762.ArticlePubMed
- 2. Kessler RC, Frank RG. The impact of psychiatric disorders on work loss days. Psychol Med 1997;27(4):861–873. 9234464.ArticlePubMed
- 3. Adan A, Archer SN, Hidalgo MP, Di Milia L, Natale V, Randler C. Circadian typology: a comprehensive review. Chronobiol Int 2012;29(9):1153–1175. 23004349.ArticlePubMed
- 4. Horne JA, Ostberg O. A self-assessment questionnaire to determine morningness-eveningness in human circadian rhythms. Int J Chronobiol 1976;4(2):97–110. 1027738.PubMed
- 5. Lee S, Jung HN, Ryu J, Jung WC, Kim YM, Kim H. Relationship between chronotype and depressive symptoms among newly hired hospital nurses in the Republic of Korea. Ann Occup Environ Med 2022;34(1):e32. 36452247.ArticlePubMedPMCPDF
- 6. Räihä T, Nerg I, Jurvelin H, Conlin A, Korhonen M, Ala-Mursula L. Evening chronotype is associated with poor work ability and disability pensions at midlife: a Northern Finland Birth Cohort 1966 Study. Occup Environ Med 2021.
- 7. Horne CM, Watts AL, Norbury R. The influence of subjective sleep quality on the association between eveningness and depressive symptoms. Biol Rhythm Res 2019;50(4):534–542.Article
- 8. Chiu WH, Yang HJ, Kuo PH. Chronotype preference matters for depression in youth. Chronobiol Int 2017;34(7):933–941. 28613957.ArticlePubMed
- 9. Antypa N, Verkuil B, Molendijk M, Schoevers R, Penninx BW, Van Der Does W. Associations between chronotypes and psychological vulnerability factors of depression. Chronobiol Int 2017;34(8):1125–1135. 28759270.ArticlePubMedPDF
- 10. Kitamura S, Hida A, Watanabe M, Enomoto M, Aritake-Okada S, Moriguchi Y, et al. Evening preference is related to the incidence of depressive states independent of sleep-wake conditions. Chronobiol Int 2010;27(9-10):1797–1812. 20969524.ArticlePubMed
- 11. Müller MJ, Kundermann B, Cabanel N. Eveningness and poor sleep quality independently contribute to self-reported depression severity in psychiatric inpatients with affective disorder. Nord J Psychiatry 2016;70(5):329–334. 26634390.ArticlePubMed
- 12. Chan JW, Lam SP, Li SX, Yu MW, Chan NY, Zhang J, et al. Eveningness and insomnia: independent risk factors of nonremission in major depressive disorder. Sleep (Basel) 2014;37(5):911–917.ArticlePubMedPMC
- 13. Wittmann M, Dinich J, Merrow M, Roenneberg T. Social jetlag: misalignment of biological and social time. Chronobiol Int 2006;23(1-2):497–509. 16687322.ArticlePubMed
- 14. Cheng WJ, Puttonen S, Vanttola P, Koskinen A, Kivimäki M, Härmä M. Association of shift work with mood disorders and sleep problems according to chronotype: a 17-year cohort study. Chronobiol Int 2021;38(4):518–525. 33588657.ArticlePubMed
- 15. Kroenke K, Spitzer RL. The PHQ-9: a New Depression Diagnostic and Severity Measure. Thorofare, NJ, USA: Slack Incorporated; 2002.
- 16. Cho YW, Song ML, Morin CM. Validation of a Korean version of the insomnia severity index. J Clin Neurol 2014;10(3):210–215. 25045373.ArticlePubMedPMC
- 17. Buysse DJ, Reynolds CF 3rd, Monk TH, Berman SR, Kupfer DJ. The Pittsburgh Sleep Quality Index: a new instrument for psychiatric practice and research. Psychiatry Res 1989;28(2):193–213. 2748771.ArticlePubMed
- 18. Nicassio PM, Mendlowitz DR, Fussell JJ, Petras L. The phenomenology of the pre-sleep state: the development of the pre-sleep arousal scale. Behav Res Ther 1985;23(3):263–271. 4004706.ArticlePubMed
- 19. Puzino K, Amatrudo G, Sullivan A, Vgontzas AN, Fernandez-Mendoza J. Clinical significance and cut-off scores for the Pre-Sleep Arousal Scale in chronic insomnia disorder: a replication in a clinical sample. Behav Sleep Med 2020;18(6):705–718. 31545084.ArticlePubMed
- 20. Patterson F, Malone SK, Lozano A, Grandner MA, Hanlon AL. Smoking, screen-based sedentary behavior, and diet associated with habitual sleep duration and chronotype: data from the UK biobank. Ann Behav Med 2016;50(5):715–726. 27056396.ArticlePubMedPMCPDF
- 21. Aalto M, Tuunanen M, Sillanaukee P, Seppä K. Effectiveness of structured questionnaires for screening heavy drinking in middle-aged women. Alcohol Clin Exp Res 2006;30(11):1884–1888. 17067353.ArticlePubMed
- 22. Bull FC, Maslin TS, Armstrong T. Global Physical Activity Questionnaire (GPAQ): nine country reliability and validity study. J Phys Act Health 2009;6(6):790–804. 20101923.ArticlePubMed
- 23. Kim KM, Han SM, Heo K, Kim WJ, Chu MK. Sex differences in the association between chronotype and risk of depression. Sci Rep 2020;10(1):18512. 33116223.ArticlePubMedPMCPDF
- 24. Baron RM, Kenny DA. The moderator-mediator variable distinction in social psychological research: conceptual, strategic, and statistical considerations. J Pers Soc Psychol 1986;51(6):1173–1182. 3806354.ArticlePubMed
- 25. Norbury R. Diurnal preference and depressive symptomatology: a meta-analysis. Sci Rep 2021;11(1):12003. 34099766.ArticlePubMedPMCPDF
- 26. Kivelä L, Papadopoulos MR, Antypa N. Chronotype and psychiatric disorders. Curr Sleep Med Rep 2018;4(2):94–103. 29888167.ArticlePubMedPMCPDF
- 27. Au J, Reece J. The relationship between chronotype and depressive symptoms: a meta-analysis. J Affect Disord 2017;218:93–104. 28463712.ArticlePubMed
- 28. Hankin BL, Abramson LY, Miller N, Haeffel GJ. Cognitive vulnerability-stress theories of depression: examining affective specificity in the prediction of depression versus anxiety in three prospective studies. Cognit Ther Res 2004;28(3):309–345.ArticlePDF
- 29. Horne CM, Marr-Phillips SDM, Jawaid R, Gibson EL, Norbury R. Negative emotional biases in late chronotypes. Biol Rhythm Res 2017;48(1):151–155.Article
- 30. Watts AL, Norbury R. Reduced effective emotion regulation in night owls. J Biol Rhythms 2017;32(4):369–375. 28627300.ArticlePubMedPDF
- 31. Hasler BP, Buysse DJ, Kupfer DJ, Germain A. Phase relationships between core body temperature, melatonin, and sleep are associated with depression severity: further evidence for circadian misalignment in non-seasonal depression. Psychiatry Res 2010;178(1):205–207. 20471106.ArticlePubMedPMC
- 32. Keller J, Flores B, Gomez RG, Solvason HB, Kenna H, Williams GH, et al. Cortisol circadian rhythm alterations in psychotic major depression. Biol Psychiatry 2006;60(3):275–281. 16458262.ArticlePubMed
- 33. Horne CM, Norbury R. Exploring the effect of chronotype on hippocampal volume and shape: a combined approach. Chronobiol Int 2018;35(7):1027–1033. 29621410.ArticlePubMed
- 34. Gorgoni M, Scarpelli S, Mangiaruga A, Alfonsi V, Bonsignore MR, Fanfulla F, et al. Pre-sleep arousal and sleep quality during the COVID-19 lockdown in Italy. Sleep Med 2021;88:46–57. 34731828.ArticlePubMedPMC
- 35. Takano K, Tanno Y. Diurnal variation in rumination. Emotion 2011;11(5):1046–1058. 21517158.ArticlePubMed
- 36. Bauducco S, Richardson C, Gradisar M. Chronotype, circadian rhythms and mood. Curr Opin Psychol 2020;34:77–83. 31786494.ArticlePubMed
- 37. Nowakowska-Domagała K, Juraś-Darowny M, Pietras T, Stecz P, Mokros Ł. Chronotype and poor sleep quality in young adults - a pilot study on the role of rumination. Sleep Med 2022;100:206–211. 36115139.ArticlePubMed
- 38. Sladek MR, Doane LD, Breitenstein RS. Daily rumination about stress, sleep, and diurnal cortisol activity. Cogn Emot 2020;34(2):188–200. 30961457.ArticlePubMedPMC
- 39. Toomey R, Panizzon MS, Kremen WS, Franz CE, Lyons MJ. A twin-study of genetic contributions to morningness-eveningness and depression. Chronobiol Int 2015;32(3):303–309. 25347156.ArticlePubMedPMC
- 40. Lee JH, Kim SJ, Lee SY, Jang KH, Kim IS, Duffy JF. Reliability and validity of the Korean version of Morningness-Eveningness Questionnaire in adults aged 20–39 years. Chronobiol Int 2014;31(4):479–486. 24467306.ArticlePubMedPMC
- 41. Müller MJ, Cabanel N, Olschinski C, Jochim D, Kundermann B. Chronotypes in patients with nonseasonal depressive disorder: distribution, stability and association with clinical variables. Chronobiol Int 2015;32(10):1343–1351. 26540575.ArticlePubMed
- 42. Comas M, Solis Flores A, Lovato N, Miller CB, Bartlett DJ, Grunstein RR, et al. The relationship between anxiety, subjective and objective sleep, chronotype and circadian rhythms with depressive symptoms in insomnia disorder. Brain Sci 2023;13(4):613. 37190578.ArticlePubMedPMC
- 43. Shin C, Ko YH, An H, Yoon HK, Han C. Normative data and psychometric properties of the Patient Health Questionnaire-9 in a nationally representative Korean population. BMC Psychiatry 2020;20(1):194. 32354339.ArticlePubMedPMCPDF
- 44. Min J, Jang TW, Lee HE, Cho SS, Kang MY. Social jetlag and risk of depression: results from the Korea National Health and Nutrition Examination Survey. J Affect Disord 2023;323:562–569. 36496100.ArticlePubMed
- 45. Lee EJ, Kim SJ. Prevalence and related factors of depression before and during the COVID-19 pandemic: findings from the Korea National Health and Nutrition Examination Survey. J Korean Med Sci 2023;38(10):e74. 36918028.ArticlePubMedPMCPDF
- 46. Kantermann T, Burgess HJ. Average mid-sleep time as a proxy for circadian phase. PsyCh J 2017;6(4):290–291. 29035008.ArticlePubMedPDF
REFERENCES
REFERENCES
Figure & Data
REFERENCES
Citations
Citations to this article as recorded by 
- Mediating effects of self-control and sleep quality on the association between social jetlag and mental health in adolescents
Yiting Liu, Tao Huang, Zhizhong Li, Haoran Cui, Xiumin Dou
Chronobiology International.2026; 43(1): 44. CrossRef - Workplace Psychosocial Safety Climate and Sleep Health: Association With Sleep Quality and Insomnia Symptoms
Jiwon Kim, Seong‐Sik Cho, Maureen F. Dollard, May Young Loh, Mo‐Yeol Kang
Journal of Sleep Research.2026;[Epub] CrossRef - Chronotype and depression: A global systematic review and meta-analysis
Xianjian Dong, Jieyu Liu, Xinxin Wang, Ze Liang
Psychiatry Research.2026; 358: 116945. CrossRef - Morningness vs Eveningness: Systematic Review with ☸️SAIMSARA
SAIMSARA Journal.2026;[Epub] CrossRef - Chronotype and Subjective Memory Complaints: The Sequential Mediating Roles of Sleep Quality and Psychological Distress
Pedro F. S. Rodrigues, Marco Lopes, Inês B. Oliveira, Sara M. Fernandes, Ana Bártolo, Ana Paula Caetano, Ramón López-Higes, Susana Rubio-Valdehita, Pedro B. Albuquerque
Behavioral Sciences.2026; 16(3): 457. CrossRef - Chronotype and general health in police professionals: Resilience as a moderator and stress as a mediator
Rohit Kumar Maurya, Sandeep Panchal
Journal of Workplace Behavioral Health.2026; : 1. CrossRef - Data profile: Korean Work, Sleep, and Health Study (KWSHS)
Seong-Sik Cho, Jeehee Min, Heejoo Ko, Mo-Yeol Kang
Ann Occup Environ Med.2025; 37: e3. CrossRef - Increased risk of herpes zoster associated with stress and sleep deprivation: Evidence from korea health panel survey
Youjin Kim, Wanhyung Lee
Journal of Psychiatric Research.2025; 184: 333. CrossRef -
Validation of the Norwegian version of the Munich ChronoType Questionnaire for shift workers (MCTQ
Shift
)
Line Victoria Moen, Tarjei L. Rysstad, Jenny-Anne S. Lie, Fred Haugen, Dagfinn Matre
Chronobiology International.2025; 42(8): 1013. CrossRef - Work ability and health-related productivity loss by chronotype: Results from population-based panel study
Heejoo Ko, Seong-Sik Cho, Mo-Yeol Kang
Sleep Health.2025; 11(5): 731. CrossRef - Role of chronotype in depression
Yang Zhao, Ji-Wu Liao, Qiao-Ting Huang
World Journal of Psychiatry.2025;[Epub] CrossRef - The interplay of physical activity, sleep, and chronotype on physical and mental health in Italian university students: a moderated mediation analysis
Lucia Castelli, Letizia Galasso, Marta Borrelli, Fabio Esposito, Andrea Caumo, Giovanni Michielon, Eliana Roveda, Angela Montaruli
BMC Public Health.2025;[Epub] CrossRef - The prevalence and clinical correlation factors of cognitive impairment in patients with major depressive disorder hospitalized during the acute phase
Huiyuan Zhao, Jinhong Chen
Frontiers in Psychiatry.2024;[Epub] CrossRef - Association between the safety climate and occupational injury in the Korean working population: a cross-sectional study
Jeehee Min, Tae-Won Jang, Hye-Eun Lee, Mo-Yeol Kang, Seong-Sik Cho
Epidemiology and Health.2024; 46: e2024082. CrossRef
 Cite
Cite- Figure
-
- Related articles
-
- Factors affecting heat-related illness symptoms among school food service workers: a cross-sectional study in Korea
- The association of shift work and TyG index among male workers in a chemical plant of Korea: a cross-sectional study
- Burnout, stress, and their correlates among bank employees of South India: a cross-sectional study
Mediation analysis of chronotype, sleep-related factors, and depressive symptoms among workers: a cross-sectional study


Fig. 1 Flow chart of study participants.
Fig. 2 Conceptual diagram of sleep-related mediators in the relationship between chronotype and depressive symptoms. This result was adjusted for sex, age, education level, marital status, cohabitation status, smoking status, coffee consumption, alcohol consumption, income level, physical activity, and work-related variables (job category, job tenure, employment status, multiple job holdings, and working hours).ISI: Insomnia Severity Index; PSQI: Pittsburgh Sleep Quality Index; PSAS-C: Pre-Sleep Arousal Scale-Cognitive Score; MEQK: Morningness-Eveningness Questionnaire Korean version; CI: confidence interval.aPercentage mediated (%, CI).
Fig. 1
Fig. 2
Mediation analysis of chronotype, sleep-related factors, and depressive symptoms among workers: a cross-sectional study
| Variables | Total | Chronotype | ||||
|---|---|---|---|---|---|---|
| Morningness | Intermediate | Eveningness | ||||
| Overall | 3,917 | 70 (1.8) | 3,661 (93.5) | 186 (4.7) | ||
| Sex | 0.525 | |||||
| Male | 2,088 (53.3) | 41 (58.6) | 1,956 (53.4) | 91 (48.9) | ||
| Female | 1,829 (46.7) | 29 (41.4) | 1,705 (46.6) | 95 (51.1) | ||
| Age (years) | < 0.001 | |||||
| 20–29 | 751 (19.2) | 4 (5.7) | 661 (18.1) | 86 (46.2) | ||
| 30–39 | 791 (20.2) | 2 (2.9) | 732 (20.0) | 57 (30.6) | ||
| 40–49 | 956 (24.4) | 18 (25.7) | 909 (24.8) | 29 (15.6) | ||
| 50–59 | 956 (24.4) | 18 (25.7) | 927 (25.3) | 11 (5.9) | ||
| ≥ 60 | 463 (11.8) | 28 (40.0) | 432 (11.0) | 3 (1.6) | ||
| Education | 0.540 | |||||
| Middle school or less | 14 (0.4) | 0 (0) | 13 (0.4) | 1 (0.5) | ||
| High school | 521 (13.3) | 15 (21.4) | 485 (13.2) | 21 (11.3) | ||
| College or more | 3,382 (86.3) | 55 (78.6) | 3,163 (86.4) | 164 (88.2) | ||
| Marital status | < 0.001 | |||||
| Unmarried & divorced | 1,720 (43.9) | 17 (24.3) | 1,568 (42.8) | 135 (72.6) | ||
| Married | 2,197 (56.1) | 53 (75.7) | 2,093 (57.2) | 51 (27.4) | ||
| Cohabitation status | < 0.001 | |||||
| Not living alone | 3,202 (81.7) | 65 (92.9) | 3,003 (82.0) | 134 (72.0) | ||
| Living alone | 715 (18.3) | 5 (7.1) | 658 (18.0) | 52 (28.0) | ||
| Smoking status | < 0.001 | |||||
| Current | 871 (22.2) | 18 (25.7) | 791 (21.6) | 62 (33.3) | ||
| Ex-smoker | 828 (21.1) | 21 (30.0) | 786 (21.5) | 21 (11.3) | ||
| None | 2,218 (56.6) | 31 (44.3) | 2,084 (56.9) | 103 (55.4) | ||
| Coffee consumption | 0.489 | |||||
| ≤ 3 times/week | 1,154 (29.5) | 26 (37.1) | 1,066 (29.1) | 62 (33.3) | ||
| Near-daily | 1,229 (31.4) | 18 (25.7) | 1,163 (31.8) | 48 (25.8) | ||
| 2–3 times/day | 1,534 (39.2) | 26 (37.1) | 1,432 (39.1) | 76 (40.9) | ||
| Alcohol (five-shot) | 0.440 | |||||
| None to moderate (< 2) | 1,816 (46.4) | 39 (55.7) | 1,694 (46.3) | 83 (44.6) | ||
| Risky | 2,101 (53.6) | 31 (44.3) | 1,967 (53.7) | 103 (55.4) | ||
| Income level | 0.608 | |||||
| Very sufficient | 68 (1.7) | 2 (2.9) | 62 (1.7) | 4 (2.2) | ||
| Sufficient | 741 (18.9) | 22 (31.4) | 685 (18.7) | 34 (18.3) | ||
| Enough | 1,067 (27.2) | 19 (27.1) | 1,000 (27.3) | 48 (25.8) | ||
| Not enough | 1,309 (33.4) | 16 (22.9) | 1,229 (33.6) | 64 (34.4) | ||
| Hard | 588 (15.0) | 8 (11.4) | 555 (15.2) | 25 (13.4) | ||
| Very hard | 144 (3.7) | 3 (4.3) | 130 (3.6) | 11 (5.9) | ||
| GPAQ | 0.027 | |||||
| High | 281 (7.2) | 10 (14.3) | 266 (7.3) | 5 (2.7) | ||
| Intermediate | 178 (4.5) | 5 (7.1) | 168 (4.6) | 5 (2.7) | ||
| Low | 3,458 (88.3) | 55 (78.6) | 3,227 (88.1) | 176 (94.6) | ||
| Job category | 0.123 | |||||
| Blue collar | 678 (17.3) | 14 (20.0) | 640 (17.5) | 24 (12.9) | ||
| White collar | 2,833 (72.3) | 44 (62.9) | 2,640 (72.1) | 149 (80.1) | ||
| Pink collar | 406 (10.4) | 12 (17.1) | 381 (10.4) | 13 (7.0) | ||
| Job tenure | 0.237 | |||||
| ≥ 3 years | 3,597 (91.8) | 60 (85.7) | 3,369 (92.0) | 168 (90.3) | ||
| < 3 years | 320 (8.2) | 10 (14.3) | 292 (8.0) | 18 (9.7) | ||
| Employment status | 0.991 | |||||
| Full time work | 3,726 (95.1) | 66 (94.3) | 3,483 (95.1) | 177 (95.2) | ||
| Part time work | 191 (4.9) | 4 (5.7) | 178 (4.9) | 9 (4.8) | ||
| Multiple job holdings | 0.204 | |||||
| None | 3,258 (83.2) | 55 (78.6) | 3,059 (83.6) | 144 (77.4) | ||
| Same field | 273 (7.0) | 8 (11.4) | 251 (6.9) | 14 (7.5) | ||
| Different field | 386 (9.9) | 7 (10.0) | 351 (9.6) | 28 (15.1) | ||
| Working hour | 0.818 | |||||
| ≤ 30 | 654 (16.7) | 9 (12.9) | 607 (16.6) | 38 (20.4) | ||
| 31–40 | 1,959 (50.0) | 40 (57.1) | 1,834 (50.1) | 85 (45.7) | ||
| 41–52 | 1,104 (28.2) | 16 (22.9) | 1,036 (28.3) | 52 (28.0) | ||
| > 52 | 200 (5.1) | 5 (7.1) | 184 (5.0) | 11 (5.9) | ||
| Depression (PHQ-9 ≥ 5) | < 0.001 | |||||
| No | 2,242 (57.2) | 52 (74.3) | 2,127 (58.1) | 63 (33.9) | ||
| Yes | 1,675 (42.8) | 18 (25.7) | 1,534 (41.9) | 123 (66.1) | ||
| Variables | Total | Chronotype | ||||
|---|---|---|---|---|---|---|
| Morningness | Intermediate | Eveningness | ||||
| Insomnia (ISI ≥ 8) | < 0.001 | |||||
| No | 1,489 (38.0) | 42 (60.0) | 1,396 (38.1) | 51 (27.4) | ||
| Yes | 2,428 (62.0) | 28 (40.0) | 2,265 (61.9) | 135 (72.6) | ||
| PSQI | < 0.001 | |||||
| Good | 598 (15.3) | 21 (30.0) | 559 (15.3) | 18 (9.7) | ||
| Moderate | 2,120 (54.1) | 36 (51.4) | 2,001 (54.7) | 83 (44.6) | ||
| Poor | 1,199 (30.6) | 13 (18.6) | 1,101 (30.1) | 85 (45.7) | ||
| PSAS-C | 0.013 | |||||
| No (< 20) | 1,254 (32.0) | 28 (40.0) | 1,185 (32.4) | 41 (22.0) | ||
| Yes (≥ 20) | 2,663 (68.0) | 42 (60.0) | 2,476 (67.6) | 145 (78.0) | ||
| Social jetlag | < 0.001 | |||||
| Mild (< 1 hour) | 1,480 (37.8) | 43 (61.4) | 1,398 (38.2) | 39 (21.0) | ||
| Moderate (1–2 hours) | 1,539 (39.3) | 16 (22.9) | 1,464 (40.0) | 59 (31.7) | ||
| Severe (≥ 2 hours) | 898 (22.9) | 11 (15.7) | 799 (21.8) | 88 (47.3) | ||
| Chronotype | No. | Case (%) | Model 1 | Model 2a | Model 3b | |
|---|---|---|---|---|---|---|
| Total | 3,917 | 1,675 (42.8) | ||||
| Morningness | 70 | 18 (25.7) | 1.00 (Reference) | 1.00 (Reference) | 1.00 (Reference) | |
| Intermediate | 3,661 | 1,534 (41.9) | 2.08 (1.21, 3.57) | 1.40 (0.79, 2.49) | 1.47 (0.83, 2.62) | |
| Eveningness | 186 | 123 (66.1) | 5.63 (3.04, 10.43) | 2.87 (1.49, 5.54) | 3.02 (1.56, 5.84) | |
| Male | 2,088 | 815 (39.0) | ||||
| Morningness | 41 | 10 (24.4) | 1.00 (Reference) | 1.00 (Reference) | 1.00 (Reference) | |
| Intermediate | 1,956 | 750 (38.3) | 1.93 (0.94, 3.95) | 1.44 (0.67, 3.12) | 1.65 (0.75, 3.62) | |
| Eveningness | 91 | 55 (60.4) | 4.73 (2.07, 10.82) | 3.11 (1.27, 7.58) | 3.46 (1.39, 8.58) | |
| Female | 1,829 | 860 (47.0) | ||||
| Morningness | 29 | 8 (27.6) | 1.00 (Reference) | 1.00 (Reference) | 1.00 (Reference) | |
| Intermediate | 1,705 | 784 (46.0) | 2.23 (0.98, 5.07) | 1.41 (0.59, 3.35) | 1.40 (0.59, 3.36) | |
| Eveningness | 95 | 68 (71.6) | 6.61 (2.61, 16.73) | 2.85 (1.07, 7.61) | 2.77 (1.03, 7.48) | |
| Mediator variable | Percentage mediated (%, CI) | Total effect (CI) | Direct effect (CI) | Total indirect effect (CI) |
|---|---|---|---|---|
| ISI | 28.44* (16.39, 40.50) | −0.27* (−0.36, −0.18) | −0.19* (−0.28, −0.11) | −0.08* (−0.11, −0.05) |
| PSQI | 31.25* (19.36, 43.15) | −0.30* (−0.40, −0.21) | −0.21* (−0.30, −0.12) | −0.09* (−0.13, −0.06) |
| PSAS-C | 23.58* (10.66, 36.50) | −0.27* (−0.36, −0.17) | −0.20* (−0.29, −0.12) | −0.06* (−0.10, −0.03) |
| Social jetlag | 0.75 (−3.88, 5.39) | −0.25* (−0.34, −0.16) | −0.25* (−0.34, −0.16) | −0.002 (−0.01, 0.01) |
Table 1 Baseline characteristics of workers according to the chronotype
Values are presented as number of participants (%).
Total GPAQ are counted as the sum of the total MET minutes of activities at work, moving from one place to another, leisure activities.
GPAQ = Global Physical Activity Questionnaire; PHQ-9: Patient Health Questionnaire-9.
aThe results were obtained by χ2 test.
Table 2 Baseline sleep characteristics of workers according to the chronotype
Values are presented as number of participants (%).
ISI: Insomnia Severity Index; PSQI: Pittsburgh Sleep Quality Index; PSAS-C: Pre-Sleep Arousal Scale- Cognitive Score.
aThe results were obtained by χ2 test.
Table 3 Odds ratios (95% confidence interval) of chronotype for depressive symptoms among workers
The
aAdjusted by sex (total sample), age, education level, marital status, living situation, smoking status, coffee consumption, alcohol consumption, income level, physical activity; bAdjusted by sex (total sample), age, education level, marital status, living situation, smoking status, coffee consumption, alcohol consumption, income level, physical activity, and work-related variables (job category, job tenure, employment status, multiple jobholding, and working hours).
Table 4 Summary of the results from the mediation analysisa
ISI: Insomnia Severity Index; PSQI: Pittsburgh Sleep Quality Index; PSAS-C: Pre-Sleep Arousal Scale-Cognitive Score; CI: confidence interval.aAdjusted by sex, age, education level, marital status, cohabitation status, smoking status, coffee consumption, alcohol consumption, income level, physical activity, and work-related variables (job category, job tenure, employment status, multiple job holdings, and working hours).
*

