
Articles
- Page Path
- HOME > Ann Occup Environ Med > Volume 35; 2023 > Article
- Original Article Comparing Korea Occupational Safety & Health Agency and National Health Insurance Service’s cardio-cerebrovascular diseases risk-assessment tools using data from one hospital’s health checkups
-
Yunrae Cho1
 , Dong Geon Kim1, Byung-Chan Park1, Seonhee Yang1, Sang Kyu Kim2
 -
Annals of Occupational and Environmental Medicine 2023;35:e35.
DOI: https://doi.org/10.35371/aoem.2023.35.e35
Published online: August 21, 2023
1Department of Occupational and Environmental Medicine, Dongguk University Gyeongju Hospital, Gyeongju, Korea.
2Department of Preventive Medicine, Dongguk University College of Medicine, Gyeongju, Korea.
- Correspondence: Sang Kyu Kim. Department of Preventive Medicine, Dongguk University College of Medicine, 123 Dongdae-ro, Gyeongju 38066, Korea. dunggly@dongguk.ac.kr
• Received: January 25, 2023 • Revised: April 19, 2023 • Accepted: May 25, 2023
Copyright © 2023 Korean Society of Occupational & Environmental Medicine
This is an Open Access article distributed under the terms of the Creative Commons Attribution Non-Commercial License (https://creativecommons.org/licenses/by-nc/4.0/) which permits unrestricted non-commercial use, distribution, and reproduction in any medium, provided the original work is properly cited.
Abstract
-
Background Cardio-cerebrovascular diseases (CVDs) are the most common cause of death worldwide. Various CVD risk assessment tools have been developed. In South Korea, the Korea Occupational Safety & Health Agency (KOSHA) and the National Health Insurance Service (NHIS) have provided CVD risk assessments with health checkups. Since 2018, the KOSHA guide has stated that NHIS CVD risk assessment tool could be used as an alternative of KOSHA assessment tool for evaluating CVD risk of workers. The objective of this study was to determine the correlation and agreement between the KOSHA and the NHIS CVD risk assessment tools.
-
Methods Subjects of this study were 17,485 examinees aged 20 to 64 years who had undergone medical examinations from January 2021 to December 2021 at a general hospital. We classified subjects into low-risk, moderate-risk, high-risk, and highest-risk groups according to KOSHA and NHIS’s CVD risk assessment tools. We then compared them with cross-analysis, Spearman correlation analysis, and linearly weighted kappa coefficient.
-
Results The correlation between KOSHA and NHIS tools was statistically significant (p-value < 0.001), with a correlation coefficient of 0.403 and a kappa coefficient of 0.203. When we compared risk group distribution using KOSHA and NHIS tools, CVD risk of 6,498 (37.1%) participants showed a concordance. Compared to the NHIS tool, the KOSHA tool classified 9,908 (56.7%) participants into a lower risk category and 1,079 (6.2%) participants into a higher risk category.
-
Conclusions In this study, KOSHA and NHIS tools showed a moderate correlation with a fair agreement. The NHIS tool showed a tendency to classify participants to higher CVD risk group than the KOSHA tool. To prevent CVD more effectively, a higher estimation tool among verified CVD risk assessment methods should be selected and managements such as early intervention and treatment of risk factors should be performed targeting the high-risk group.
BACKGROUND
According to the World Health Organization, cardio-cerebrovascular diseases (CVDs) are the leading cause of death worldwide, accounting for 27% of all deaths in 2019.1 Although mortality of CVDs in high-income countries has begun to decline, it is rapidly increasing in low- and middle-income countries. In South Korea, CVDs are the second most common cause of death after cancer, accounting for 17.8%.2 Medical and socioeconomic costs of CVDs continue to increase. In addition, CVDs are a group of diseases that occur frequently in the elderly. Since the proportion of elderly people continues to increase from 10.8% in 2010 to 17.5% in 2022, the social burden of an aging population is expected to increase continuously.3,4
Health risk assessments (HRAs) evaluate the risk of future disease occurrence and death by checking health risk factors. This method can reduce a subject’s health risk factors and improve compliance by providing information such as correction goals and methods.5 Several CVD risk prediction models have been developed worldwide, such as the Framingham risk score and the Systemic Coronary Risk Evaluation system.6,7 Various predictive HRA models have also been developed in South Korea, such as CVD risk assessment provided by the Korea Occupational Safety & Health Agency (KOSHA) and the National Health Insurance Service (NHIS).
Since 2004, KOSHA has published guidelines for risk assessment and follow-up management (hereinafter referred to as “the KOSHA guide”) for the prevention of work-related CVD in workers. With reference to the World Health Organization and the International Society of Hypertension (2003),8 the KOSHA guide provides risk stratification chart to classify risk groups. The purpose of classification is to manage chronic diseases such as hypertension, diabetes, and dyslipidemia in high-risk workers in the workplace by simply and quickly evaluating their risk of CVD. Employers are required to provide workers with follow-up management such as basic disease management, lifestyle improvement guidance, and health education and work environment management based on their CVD risk assessments.9
Since 2009, the NHIS has been providing HRA information along with the results of health checkups. Revisions were made in 2018 based on Korean long-term follow-up data. The purpose of NHIS is to detect chronic diseases early, provide health information to the general population, and correct lifestyle habits to reduce the risk of CVD. The NHIS uses Robbins method constructing a predictive model for CVD by collecting risk levels for each risk factor from existing validated research. The absolute risk, which is an index indicating the actual probability that the examinee will develop CVD within the next ten years, is calculated and expressed as a percentage (%) (Table 1).10
Table 1
Comparison of the KOSHA and the NHIS risk assessment tools
Since 2018, the KOSHA guide has stated that NHIS CVD risk assessment tool can be used as an alternative to the KOSHA assessment tool for evaluating CVD risk group of workers. Previous studies have confirmed the usefulness of these risk assessment tools using gold standard such as the Framingham risk score.11,12,13 However, there has been no study directly comparing KOSHA and NHIS risk assessment tools. As both tools are widely used in health checkup, the present study aimed to compare the 2 tools and investigate their characteristics. These 2 tools have different development purposes and methods. They show slight differences in their target applications. Thus, active research is needed to analyze their correlation and agreement. If these tools significantly differ in estimating CVD risk, it can lead to confusion and uncertainty about the patient’s risk level and post-management.
Thus, the purpose of this study was to confirm the correlation and agreement between KOSHA and NHIS CVD risk assessments for examinees undergoing a health checkup at a general hospital and to provide basic data for assessing and managing CVD risks among workers.
METHODS
This study was conducted on examinees who had undergone a health checkup from January 2021 to December 2021 at a general hospital in Gyeongju, South Korea. Of a total of 30,182 examinees, 4,799 with duplicate or missing results were excluded. Since the KOSHA guide only targets workers, we set the age limit to 20–64 years considering the general retirement age. To apply the KOSHA guide, 5,969 patients who had not had a blood lipid test within the last 4 years were excluded. The number of subjects included in the final analysis was 17,485 (Fig. 1).

Based on results of the health checkup of study subjects, obesity, blood lipid test, fasting blood glucose (FBG), blood pressure, and kidney function tests known to be risk factors for CVD were confirmed. Variables were measured according to standards for health checkup set by the Ministry of Health and Welfare. Height and weight were measured to calculate body mass index (BMI). Obesity was determined as either BMI ≥ 25 kg/m2 or waist circumference > 90 cm (males) or 85 cm (females). Blood pressure was measured after resting for at least 5 minutes. If it exceeded the normal range, it was measured again after a 2-minute interval. Blood lipid test and FBG were conducted by confirming fasting status of the examinee through venous blood sampling. The renal function test calculated estimate glomerular filtration rate (eGFR) according to the 4-variable Modification of Diet in Renal Disease equation based on age, gender, race, and serum creatinine level.14 Lifestyle habits (such as smoking and exercise) and past history (such as hypertension, diabetes, and CVDs) were confirmed using doctor questionnaires obtained during checkups.
KOSHA’s risk-assessment tool for CVDs (KOSHA tool)
The KOSHA tool we used was based on the “KOSHA GUIDE H-200-2018” published in 2018.9 The KOSHA tool uses categorical method based on blood pressure, number of risk factors, and comorbidities (Table 2). Risk factors include age, smoking, obesity, FBG, and lipid blood test results. The KOSHA guide states that if there are no lipid blood test results, previous test results can be used. We also used lipid blood test results taken within 4 years to calculate risk factors.
Table 2
Risk stratification chart of the Korea Occupational Safety & Health Agency tool
BP: blood pressure; CVD: cardio-cerebrovascular disease.
aRisk factors: age (male ≥ 45, female ≥ 55), family history of early CVD (male < 55, female < 65), current smoking status, obesity (body mass index ≥ 25, waist circumference ≥ 90 cm [male] or 85 cm [female]), prediabetes (fasting blood sugar 100–125 mg/dL, 2-hour post-prandial blood sugar 140–199 mg/dL or HbA1c 5.7%–6.4%), total cholesterol ≥ 220 mg/dL or low density lipoprotein cholesterol ≥ 150 mg/dL or triglyceride ≥ 200 mg/dL, high density lipoprotein cholesterol (< 40 mg/dL for risk factor, ≥ 60 mg/dL for risk-reducing factor).
Those who were already receiving diabetes treatment and those who had a FBG of 126 mg/dL or higher were considered to have diabetes. When examinees had a positive proteinuria (urine stick test 1+ or higher), high blood pressure of 180/110 mmHg or higher, or total cholesterol of 310 mg/dL or higher, diabetic target organ damage was considered. Hypertensive organ damage was defined as either positive proteinuria or left ventricular hypertrophy (cardiac hypertrophy on chest radiography). Chronic kidney disease stages were stage 4 for eGFR less than 30 mL/min/1.73 m2 and stage 3 for eGFR less than 60 mL/min/1.73 m2.
Based on this, we classified CVD risk levels into low-risk group, moderate-risk group, high-risk group, and highest-risk group. The KOSHA guide does not have evaluation criteria for normotensive groups (blood pressure less than 130/80 mmHg). Thus, this group was classified as having a low risk.
NHIS’s risk-assessment tool for CVDs (NHIS tool)
The NHIS tool was used based on the 2018 revised guidelines.10 For CVD risk assessments, the NHIS tool uses relative risks of risk factors and the 10-year mean absolute risk according to gender and age. Risk factors provided by these guidelines included obesity, smoking, blood pressure, hypertension medication, physical activity, FBG, diabetes medication, total cholesterol, eGFR, or urine stick test proteinuria. We calculated the absolute risk of CVDs over a ten-year period for each subject as a percentage (%). According to the KOSHA guide,9 the absolute risk was classified as being in the low-risk group (less than 1%), moderate-risk group (1% or more and less than 5%), high-risk group (5% or more and less than 10%), and highest-risk group (10% or more).
We performed frequency analysis for gender, age, smoking status, physical activity, obesity, blood lipid test, blood pressure, kidney function, history of hypertension, diabetes, and CVDs. We compared risk groups according to KOSHA and NHIS tools with cross-analysis, Spearman correlation analysis, and linearly weighted kappa coefficient. Age classification used in the analysis was based on the age risk factor for men and women in the KOSHA guide (45 and 55 years old, respectively).9 Concordance between KOSHA and NHIS tools was calculated. For different risk groups, we used the term ‘high-estimate’ for classifying subjects to a higher risk group. If CVD risk was classified to a higher risk group by the KOSHA tool, we described it as high-estimated by the KOSHA tool. For all statistical analyses, SPSS version 26.0 program was used. The statistical significance level was set at p-value < 0.05.
This study was exempt from the ethical approval by the Institutional Review Board (IRB) of Dongguk University Gyeongju Hospital (IRB No. 110757-202211-HR-04-02).
RESULTS
Regarding the gender of subjects, there were 13,865 (79.3%) men and 3,620 (20.7%) women. In particular, there were very few women (only 322 were under the age of 40). We excluded most of the women under the age of 40 from this study because they had not received a blood lipid test during a health checkup. Among CVD risk factors, smoking, obesity, hypertension, diabetes, and proteinuria were higher in men. The proportion of current smokers was 37.0% in men and 2.1% in women, showing a significant difference according to gender. Obesity also differed significantly between genders, with 51.5% being men and 30.1% being women. Men and women with total cholesterol values of 240 or higher accounted for 10.2% and 13.3%, respectively. There was no significant difference in physical activity, eGFR, or history of CVD between genders (Table 3).
Table 3
General characteristics of the study population
The correlation and agreement between the KOSHA tool and the NHIS tool were statistically significant (p-value < 0.001). The correlation coefficient was 0.403 and the kappa coefficient was 0.203, showing a moderate correlation and a fair agreement. When subjects were divided into age and gender subgroups, the KOSHA tool and the NHIS tool showed a weak correlation with a correlation coefficient of 0.330 for men under 45. Their correlation coefficient was 0.479 for those aged 45–54 and 0.446 for those aged over 55, showing moderate correlations. Regarding agreement between the 2 tools, the agreement was fair with a kappa coefficient of 0.248 for men under 45. Their kappa coefficient was 0.153 for those aged 45–54 and 0.039 for those over 55, showing slight agreements. In the case of women, weak correlations were found for those aged under 45 years and for those aged 45–54 years, with correlation coefficient of 0.278 and 0.258. Women aged over 55 showed a moderate correlation with correlation coefficient of 0.442. For agreement between the 2 tools, there were slight agreements for women with all age subgroups. The kappa coefficient was 0.151 for women under 45 years, 0.023 for women aged 45–54, and 0.085 for women aged over 55 (Table 4).
Table 4
Correlation and agreement between the 2 tools
With the KOSHA tool, the low-risk group, including the normotensive group, had the highest number at 11,693 (66.9%), followed by the moderate-risk group at 4,116 (23.5%), the high-risk group at 1,357 (7.8%), and the highest-risk group at 319 (1.8%). With the NHIS tool, the moderate-risk group was the most common one at 9,402 (53.8%), followed by the low-risk group at 3,933 (22.5%), the high-risk group at 3,376 (19.3%), and the highest-risk group at 774 (4.4%). When we compared KOSHA and NHIS tools’ risk distribution results, the CVD risk showed a concordance for 6,498 (37.1%) participants. The KOSHA tool high-estimated the CVD risk for 1,079 (6.2%) participants and the NHIS tool high-estimated the CVD risk for 9,908 (56.7%) participants. When classified by age, 4,835 (57.7%) of those under the age of 45 showed a concordance. The KOSHA tool high-estimated 752 (9.0%) and the NHIS tool high-estimated 2,786 (33.3%). In the 45-54 age group, 1,305 (24.7%) showed a concordance. The KOSHA tool high-estimate 247 (4.7%) and the NHIS tool high-estimated 3,734 (70.8%). For those over 55 years of age, 358 (9.4%) showed a concordance. The KOSHA tool high-estimated 80 (2.1%) and the NHIS tool high-estimated 3,388 (88.5%) (Table 5).
Table 5
Concordance of risk groups with the 2 tools
Values are presented as numbers (%). Concordance occurred in 6,498 (37.1%). The KOSHA tool high-estimated 1,079 (6.2%) and the NHIS tool high-estimated 9,908 (56.7%). For those aged < 45 years, concordance occurred in 4,835 (57.7%). The KOSHA tool high-estimated 752 (9.0%) and the NHIS tool high-estimated 2,786 (33.3%). For those aged 45–54 years, concordance occurred in 1,305 (24.7%). The KOSHA tool high-estimated 247 (4.7%) and the NHIS tool high-estimated 3,734 (70.6%). For those aged ≥ 55 years, concordance occurred in 358 (9.4%). The KOSHA tool high-estimated 80 (2.1%) and the NHIS tool high-estimated 3,388 (88.5%).
KOSHA: Korea Occupational Safety & Health Agency; NHIS: National Health Insurance Service.
aConcordances of risk groups with the 2 tools are highlighted.
DISCUSSION
This study evaluated the CVD risk based on health checkup data obtained at a general hospital according to the KOSHA guide. It analyzed correlation and agreement between the KOSHA tool and the NHIS risk assessment tool. The KOSHA tool and the NHIS tool showed a moderate correlation with a correlation coefficient of 0.403 and a fair agreement with a kappa coefficient of 0.203 (Table 4). If only one of the 2 tools is used, it is necessary to know characteristics of each tool. It is also important to consider personal characteristics such as age and comorbidities to reduce confusion depending on the tool used.
When we compared risk-group distribution results between the 2 tools, the NHIS tool was heavily affected by age. There was none in the highest-risk group for those under the age of 45 and none in low-risk group for those over the age of 55 (Table 5). This appears to be due to the NHIS’s risk calculation method that utilizes the average 10-year risk based on age. Predicting such 10-year CVD risk is a current practice for patients without CVD or diabetes. However, since age is the most important predictor, the risk for younger examinees with a high relative risk can be overlooked.15,16
In the case of the KOSHA tool, although age is included as a risk factor, there are more important predictors such as blood pressure and comorbidities. Three participants were classified as the highest-risk group by the KOSHA tool but as the low-risk group by the NHIS tool. These individuals were all under 45 years old with a history of CVD. They were identified as high risk by the KOSHA tool but could have been overlooked by the NHIS tool.
Furthermore, when examining the number of participants high-estimated by each tool, the NHIS tool generally showed a tendency to high-estimate the CVD risk group. The difference became more prominent as age increased. Among those aged 55 or older, the NHIS tool high-estimated 3,388 (88.5%) participants while the KOSHA tool high-estimated only 80 (2.1%) participants (Table 5). A previous Korean study showed that the risk of developing CVD might have been underestimated when applying the KOSHA tool to the elderly. In a study of 1,781 male steel workers, Um et al.11 have found that the KOSHA tool underestimates risks for the elderly aged over 55 years without having hypertension in comparison with the Framingham risk score.
Since the 2 tools have their own characteristics and pros and cons, it cannot be said that one is better than the other. In a previous study comparing the 2 tools with the Framingham risk score among 4,460 male shipyard workers, the KOSHA tool showed more correlation while the NHIS tool showed more agreement.12 Similar trends were observed when we compared the 2 tools with the Framingham risk score in our study subjects. When both tools are available, the KOSHA guide recommends using the higher risk group between the 2 tools as these tools are intended for screening purposes rather than performing accurate risk assessment and treatment in clinical settings. Recent trends of hypertension in the society suggest that diagnostic criteria for hypertension are becoming more lenient in order to start blood pressure management earlier and prevent the onset of CVD.17,18 In this trend, if only one of the 2 tools is to be used, it will be advantageous to use the one that high-estimates the CVD risk group. As the NHIS tool tends to high-estimate the risk prominently in those aged over 45 years old, using the NHIS tool will be advantageous. On the other hand, using the KOSHA tool to identify individuals with relatively high risk will be advantageous for those under 45 years old.
In the aspect of occupational health, CVD risk categorization for workers plays an important role in promoting their health and work efficiency. According to a study of 6,047 male employees in 4 pharmaceutical companies in Japan, as the CVD risk group became higher, the incidence of absenteeism and presenteeism also significantly increased.19 Higher risk of CVD might lead to loss of work hours and reduced job performance, which could be corrected through proper treatment and lifestyle changes. There is also a socioeconomic cost associated with CVD. The medical cost of CVD in South Korea in 2020 was approximately 6.4 trillion won. When non-healthcare costs such as loss of productivity and informal care are included, the total cost is expected to be even higher.4,20 By conducting CVD risk assessment for workers, raising their awareness, and motivating them to manage their risk factors, significant cost savings can be achieved both personally and socially.
Some considerations are needed when applying the 2 tools in practice. Blood pressure measured during the health checkup is also called office blood pressure (OBP). However, blood pressure may fluctuate depending on the environment or circadian rhythm. In the case of white coat hypertension, which shows a temporary increase in blood pressure in a medical environment, an incorrect diagnosis may cause side effects because of unnecessary drug treatment.21 In addition, studies have reported that masked hypertension, which is usually high but temporarily normal in a medical environment, presents a greater CVD risk than white coat hypertension. Thus, thorough drug treatment must be considered.22 To prevent such issues, the Korean Society of Hypertension recommends measuring home blood pressure (HBP) in addition to OBP.23 By using HBP appropriately, white coat hypertension and masked hypertension can be checked. It can lead to promotion of examinee’s health.
Since 2018, dyslipidemia screening periods have changed from 2 years to 4 years in the health checkup system. This is implemented for men over the age of 24 and women over the age of 40. One study has performed cost-effectiveness analysis and concluded that the current 2-year screening is inefficient and that a 4-year screening is reasonable.24,25 As a result, most of young women under the age of 40 were excluded from our study. The NHIS allows for risk assessment without cholesterol testing. According to an improvement report of the NHIS HRA, the inclusion or exclusion of cholesterol did not show a significant difference in predictive power.10 Further study is needed to determine whether excluding cholesterol from calculations will have any impact on risk group categorization.
This study has several limitations. First, it performed evaluation using health checkup data. The effect of healthy workers cannot be excluded. In addition, we excluded most men under the age of 24 and women under the age of 40 who had not received blood lipid testing in their general checkups from this evaluation, which might have led to a selection bias. Second, examinee’s subjective disposition might have been involved in the investigation of past medical history and lifestyle because we used self-report questionnaires. Third, it was a retrospective study without control over examination results. Although fasting status was confirmed in most cases, in the case of not fasting due to personal circumstances, it can lead to an overestimation of CVD risk. Fourth, this study was conducted in a single hospital of a specific region. Therefore, socio-demographic characteristics of the region might have been reflected. Thus, there are limitations to generalizing results of this study. A further collaborative study across multiple hospitals in various regions is needed to confirm findings of this study.
CONCLUSIONS
In this study, we compared 2 HRAs provided by KOSHA and NHIS for CVD. These 2 HRAs showed a moderate correlation and a fair agreement. The NHIS tool was found to high-estimate subjects’ CVD risk than the KOSHA tool. This tended to increase with increasing age. The risk of the NHIS tool was significantly affected by age. The risk for younger examinees with a high relative risk can be overlooked. Thus, careful selection of these 2 tools is necessary depending on characteristics of subjects.
Abbreviations
BMI
body mass index
BP
blood pressure
CVD
cardio-cerebrovascular disease
eGFR
estimate glomerular filtration rate
FBG
fasting blood glucose
HBP
home blood pressure
HRA
health risk assessment
IRB
Institutional Review Board
KOSHA
Korea Occupational Safety & Health Agency
NHIS
National Health Insurance Service
OBP
office blood pressure
-
Funding: This work was supported by the Dongguk University Research Fund, 2019.
-
Competing interests: The authors declare that they have no competing interests.
-
Authors contributions:
Conceptualization: Kim SK.
Data curation: Yang S, Park BC.
Formal analysis: Yang S, Park BC.
Funding acquisition: Kim SK.
Investigation: Cho Y, Kim DG.
Methodology: Kim SK, Park BC.
Software: Cho Y, Kim SK.
Validation: Yang S, Park BC.
Visualization: Cho Y, Kim SK.
Writing - original draft: Cho Y, Kim DG.
Writing - review & editing: Cho Y, Kim SK.
NOTES
- 1. World Health Organization. The top 10 causes of death. Updated 2020]. Accessed September 7, 2022]. https://www.who.int/news-room/fact-sheets/detail/the-top-10-causes-of-death .
- 2. Korean Statistical Information Service. Cause of death statistics. Updated 2021]. Accessed September 7, 2022]. https://kosis.kr/index/index.do .
- 3. Statistics Korea. 2022 Elderly Statistics. Daejeon, Korea: Statistics Korea; 2022.
- 4. Health Insurance Review and Assessment Service (KR). National Health Insurance Service (KR). 2020 National Health Insurance Statistical Yearbook. Wonju, Korea: National Health Insurance Service; 2020.
- 5. Hwang IS, Kim EY, Lee KH, Cho BL. Improvement of the health risk appraisal model and report form of the national health screening program. Public Health Wkly Rep 2018;11(14):433–437.
- 6. Kannel WB, McGee D, Gordon T. A general cardiovascular risk profile: the Framingham Study. Am J Cardiol 1976;38(1):46–51. 132862.ArticlePubMed
- 7. Yun JM, Yoo TG, Oh SW, Cho BL, Kim E, Hwang I. Prediction of cardiovascular disease in Korean population: based on health risk appraisal of national health screening program. J Korean Med Assoc 2017;60(9):746–752.ArticlePDF
- 8. Whitworth JA. World Health Organization, International Society of Hypertension Writing Group. 2003 World Health Organization (WHO)/International Society of Hypertension (ISH) statement on management of hypertension. J Hypertens 2003;21(11):1983–1992. 14597836.ArticlePubMed
- 9. Korea Occupational Safety and Health Agency. Risk Assessment for the Prevention of Cardio-Cerebrovascular Disease at Workplace (KOSHA Code H-200-2018). Ulsan, Korea: Korea Occupational Safety and Health Agency; 2018.
- 10. Korea Centers for Disease Control and Prevention. Improvement of Health Risk Appraisal (HRA). Cheongju, Korea: Korea Centers for Disease Control and Prevention; 2017.
- 11. Um IY, Choi WJ, Lee D, Oh JS, Yi MK, Yoon JW, et al. Risk assessment for cardiovascular diseases in male workers: comparing KOSHA guidelines and the Framingham risk score system. Korean J Occup Environ Med 2012;24(4):365–374.ArticlePDF
- 12. Ha JC, Son JS, Kim YO, Chae CH, Kim CW, Park HO, et al. Comparison of risk-assessment tools for cardio-cerebrovascular diseases (CVD) in male shipyard workers: a cross-sectional study. Ann Occup Environ Med 2019;31(1):e4. 31543965.ArticlePubMedPMCPDF
- 13. Yi KJ, Heo HT, Kim DW, Kim IA, Kim SY, Rho JR, et al. A comparison of KOSHA’s cardiovascular disease risk assessment and the predicted 10-year risk of cardiovascular disease developed by Jee for a male workers at a wallpaper and floor covering manufacturer. Korean J Occup Environ Med 2009;21(2):174–183.ArticlePDF
- 14. Levey AS, Greene T, Kusek JW, Beck GJ. A simplified equation to predict glomerular filtration rate from serum creatinine. J Am Soc Nephrol 2000;11:155A.
- 15. Piepoli MF, Hoes AW, Agewall S, Albus C, Brotons C, Catapano AL, et al. 2016 European guidelines on cardiovascular disease prevention in clinical practice: the sixth joint task force of the European Society of Cardiology and other societies on cardiovascular disease prevention in clinical practice (constituted by representatives of 10 societies and by invited experts): developed with the special contribution of the European Association for Cardiovascular Prevention & Rehabilitation (EACPR). Eur Heart J 2016;37(29):2315–2381. 27222591.PubMedPMC
- 16. Yang J, Biery DW, Singh A, Divakaran S, DeFilippis EM, Wu WY, et al. Risk factors and outcomes of very young adults who experience myocardial infarction: the partners YOUNG-MI registry. Am J Med 2020;133(5):605–612.e1. 31715169.ArticlePubMedPMC
- 17. James PA, Oparil S, Carter BL, Cushman WC, Dennison-Himmelfarb C, Handler J, et al. 2014 evidence-based guideline for the management of high blood pressure in adults: report from the panel members appointed to the Eighth Joint National Committee. JAMA 2014;311(5):507–520. 24352797.ArticlePubMed
- 18. Guirguis-Blake JM, Evans CV, Webber EM, Coppola EL, Perdue LA, Weyrich MS. Screening for hypertension in adults: updated evidence report and systematic review for the US preventive services task force. JAMA 2021;325(16):1657–1669. 33904862.ArticlePubMed
- 19. Kimura K, Nagata T, Ohtani M, Nagata M, Kajiki S, Fujino Y, et al. Cardiovascular and cerebrovascular diseases risk associated with the incidence of presenteeism and the costs of presenteeism. J Occup Health 2020;62(1):e12167. 32951282.ArticlePubMedPMCPDF
- 20. Luengo-Fernández R, Leal J, Gray A, Petersen S, Rayner M. Cost of cardiovascular diseases in the United Kingdom. Heart 2006;92(10):1384–1389. 16702172.ArticlePubMedPMC
- 21. Shin J, Park SH, Kim JH, Ihm SH, Kim KI, Kim WS, et al. Discordance between ambulatory versus clinic blood pressure according to global cardiovascular risk group. Korean J Intern Med 2015;30(5):610–619. 26354055.ArticlePubMedPMCPDF
- 22. Stergiou GS, Asayama K, Thijs L, Kollias A, Niiranen TJ, Hozawa A, et al. Prognosis of white-coat and masked hypertension: International Database of Home blood pressure in relation to Cardiovascular Outcome. Hypertension 2014;63(4):675–682. 24420553.ArticlePubMed
- 23. Korean Society of Hypertension. 2018 Korean Society of Hypertension Guidelines for the Management of Hypertension. Seoul, Korea: Korean Society of Hypertension; 2018.
- 24. Cho BL. Evaluation of the Validity of Current National Health Screening Program and Plan to Improve the System. Seoul, Korea: Seoul National University College of Medicine; 2013.
- 25. Park S, Park EC, Nam JM, Lee SH, Kim TH, Lee GS, et al. Cost-Effectiveness Analysis for National Lipid Disorders Screening Program. Cheongju, Korea: Korea Disease Control and Prevention Agency; 2014.
REFERENCES
REFERENCES
Figure & Data
REFERENCES
Citations
Citations to this article as recorded by 
- Association Between Food Insecurity and Poor Cardiovascular Health Assessed by the Life’s Essential 8 Metric: A Population-Based Study of Korean Adults
Seong-Uk Baek, Jin-Ha Yoon
Nutrients.2025; 17(13): 2148. CrossRef
 Cite
CiteComparing Korea Occupational Safety & Health Agency and National Health Insurance Service’s cardio-cerebrovascular diseases risk-assessment tools using data from one hospital’s health checkups
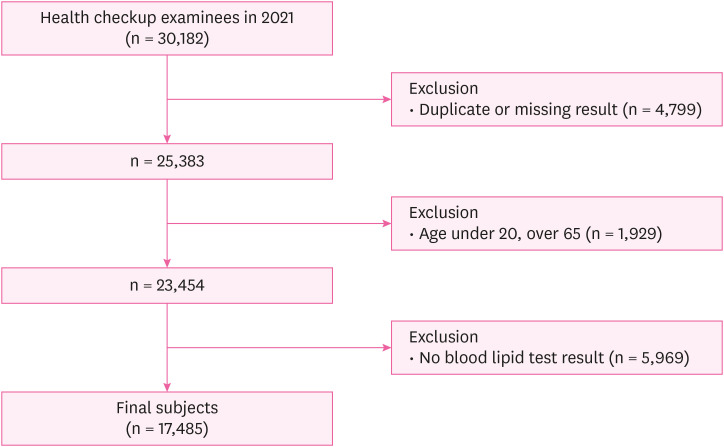
Fig. 1 Flow chart showing the selection of study subjects.
Fig. 1
Comparing Korea Occupational Safety & Health Agency and National Health Insurance Service’s cardio-cerebrovascular diseases risk-assessment tools using data from one hospital’s health checkups
| Variables | KOSHA risk assessment tool | NHIS risk assessment tool |
|---|---|---|
| Statistical methods | Categorical method | Robbins method |
| Purpose | Use in workplace by health manager to prevent CVD | Inform the general population to prevent CVD |
| Risk assessment result | Four risk groups (low-highest) | Ten years absolute risk (%) |
| Key variables | Blood pressure, risk factors (age, gender, family history of early CVD, smoking, obesity, FBG, lipid blood test), comorbidity (diabetes, target organ damage, chronic kidney disease, CVD history) | Age, gender, blood pressure, smoking, obesity, physical activity, hypertension medication, FBG, diabetes medication, total cholesterol, eGFR or proteinuria |
| Advantage | Easily applicable in workplace | Show intuitive result like blood vessel age and risk after lifestyle correction |
| Number of risk factorsa and comorbidities | Level of blood pressure | ||
|---|---|---|---|
| Systolic BP 130–139 or diastolic BP 80–89 | Systolic BP 140–159 or diastolic BP 90–99 | Systolic BP ≥ 160 or diastolic BP ≥ 100 | |
| Risk factors: 0 | Low-risk | Low-risk | Moderate-risk |
| Risk factors: 1–2 | Low-risk | Moderate-risk | Moderate-risk |
| Risk factors ≥ 3 | Moderate-risk | Moderate-risk | High-risk |
| Diabetes without target organ damage, chronic kidney disease (stage 3), hypertensive organ damage | High-risk | High-risk | Highest-risk |
| Diabetes with target organ damage, chronic kidney disease (stage 4), CVD with symptoms | Highest-risk | Highest-risk | Highest-risk |
| Variables | Men | Women | Total | ||
|---|---|---|---|---|---|
| Age (years) | < 0.001 | ||||
| 20–29 | 1,486 (10.7) | 203 (5.6) | 1,689 (9.7) | ||
| 30–39 | 3,912 (28.2) | 119 (3.3) | 4,031 (23.0) | ||
| 40–49 | 3,949 (28.5) | 1,202 (33.2) | 5,151 (29.5) | ||
| 50–59 | 3,522 (25.4) | 1,506 (41.6) | 5,028 (28.7) | ||
| 60–64 | 996 (7.2) | 590 (16.3) | 1,586 (9.1) | ||
| Smoking | < 0.001 | ||||
| Non-smoker | 4,694 (33.9) | 3,516 (97.1) | 8,210 (47.0) | ||
| Past smoker | 4,034 (29.1) | 27 (0.8) | 4,061 (23.2) | ||
| Current smoker | 5,137 (37.0) | 77 (2.1) | 5,214 (29.8) | ||
| Physical activity | 0.227 | ||||
| Sufficient | 6,947 (50.1) | 1,773 (49.0) | 8,720 (49.9) | ||
| Insufficient | 6,918 (49.9) | 1,847 (51.0) | 8,765 (50.1) | ||
| Obesity (BMI, waist circumference) | < 0.001 | ||||
| Not obese | 6,719 (48.5) | 2,531 (69.9) | 9,250 (52.9) | ||
| Obese | 7,146 (51.5) | 1,089 (30.1) | 8,235 (47.1) | ||
| Total cholesterol (mg/dL) | < 0.001 | ||||
| < 200 | 7,960 (57.4) | 1,933 (53.4) | 9,893 (56.6) | ||
| 200–239 | 4,490 (32.4) | 1,206 (33.3) | 5,696 (32.6) | ||
| ≥ 240 | 1,415 (10.2) | 481 (13.3) | 1,896 (10.8) | ||
| Blood pressure (mmHg) | < 0.001 | ||||
| Normotensive | 4,584 (33.1) | 2,003 (55.3) | 6,587 (37.7) | ||
| Pre-hypertension | 6,671 (48.0) | 1,244 (34.4) | 7,915 (45.2) | ||
| Stage 1 hypertension | 2,186 (15.8) | 330 (9.1) | 2,516 (14.4) | ||
| Stage 2 hypertension | 424 (3.1) | 43 (1.2) | 467 (2.7) | ||
| Hypertension medication | 0.032 | ||||
| No | 12,028 (86.8) | 3,189 (88.1) | 15,217 (87.0) | ||
| Yes | 1,837 (13.2) | 431 (11.9) | 2,268 (13.0) | ||
| Diabetes medication | 0.008 | ||||
| No | 13,162 (94.9) | 3,475 (96.0) | 16,637 (95.2) | ||
| Yes | 703 (5.1) | 145 (4.0) | 848 (4.8) | ||
| eGFR (mL/min/1.73 m2) | 0.209 | ||||
| ≥ 60 | 13,787 (99.4) | 3,608 (99.6) | 17,395 (99.4) | ||
| ≥ 30 and < 60 | 68 (0.5) | 11 (0.3) | 79 (0.5) | ||
| < 30 | 10 (0.1) | 1 (0.1) | 11 (0.1) | ||
| Proteinuria | < 0.001 | ||||
| None/trace | 13,595 (98.1) | 3,585 (99.0) | 17,180 (98.3) | ||
| > 1+ | 270 (1.9) | 35 (1.0) | 305 (1.7) | ||
| CVDs history | 0.437 | ||||
| No | 13,657 (98.5) | 3,572 (98.7) | 17,229 (98.5) | ||
| Yes | 208 (1.5) | 48 (1.3) | 256 (1.5) | ||
| Total | 17,485 | ||||
| Age (years) | Variables | Men | Women | Total |
|---|---|---|---|---|
| < 45 | Correlation coefficient | 0.330 | 0.278 | 0.337 |
| Kappa coefficient | 0.248 | 0.151 | 0.253 | |
| Numbers | 7,512 | 861 | 8,373 | |
| 45–54 | Correlation coefficient | 0.479 | 0.258 | 0.519 |
| Kappa coefficient | 0.153 | 0.023 | 0.133 | |
| Numbers | 3,791 | 1,495 | 5,286 | |
| ≥ 55 | Correlation coefficient | 0.446 | 0.442 | 0.477 |
| Kappa coefficient | 0.039 | 0.085 | 0.064 | |
| Numbers | 2,562 | 1,264 | 3,826 | |
| Total | Correlation coefficient | 0.409 | 0.391 | 0.403 |
| Kappa coefficient | 0.231 | 0.112 | 0.203 | |
| Numbers | 13,865 | 3,620 | 17,485 |
| NHIS | KOSHA | |||||
|---|---|---|---|---|---|---|
| Low | Moderate | High | Highest | Total | ||
| Low | 3,565 (20.4)a | 327 (1.9) | 38 (0.2) | 3 (0.0) | 3,933 (22.5) | |
| < 45 | 3,518 (20.1) | 327 (1.9) | 38 (0.2) | 3 (0.0) | 3,886 (22.2) | |
| 45–54 | 47 (0.3) | 0 | 0 | 0 | 47 (0.3) | |
| ≥ 55 | 0 | 0 | 0 | 0 | 0 | |
| Moderate | 6,530 (37.3) | 2,291 (13.2)a | 491 (2.8) | 90 (0.5) | 9,402 (53.8) | |
| < 45 | 2,782 (15.9) | 1,303 (7.5) | 328 (1.9) | 47 (0.3) | 4,460 (25.6) | |
| 45–54 | 2,889 (16.5) | 909 (5.2) | 140 (0.8) | 35 (0.2) | 3,973 (22.7) | |
| ≥ 55 | 859 (4.9) | 79 (0.5) | 23 (0.1) | 8 (0.0) | 969 (5.5) | |
| High | 1,443 (8.3) | 1,257 (7.1) | 546 (3.1)a | 130 (0.8) | 3,376 (19.3) | |
| < 45 | 2 (0.0) | 2 (0.0) | 14 (0.1) | 9 (0.1) | 27 (0.2) | |
| 45–54 | 227 (1.3) | 601 (3.4) | 331 (1.9) | 72 (0.4) | 1,231 (7.0) | |
| ≥ 55 | 1,214 (7.0) | 654 (3.7) | 201 (1.1) | 49 (0.3) | 2,118 (12.1) | |
| Highest | 155 (0.9) | 241 (1.4) | 282 (1.6) | 96 (0.5)a | 774 (4.4) | |
| < 45 | 0 | 0 | 0 | 0 | 0 | |
| 45–54 | 0 | 1 (0.0) | 16 (0.1) | 18 (0.1) | 35 (0.2) | |
| ≥ 55 | 155 (0.9) | 240 (1.4) | 266 (1.5) | 78 (0.4) | 739 (4.2) | |
| Total | 11,693 (66.9) | 4,116 (23.5) | 1,357 (7.8) | 319 (1.8) | 17,485 (100.0) | |
Table 1 Comparison of the KOSHA and the NHIS risk assessment tools
KOSHA: Korea Occupational Safety & Health Agency; NHIS: National Health Insurance Service; CVD: cardio-cerebrovascular disease; FBG: fasting blood glucose; eGFR: estimate glomerular filtration rate.
Table 2 Risk stratification chart of the Korea Occupational Safety & Health Agency tool
BP: blood pressure; CVD: cardio-cerebrovascular disease.
aRisk factors: age (male ≥ 45, female ≥ 55), family history of early CVD (male < 55, female < 65), current smoking status, obesity (body mass index ≥ 25, waist circumference ≥ 90 cm [male] or 85 cm [female]), prediabetes (fasting blood sugar 100–125 mg/dL, 2-hour post-prandial blood sugar 140–199 mg/dL or HbA1c 5.7%–6.4%), total cholesterol ≥ 220 mg/dL or low density lipoprotein cholesterol ≥ 150 mg/dL or triglyceride ≥ 200 mg/dL, high density lipoprotein cholesterol (< 40 mg/dL for risk factor, ≥ 60 mg/dL for risk-reducing factor).
Table 3 General characteristics of the study population
Values are presented as numbers (%).
BMI: body mass index; eGFR: estimated glomerular filtration rate; CVD: cardio-cerebrovascular disease.
aCalculated by χ2 test.
Table 4 Correlation and agreement between the 2 tools
Calculated by Spearman correlation analysis and linearly weighted kappa coefficient. Correlations and agreements between Korea Occupational Safety & Health Agency and National Health Insurance Service tools were statistically significant (
Table 5 Concordance of risk groups with the 2 tools
Values are presented as numbers (%). Concordance occurred in 6,498 (37.1%). The KOSHA tool high-estimated 1,079 (6.2%) and the NHIS tool high-estimated 9,908 (56.7%). For those aged < 45 years, concordance occurred in 4,835 (57.7%). The KOSHA tool high-estimated 752 (9.0%) and the NHIS tool high-estimated 2,786 (33.3%). For those aged 45–54 years, concordance occurred in 1,305 (24.7%). The KOSHA tool high-estimated 247 (4.7%) and the NHIS tool high-estimated 3,734 (70.6%). For those aged ≥ 55 years, concordance occurred in 358 (9.4%). The KOSHA tool high-estimated 80 (2.1%) and the NHIS tool high-estimated 3,388 (88.5%).
KOSHA: Korea Occupational Safety & Health Agency; NHIS: National Health Insurance Service.
aConcordances of risk groups with the 2 tools are highlighted.

