
Articles
- Page Path
- HOME > Ann Occup Environ Med > Volume 35; 2023 > Article
- Original Article The relationship between fatigue and sickness absence from work
-
Minsun Kim1
 , Jiho Kim1, SeongCheol Yang1,2, Dong-Wook Lee1, Shin-Goo Park1,2, Jong-Han Leem1,2, Hwan-Cheol Kim1,2
 -
Annals of Occupational and Environmental Medicine 2023;35:e32.
DOI: https://doi.org/10.35371/aoem.2023.35.e32
Published online: August 10, 2023
1Department of Occupational and Environmental Medicine, Inha University Hospital, Incheon, Korea.
2Department of Social and Preventive Medicine, School of Medicine, Inha University, Incheon, Korea.
- Address for Correspondence: Hwan-Cheol Kim, MD. Department of Occupational and Environmental Medicine, School of Medicine, Inha University, 27 Inhang-ro, Jung-gu, Incheon 22332, Korea. carpediem@inha.ac.kr
• Received: April 2, 2023 • Revised: July 17, 2023 • Accepted: July 20, 2023
Copyright © 2023 Korean Society of Occupational & Environmental Medicine
This is an Open Access article distributed under the terms of the Creative Commons Attribution Non-Commercial License (https://creativecommons.org/licenses/by-nc/4.0/) which permits unrestricted non-commercial use, distribution, and reproduction in any medium, provided the original work is properly cited.
Abstract
-
Background Although many studies have been conducted on worker fatigue and sickness absence, the association between fatigue and sickness absence is unclear in Korean workers. This study was conducted to investigate the effect of worker fatigue on future sickness absence.
-
Methods The study was conducted on workers who received medical check-ups at a university hospital for two consecutive years (2014–2015). During check-ups in the first year, the Fatigue Severity Scale (FSS) was used to assess fatigue levels, and during check-ups in the second year, sickness absence was surveyed to determine whether they had been absent from work due to physical or mental illness during previous 12 months. The χ2 test was used to analyze relationships between sociodemographic and occupational characteristics, fatigue levels, and sickness absence. Odds ratios (ORs) were calculated by logistic regression analysis controlled for confounding factors.
-
Results A total of 12,250 workers were included in the study, and 396 (3.2%) workers experienced more than one day of sickness absence during the study period. Adjusted ORs for sickness absence were 3.35 (95% confidence interval [CI]: 2.64–4.28) in the moderate-fatigue group and 6.87 (95% CI: 4.93–9.57) in the high-fatigue group versus the low-fatigue group. For men in the moderate- and high-fatigue groups, adjusted ORs for sickness absence were 3.40 (95% CI: 2.58–4.48) and 8.94 (95% CI: 6.12–13.07), and for women in the moderate- and high-fatigue groups, adjusted ORs for sickness absence were 2.93 (95% CI: 1.68–5.10) and 3.71 (95% CI: 1.84–7.49), respectively.
-
Conclusions Worker fatigue is associated with sickness absence during the following 12 months, and this association appears to be stronger for men than women. These results support the notion that sickness absence can be reduced by evaluating and managing work-related fatigue.
BACKGROUND
Fatigue is a daily experience of lack of rest or exhaustion due to physical activity1 and is broadly defined as “a feeling of malaise, tiredness, or lack of energy.” In the US, 38% of the workforce has been reported to suffer from work-related fatigue, manifesting as a subjective feeling of fatigue, reduced work efficiency, and changes in biological functions.2
Fatigue affects the risks of disease development and progression in many ways. Recently, relationships between fatigue and cardiovascular disease risk factors were reported, and heart rate variability analysis revealed an association between work-related fatigue and changes in cardiac autonomic nerve function and reduced sympathetic and parasympathetic nerve functions.3 In addition, fatigue affects chronic disease development and treatment efficacy,4 and one study showed that fatigue in patients with end-stage renal disease reduces time to the onset of heart disease.5
Fatigue can also reduce job and technical performance, increase social burdens and cause economic and social losses.6 One study concluded that work-related accidents are more common among workers who felt fatigued,7 and another suggested that worker fatigue is a major cause of worker absenteeism and turnover.8
Sickness absence is a condition caused by disease, whether physical, mental, or social in origin, that prevents individuals working,9 and is used as an indirect indicator of worker health status and company productivity.10 Sickness absence is a major public health issue, and is importance for both workers and employers.11 In a study of 7,495 workers at 40 companies, fatigue was related to less time to first sick leave and a higher risk of prolonged sickness absence.6 In a cohort of 2,059 Norwegian nurses, higher fatigue levels were associated with increased sickness absence.12
Many cross-sectional studies have addressed the relationship between fatigue and sickness absence in specific occupational groups, but no Korean study has addressed the association between worker fatigue and future sickness absence. Therefore, we analyzed the relationship between fatigue and future sickness absence in a Korean cohort.
METHODS
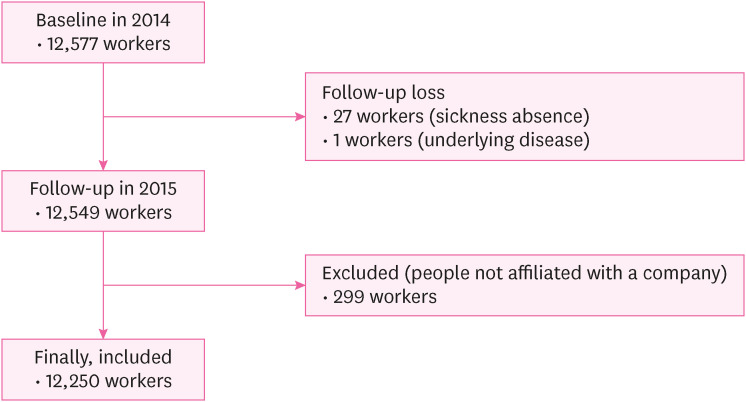
According to the Korean Occupational Safety and Health Act, each employee should undergo annually a health examination provided by their employer. Among the subjects that underwent a general check-up in 2014, we selected those who received examinations at workplaces contracted with a hospital. The first survey was conducted in 2014, and the second in 2015. Data collection by questionnaire was conducted twice with a 12-month interval on the same participants. Workers who received a medical check-up in 2014 were required to complete a Fatigue Severity Scale (FSS) questionnaire, and in 2015 the same workers were surveyed to determine whether or not they had been absent from work due to sickness during the previous 12 months. Of the 12,577 workers that received a medical check-up in 2014, 12,250 were included in the analysis. Exclusions were due to; follow-up loss (n = 27), failure to attend an underlying disease investigation (n = 1), and those who did not belong to the companies that contracted with the hospital and have personally conducted medical check-ups (n = 299) (Fig. 1).
All participants completed a self-report questionnaire about individual and sociodemographic variables and psychosocial work environment characteristics. Nurses and doctors helped workers when they experienced difficulties. This study was approved by the Institutional Review Board (IRB) of Inha University Hospital (IRB approval number: 2023-04-007). The IRB has reviewed and approved the study design.
Fatigue levels were assessed during 2014 medical check-ups using a self-completed FSS. The FSS was a tool developed by Krupp et al.13 to evaluate fatigue levels that are difficult to evaluate objectively. This study used the Korean version of the FSS developed by Chung et al. and the fatigue assessment and management guidelines in the Korea Occupational Safety & Health Agency guide H-91–2021.14 In the study of Krupp et al.,13 Cronbach’s α at the time of development was 0.89, and in the study of Chung et al.,14 Cronbach’s α was 0.94. The FSS comprises nine items that address fatigue, its severity, and its effects on daily activities, and scores Fatigue intensity for each item. Answers are scored using a seven-point Likert scale, on which 1 means ‘strongly disagree’ and 7 means ‘strongly agree.’ Thus, scores can range from 9 to 63, where higher scores indicate greater fatigue severity. Individuals with an FSS score of < 27 were assigned to a low-fatigue group, those with a score of 27 to 44 to a moderate-fatigue group, and those with a score of ≥ 45 to a high-fatigue group.15
In 2015, a survey was conducted to determine whether individuals had been Sickness absence from work during the previous 12 months. Absences were defined as being absent from the workplace and not working. Sickness absence was defined as absence due to physical or mental illness, excluding occupational injury. To assess sickness absence, individuals were asked to reply “Yes or No” to the question, “Have you been absent for more than one day due to physical or mental disease caused or aggravated by work, excluding occupational injury, during the past year?”.
The sociodemographic characteristics included in the analysis were sex, age (classified in 10-year units), smoking history, alcohol consumption, and underlying diseases. Smoking history was divided into non-smokers, past smokers, and current smokers, and alcohol consumption was divided into 0–2 times a week, 3–4 times a week, or 5–7 times a week. Underlying diseases were determined based on responses to a questionnaire during the national general health examination and included stroke, myocardial infarction/angina, hypertension, diabetes, hyperlipidemia, pulmonary tuberculosis, and other diseases. Those diagnosed with a disease at a hospital or clinic were asked to respond appropriately to the questionnaire; duplicate entries were allowed. People with one or more underlying diseases were assigned to an underlying disease group.
In addition, variables related to occupational characteristics were included. Industry types were classified according to the 10th revised classification of the Korea Standard Industry Code of the National Statistical Office, which systematically classifies activities performed by production unit type (e.g., business unit, corporate unit). All participants provided informed consent regarding the use of personal information.
The χ2 test was used to determine whether fatigue and potential confounders were associated with sickness absence (the outcome variable). Logistic regression analysis was used to investigate the association between fatigue and sickness absence. In the multivariate logistic regression analysis, we corrected for confounders that appeared to affect the outcome variables and independent variables through prior research and preliminary review. Adjusted ORs and CIs were obtained using the fully adjusted model. In addition, supplemental stratified analysis was conducted on men and women because a previous study reported that sex influences sickness absence.16 The analysis was performed using the Statistical Package for the Social Science (SPSS) for Windows version 25.0 (IBM Corp., Armonk, NY, USA).
RESULTS
Table 1 shows relationships between the characteristics of the 12,250 study participants and sickness absence and the prevalence of sickness absence according to demographic characteristics. Men comprised 75.8% of the participants, and those in their 30s and 40s accounted for 59.3%, 41.8% were non-smokers, and 82.8% drank alcohol 0–2 times a week. Regarding underlying diseases, 83.0% of the participants had no underlying disease, 61.1% had received a diagnosis of hypertension, and 18.2% had received a diagnosis of diabetes. Analysis by industry classification showed that 47.0% of manufacturing workers and 20.7% of transport and storage workers.
Table 1
Demographic Characteristics of the study participants according to sickness absence
Fatigue in 2014 and sickness absence during the following 12 months were significantly correlated (p < 0.001), and 1.5% (n = 97) participants in the low fatigue group, 4.8% (n = 232) in the moderate fatigue group, and 9.4% (n = 67) in the high fatigue group reported sickness absence. Smoking history was significantly associated with sickness absence (p < 0.001); 2.7% (n = 139) of non-smokers, 2.8% (n = 76) of past smokers, and 4.1% (n = 181) of current smokers reported sickness absence over the intervening 12 months. In addition, a significant correlation was observed between occupational characteristics and sickness absence (p < 0.001). Sickness absence was 5.1% (n = 2) in the construction industry, 5.1% (n = 15) for professional, scientific, and technical industry, and 4.2% (n = 243) in the manufacturing industry (Table 1).
The association between fatigue and sickness absence adjusted for confounders is shown in Table 2.
Table 2
ORs of sickness absence by fatigue severity scale and sex
The unadjusted ORs (95% CI) for sickness absence in the moderate- and high fatigue groups were 3.40 (2.67–4.32) and 7.07 (5.13–9.75). After adjusting for sociodemographic factors and occupational factors, the adjusted ORs (95% CI) for sickness absence in the moderate- and high fatigue groups were 3.35 (2.64–4.28) and 6.87 (4.93–9.57), respectively.
Stratified analysis by sex, after adjusting for sociodemographic and occupational factors, the adjusted ORs (95% CI) for sickness absence in the high-fatigue group were 8.94 (6.12–13.07) for men and 3.71 (1.84–7.49) for women (Table 2).
Table 3 shows relationships between fatigue and sickness absence according to the presence of underlying disease. After adjusting for sociodemographic and occupational factors, the adjusted ORs (95% CI) of sickness absence for those without an underlying disease were 3.15 (2.41–4.12) in the moderate-fatigue group and 6.43 (4.46–9.27) in the high-fatigue group. In those with underlying disease, the adjusted ORs of sickness absence in the moderate- and high-fatigue groups were 5.28 (2.97–9.37) and 11.80 (5.63–24.70), respectively (Table 3).
Table 3
ORs of sickness absence by fatigue severity scale and the presence of underlying disease
DISCUSSION
This study shows that workers with a self-reported high fatigue level had a high risk of sickness absence during the following year and that higher fatigue levels were related to greater risks of sickness absence. Furthermore, higher fatigue levels were associated with a higher risk of sickness absence for men and women. After adjusting for sociodemographic and occupational factors, there was no significant change in OR.
Our findings concur with previous results. A meta-analysis of worker fatigue and sickness absence showed that fatigue increased the risk of sickness absence by 35%.17 Other studies reported that the OR of high fatigue for long-term sick absence was 1.53 (95% CI: 1.36–1.72),6 and nurses with high fatigue had an OR of 1.58 (95% CI: 1.05–2.37) for sickness absence compared to nurses with low fatigue in a study of nurses working in hospitals.18
The association between fatigue and sickness absence may be associated with physiological factors and mental health status. For example, previous studies have shown that long working hours or labor-intensive work can reduce the ability of muscles to produce adenosine triphosphate and increase adenosine diphosphate production in muscle fibers and thus increase fatigue and the risk of sickness absence.19 Furthermore, chronic fatigue causes stress-related hormonal imbalances, leading to increased risks of physical illness and depression.20
Regarding the severity of worker fatigue, the risk of sickness absence was higher in the high-fatigue group than in the low-fatigue group 6.87 (95% CI: 4.93–9.57), which concurs with previous studies that evaluated the association between fatigue and sickness absence. In a study by Chang et al. on 30,146 workers, the risk of sickness absence increased consistently across fatigue level quartiles.21
Interestingly, our sex-stratified analysis revealed a notable difference, namely, that the risk of sickness absence for men was 8.94 (95% CI: 6.12–13.07), and that for women was 3.71 (95% CI: 1.84–7.49) in the high-fatigue subgroups versus the low-fatigue group. In a previous prevalence study, women were found to have a 1.5-fold higher risk than men of work-related fatigue,22 and a greater proportion of women (10.6%) felt fatigued for more than 1 month than men (10.2%), which was ascribed to greater family responsibilities.23 Another study found that the risk of experiencing fatigue among women was 1.2–1.7 times greater than men and that women experienced significantly more severe fatigue symptoms.24 Although studies have shown women have higher fatigue sensitivity, several reasons may explain why we found the risk of sickness absence was higher for men . A previous study showed that a higher percentage of women are non-regular workers and are less likely to absent themselves from work or take annual leave due to illness due to high job instability.25 In addition, it was also reported that presenteeism is more common among women due to lack of institutional support and time flexibility, and wage level differences.26
The present study adumbrates the relationship between fatigue and sickness absence and the modifying effect of underlying disease. The OR of sickness absence among participants with underlying disease was 11.80 (5.63–24.70) but 6.43 (4.46–9.27) among participants without an underlying disease. In a previous study of 12,137 workers, fatigue symptoms were more common in workers with an underlying disease, and number of underlying diseases was strongly related to fatigue.27 In addition, in a 2015 study of full-time workers conducted in the US, workers with underlying disease (e.g., arthritis, rheumatism, cancer, diabetes, heart disease, high blood pressure, lung disease, or stroke) had higher overall absenteeism,28 chronic diseases (e.g., liver disease or diabetes), and sickness absence rates, which represented an estimated annual loss to the US economy of more than $2 billion.29 Our findings and those of similar studies suggest the following in terms of health management: 1) fatigue in workers reporting severe fatigue requires assessment and management, and 2) workers with an underlying disease reporting lower levels of fatigue also require assessment and management.
The strengths of this study are as follows. First, 12-month interval was used to evaluate the relationship between fatigue and sickness absence. Although previous cross-sectional studies have been difficult to clearly determine the temporal association between fatigue and sickness absence, this study validates the temporal direction of exposure and outcome, which suggests that fatigue evaluations can predict sickness absences during the coming year and help manage workplace health. Second, workers from several workplaces that underwent general health examinations under the National Health Insurance Act participated, whereas other studies on sickness absence were conducted at a single workplace. Furthermore, the large sample size used in this study increases its clinical significance. Third, the study sheds light on the effects of sex and underlying disease on the relationship between work-related fatigue and sickness absence.
However, our investigation also has several limitations. First, recall bias cannot be ruled out since the data were collected using questionnaires completed by participants. Second, although previous studies have indicated that fatigue is related to psychological factors, such as depression and anxiety, psychological factors that might affect fatigue were not considered.30,31,32 Therefore, additional statistically meaningful studies are needed that consider psychological factors that might affect fatigue. Third, sickness absence was determined subjectively using a dichotomous approach (yes/no). Thus, we suggest additional objective studies be undertaken using systematic scales to determine the frequencies and causes of sickness absence.
CONCLUSIONS
This study shows that worker fatigue evaluations during physical examinations can predict the risk of sickness absence over the following 12 months and indicates that assessments of worker fatigue provide a potential means of improving worker health management.
Abbreviations
-
Competing interests: The authors declare that they have no competing interests.
-
Author Contributions:
NOTES
- 1. Ream E, Richardson A. Fatigue: a concept analysis. Int J Nurs Stud 1996;33(5):519–529. 8886902.ArticlePubMed
- 2. Ricci JA, Chee E, Lorandeau AL, Berger J. Fatigue in the U.S. workforce: prevalence and implications for lost productive work time. J Occup Environ Med 2007;49(1):1–10. 17215708.ArticlePubMed
- 3. Johnston S, Eckhardt AL. Fatigue and acute coronary syndrome: a systematic review of contributing factors. Heart Lung 2018;47(3):192–204. 29628144.ArticlePubMed
- 4. Swain MG. Fatigue in chronic disease. Clin Sci (Lond) 2000;99(1):1–8. 10887052.ArticlePubMedPDF
- 5. Koyama H, Fukuda S, Shoji T, Inaba M, Tsujimoto Y, Tabata T, et al. Fatigue is a predictor for cardiovascular outcomes in patients undergoing hemodialysis. Clin J Am Soc Nephrol 2010;5(4):659–666. 20185601.ArticlePubMedPMC
- 6. Janssen N, Kant IJ, Swaen GM, Janssen PP, Schröer CA. Fatigue as a predictor of sickness absence: results from the Maastricht cohort study on fatigue at work. Occup Environ Med 2003;60(Suppl 1):i71–i76. 12782750.ArticlePubMedPMC
- 7. Kristal-Boneh E, Froom P, Harari G, Ribak J. Fatigue among Israeli industrial employees. J Occup Environ Med 1996;38(11):1145–1150. 8941905.ArticlePubMed
- 8. Van Dijk FJ, Swaen GM. Fatigue at work. Occup Environ Med 2003;60(Suppl 1):i1–i2. 12782739.ArticlePubMedPMC
- 9. Rhee KY, Park WY. Sickness absence and job satisfaction. Journal of the Korea Safety Management & Science 2014;16(4):203–213.Article
- 10. Marmot M, Feeney A, Shipley M, North F, Syme SL. Sickness absence as a measure of health status and functioning: from the UK Whitehall II study. J Epidemiol Community Health 1995;49(2):124–130. 7798038.ArticlePubMedPMC
- 11. Kivimäki M, Head J, Ferrie JE, Shipley MJ, Vahtera J, Marmot MG. Sickness absence as a global measure of health: evidence from mortality in the Whitehall II prospective cohort study. BMJ 2003;327(7411):364. 12919985.ArticlePubMedPMC
- 12. Roelen CA, Bültmann U, Groothoff J, van Rhenen W, Magerøy N, Moen BE, et al. Physical and mental fatigue as predictors of sickness absence among Norwegian nurses. Res Nurs Health 2013;36(5):453–465. 23970440.ArticlePubMedPDF
- 13. Krupp LB, LaRocca NG, Muir-Nash J, Steinberg AD. The fatigue severity scale. Application to patients with multiple sclerosis and systemic lupus erythematosus. Arch Neurol 1989;46(10):1121–1123. 2803071.ArticlePubMed
- 14. Chung KI, Song CH. Clinical usefulness of fatigue severity scale for patients with fatigue, and anxiety or depression. Korean J Psychosom Med 2001;9(2):164–173.
- 15. Lerdal A. Fatigue Severity Scale. Encyclopedia of Quality of Life and Well-Being Research. Dordrecht, Netherlands: Springer; 2021, 1–5.
- 16. Allebeck P, Mastekaasa A. Swedish Council on Technology Assessment in Health Care (SBU). Chapter 5. risk factors for sick leave - general studies. Scand J Public Health Suppl 2004;63(Suppl):49–108. 15513654.PubMed
- 17. Sagherian K, Geiger-Brown J, Rogers VE, Ludeman E. Fatigue and risk of sickness absence in the working population: a systematic review and meta-analysis of longitudinal studies. Scand J Work Environ Health 2019;45(4):333–345. 30937459.ArticlePubMed
- 18. Sagherian K, Zhu S, Storr C, Hinds PS, Derickson D, Geiger-Brown J. Bio-mathematical fatigue models predict sickness absence in hospital nurses: an 18 months retrospective cohort study. Appl Ergon 2018;73:42–47. 30098641.ArticlePubMed
- 19. Sahlin K. Metabolic factors in fatigue. Sports Med 1992;13(2):99–107. 1561513.ArticlePubMed
- 20. Abbey SE, Garfinkel PE. Chronic fatigue syndrome and depression: cause, effect, or covariate. Rev Infect Dis 1991;13(Suppl 1):S73–S83. 2020805.ArticlePubMed
- 21. Chang SJ, Koh SB, Kang D, Kim SA, Chung JJ, Lee CG, et al. Fatigue as a predictor of medical utilization, occupational accident and sickness absence. Korean Journal of Occupational and Environmental Medicine 2005;17(4):318–332.ArticlePDF
- 22. Chen MK. The epidemiology of self-perceived fatigue among adults. Prev Med 1986;15(1):74–81. 3714661.ArticlePubMed
- 23. David A, Pelosi A, McDonald E, Stephens D, Ledger D, Rathbone R, et al. Tired, weak, or in need of rest: fatigue among general practice attenders. BMJ 1990;301(6762):1199–1202. 2261560.ArticlePubMedPMC
- 24. Loge JH, Ekeberg O, Kaasa S. Fatigue in the general Norwegian population: normative data and associations. J Psychosom Res 1998;45(1):53–65. 9720855.PubMed
- 25. Chang C, England P. Gender inequality in earnings in industrialized East Asia. Soc Sci Res 2011;40(1):1–14.Article
- 26. Simpson R. Presenteeism, power and organizational change: long hours as a career barrier and the impact on the working lives of women managers. Br J Manage 1998;9(Suppl 1):37–50.ArticlePDF
- 27. Franssen PM, Bültmann U, Kant I, van Amelsvoort LG. The association between chronic diseases and fatigue in the working population. J Psychosom Res 2003;54(4):339–344. 12670611.ArticlePubMed
- 28. Vuong TD, Wei F, Beverly CJ. Absenteeism due to functional limitations caused by seven common chronic diseases in US workers. J Occup Environ Med 2015;57(7):779–784. 26147545.ArticlePubMedPMC
- 29. Asay GR, Roy K, Lang JE, Payne RL, Howard DH. Peer reviewed: absenteeism and employer costs associated with chronic diseases and health risk factors in the US workforce. Prev Chronic Dis 2016;13:E141. 27710764.PubMedPMC
- 30. Corfield EC, Martin NG, Nyholt DR. Co-occurrence and symptomatology of fatigue and depression. Compr Psychiatry 2016;71:1–10. 27567301.ArticlePubMed
- 31. Kroenke K, Spitzer RL, Williams JB, Linzer M, Hahn SR, deGruy FV 3rd, et al. Physical symptoms in primary care. Predictors of psychiatric disorders and functional impairment. Arch Fam Med 1994;3(9):774–779. 7987511.ArticlePubMed
- 32. Lyon D, McCain N, Elswick RK, Sturgill J, Ameringer S, Jallo N, et al. Biobehavioral examination of fatigue across populations: report from a P30 Center of Excellence. Nurs Outlook 2014;62(5):322–331. 25218081.ArticlePubMedPMC
REFERENCES
REFERENCES
Figure & Data
REFERENCES
Citations
Citations to this article as recorded by 
- Novel BRCA1–PLK1–CIP2A axis orchestrates homologous recombination-mediated DNA repair to maintain chromosome integrity during oocyte meiosis
Crystal Lee, Jeong Su Oh
Nucleic Acids Research.2025;[Epub] CrossRef
 Cite
CiteThe relationship between fatigue and sickness absence from work

Fig. 1 Flow chart of study population.
Fig. 1
The relationship between fatigue and sickness absence from work
| Characteristics | Total | Sickness absence | |||||
|---|---|---|---|---|---|---|---|
| Yes | No | ||||||
| Total | 12,250 (100) | 396 (3.2) | 11,854 (96.8) | ||||
| Sex | 0.327 | ||||||
| Male | 9,287 (75.8) | 292 (3.1) | 8,995 (96.9) | ||||
| Female | 2,963 (24.2) | 104 (3.5) | 2,859 (96.5) | ||||
| Age (years) | 0.299 | ||||||
| < 30 | 1,937 (15.8) | 73 (3.8) | 1,864 (96.2) | ||||
| 30–39 | 3,719 (30.4) | 125 (3.4) | 3,594 (96.6) | ||||
| 40–49 | 3,537 (28.9) | 106 (3.0) | 3,431 (97.0) | ||||
| 50–59 | 2,847 (23.2) | 89 (3.1) | 2,758 (96.9) | ||||
| > 59 | 210 (1.7) | 3 (1.4) | 207 (98.6) | ||||
| Underlying disease | 0.406 | ||||||
| No | 10,210 (83.3) | 324 (3.2) | 9,886 (96.8) | ||||
| Yes | 2,040 (16.7) | 72 (3.5) | 1,968 (96.5) | ||||
| Classification of underlying diseaseb | |||||||
| Stroke | 20 (1.0) | 0 (0.0) | 22 (100) | ||||
| Myocardial infarction/Angina | 74 (3.6) | 4 (5.0) | 70 (94.6) | ||||
| Hypertension | 1,246 (61.1) | 35 (2.8) | 1,211 (97.2) | ||||
| Diabetes | 372 (18.2) | 13 (3.5) | 359 (96.5) | ||||
| Hyperlipidemia | 370 (18.1) | 24 (6.5) | 346 (93.5) | ||||
| Pulmonary tuberculosis | 177 (8.7) | 8 (4.5) | 169 (93.5) | ||||
| Other diseases | 185 (9.1) | 9 (4.9) | 176 (95.1) | ||||
| Smoker | < 0.001 | ||||||
| Non-smoker | 5,123 (41.8) | 139 (2.7) | 4,984 (97.3) | ||||
| Past smoker | 2,756 (22.5) | 76 (2.8) | 2,680 (97.2) | ||||
| Current smoker | 4,371 (35.7) | 181 (4.1) | 4,190 (95.9) | ||||
| Alcohol consumption (time/week) | 0.033 | ||||||
| 0–2 | 10,143 (82.8) | 309 (3.0) | 9,834 (97.0) | ||||
| 3–4 | 1,758 (14.4) | 71 (4.0) | 1,687 (96.0) | ||||
| 5–7 | 349 (2.8) | 16 (4.6) | 333 (95.4) | ||||
| Occupational characteristics | < 0.001 | ||||||
| Industry classification | |||||||
| Manufacturing | 5,755 (47.0) | 243 (4.2) | 5,512 (95.8) | ||||
| Electricity, gas, steam and air conditioning supply | 101 (0.8) | 0 (0.0) | 101 (100) | ||||
| Water, sewage and waste treatment, raw material recycling | 106 (0.9) | 3 (2.8) | 103 (97.2) | ||||
| Construction industry | 39 (0.3) | 2 (5.1) | 37 (94.9) | ||||
| Wholesale and retail trade | 304 (2.5) | 12 (3.9) | 292 (96.1) | ||||
| Transport and storage | 2,530 (20.7) | 50 (2.0) | 2,480 (98.0) | ||||
| Accommodation and food service activities | 81 (0.7) | 0 (0.0) | 81 (100) | ||||
| Information and communication | 288 (2.4) | 1 (0.3) | 287 (99.7) | ||||
| Real estate activities | 44 (0.4) | 1 (2.3) | 43 (97.7) | ||||
| Professional, scientific and technical activities | 294 (2.4) | 15 (5.1) | 279 (94.9) | ||||
| Business facilities management and business support services | 1,143 (9.3) | 35 (3.1) | 1,108 (96.9) | ||||
| Public administration and defence | 237 (1.9) | 4 (1.7) | 233 (98.3) | ||||
| Education | 62 (0.5) | 2 (3.2) | 60 (96.8) | ||||
| Human health and social work activity | 1,199 (9.8) | 26 (2.2) | 1,173 (97.8) | ||||
| Membership organizations, repair and other personal services | 67 (0.5) | 2 (3.0) | 65 (97.0) | ||||
| Fatigue severity scale | < 0.001 | ||||||
| < 27 | 6,678 (54.5) | 97 (1.5) | 6,851 (98.5) | ||||
| 27–44 | 4,862 (39.7) | 232 (4.8) | 4,630 (95.2) | ||||
| ≥ 45 | 710 (5.8) | 67 (9.4) | 643 (90.6) | ||||
| Fatigue severity scale | Unadjusted OR (95% CI) | Adjusted OR (95% CI)a | |
|---|---|---|---|
| Total | |||
| Low (< 27) | 1.00 | 1.00 | |
| Moderate (27–44) | 3.40 (2.67–4.32) | 3.35 (2.64–4.28) | |
| High (≥ 45) | 7.07 (5.13–9.75) | 6.87 (4.93–9.57) | |
| Male | |||
| Low (< 27) | 1.00 | 1.00 | |
| Moderate (27–44) | 3.58 (2.72–4.70) | 3.40 (2.58–4.48) | |
| High (≥ 45) | 9.64 (6.64–14.00) | 8.94 (6.12–13.07) | |
| Female | |||
| Low (< 27) | 1.00 | 1.00 | |
| Moderate (27–44) | 2.86 (1.71–4.78) | 2.93 (1.68–5.10) | |
| High (≥ 45) | 3.77 (1.95–7.28) | 3.71 (1.84–7.49) | |
| Fatigue severity scale | Unadjusted OR (95% CI) | Adjusted OR (95% CI)a | |
|---|---|---|---|
| Total | |||
| Low (< 27) | 1.00 | 1.00 | |
| Moderate (27–44) | 3.40 (2.67–4.32) | 3.42 (2.69–4.36) | |
| High (≥ 45) | 7.07 (5.13–9.75) | 7.21 (5.20–10.00) | |
| Participants without an underlying disease | |||
| Low (< 27) | 1.00 | 1.00 | |
| Moderate (27–44) | 3.13 (2.40–4.07) | 3.15 (2.41–4.12) | |
| High (≥ 45) | 6.34 (4.43–9.07) | 6.43 (4.46–9.27) | |
| Participants with an underlying disease | |||
| Low (< 27) | 1.00 | 1.00 | |
| Moderate (27–44) | 5.28 (2.97–9.37) | 5.28 (2.97–9.37) | |
| High (≥ 45) | 11.80 (5.63–24.70) | 11.80 (5.63–24.70) | |
Table 1 Demographic Characteristics of the study participants according to sickness absence
Values are presented as numbers (%).
a
bDuplicate responses were accepted for the classification of underlying disease.
Table 2 ORs of sickness absence by fatigue severity scale and sex
OR: odds ratio; CI: confidence interval.
aAdjusted Odds ratios and 95% confidence intervals were determined by logistic regression analysis adjusted for age, smoking, alcohol consumption, presence of underlying disease(with one or more underlying diseases) and industry classification.
Table 3 ORs of sickness absence by fatigue severity scale and the presence of underlying disease
OR: odd ratio; CI: confidence interval.
aAdjusted ORs and 95% CIs were determined by logistic regression analysis adjusted for sex, age, smoking, and alcohol consumption, and industry classification.

