
Articles
- Page Path
- HOME > Ann Occup Environ Med > Volume 34; 2022 > Article
- Original Article The health effects of low blood lead level in oxidative stress as a marker, serum gamma-glutamyl transpeptidase level, in male steelworkers
-
Su-Yeon Lee
 , Yong-Jin Lee, Young-Sun Min, Eun-Chul Jang, Soon-Chan Kwon, Inho Lee
 -
Annals of Occupational and Environmental Medicine 2022;34:e34.
DOI: https://doi.org/10.35371/aoem.2022.34.e34
Published online: November 2, 2022
Department of Occupational and Environmental Medicine, Soonchunhyang University Cheonan Hospital, Cheonan, Korea.
- Correspondence: Yong-Jin Lee. Department of Occupational and Environmental Medicine, Soonchunhyang University Cheonan Hospital, 31 Suncheonhyang 6-gil, Dongnam-gu, Cheonan 31151, Korea. regina94@schmc.ac.kr
• Received: May 30, 2022 • Revised: October 5, 2022 • Accepted: October 26, 2022
Copyright © 2022 Korean Society of Occupational & Environmental Medicine
This is an Open Access article distributed under the terms of the Creative Commons Attribution Non-Commercial License (https://creativecommons.org/licenses/by-nc/4.0/) which permits unrestricted non-commercial use, distribution, and reproduction in any medium, provided the original work is properly cited.
Abstract
-
Background This study aimed to investigate the association between lead exposure and serum gamma-glutamyl transpeptidase (γGT) levels as an oxidative stress marker in male steelworkers.
-
Methods Data were collected during the annual health examination of workers in 2020. A total of 1,654 steelworkers were selected, and the variables for adjustment included the workers’ general characteristics, lifestyle, and occupational characteristics. The association between the blood lead level (BLL) and serum γGT level was investigated by multiple linear and logistic regression analyses. The BLL and serum γGT values that were transformed into natural logarithms were used in multiple linear regression analysis, and the tertile of BLL was used in logistic regression analysis.
-
Results The geometric mean of the participants’ BLLs and serum γGT level was 1.36 μg/dL and 27.72 IU/L, respectively. Their BLLs differed depending on age, body mass index (BMI), smoking status, drinking status, shift work, and working period, while their serum γGT levels differed depending on age, BMI, smoking status, drinking status, physical activity, and working period. In multiple linear regression analysis, the difference in models 1, 2, and 3 was significant, obtaining 0.326, 0.176, and 0.172 (all: p < 0.001), respectively. In the multiple linear regression analysis stratified according to drinking status, BMI, and age, BLLs were positively associated with serum γGT levels. Regarding the logistic regression analysis, the odds ratio of the third BLL tertile in models 1, 2, and 3 (for having an elevated serum γGT level within the first tertile reference) was 2.74, 1.83, and 1.81, respectively.
-
Conclusions BLL was positively associated with serum γGT levels in male steelworkers even at low lead concentrations (< 5 μg/dL).
BACKGROUND
Lead is a malleable heavy metal with blue-gray color. It has high density and corrosion resistance. Lead is mainly used in the storage battery industry, as well as in the wire manufacturing, construction, and military industries. All over the world, lead production has increased. In the 2010s, approximately 11 million tons of lead were produced annually; a remarkable increase compared to the 5 million tons produced in the 1970s.1
Lead exerts harmful effects on humans, as it interrupts the action of enzymes in the human body and causes an imbalance in ions, thereby affecting the hematopoietic system and the kidney function, and accumulating in neural tissues and influencing both the neuromuscular and the central nervous system.2
Reference ranges for lead exposure vary across countries and population groups. The reference range of lead exposure for Korean workers is < 30 μg/dL,3 the biological exposure index of the American Conference of Governmental Industrial Hygienists (ACGIH) for lead exposure is <30 μg/dL,4 and the Centers for Disease Control and Prevention (CDC)’s Adult Blood Lead Epidemiology and Surveillance defines an increase in blood lead as ≥ 5 μg/dL.5 The blood lead levels (BLLs) of the general population are decreasing,6,7 but some studies have shown that there may be health effects caused by lead even at levels below the reference ranges. Some animal studies have shown that lead exposure increases reactive oxygen species (ROS) production, exerts neurotoxicity, and affects the immune responses.8
Levels of serum gamma-glutamyl transpeptidase (γGT) indicate the presence of liver disease and/or alcohol abuse.9,10 In fact, serum γGT is a protein that can be found on the surface of secretory cells, and that plays an important role in the regulation of glutathione homeostasis.11 Glutathione is important for cell homeostasis, and plays a major role in the detoxification of pollutants as well as in the regulation of cell cycle control, cell death, and cell signaling.12
The value of serum γGT levels as a biomarker of oxidative stress has been thoroughly investigated. Some studies have shown that serum γGT levels within the reference range can be early oxidative stress indicators and are inversely correlated to the availability of antioxidants such as vitamin C and carotenoids.13,14
The health effects of low-level lead exposure are being revealed, such as the reduction of the reference range for lead exposure in children from 5 to 3.5 μg/dL.15 However, there have been few large-scale studies of the relationship between low lead exposure levels in workers occupationally exposed to lead and serum γGT levels as an indicator of oxidative stress. This study was conducted to examine the relationship between serum γGT levels as a human index of oxidative stress and BLLs less than 5 μg/dL, a cause of oxidative stress.
METHODS
As a cross-sectional study, this study was performed based on the results of the annual health examination of workers under the Occupational Safety and Health Act. The examination was performed on steelworkers aged 19 or older working in a steel mill in the Republic of Korea. The collection and analysis of the health examination data of these steelworkers were conducted by a university hospital in South Korea from January 1, 2020 to December 31, 2020. During that period, a total of 6,527 steelworkers were examined at the workplace, and 63 steelworkers were excluded due to missing variables or incomplete questionnaires necessary for this study. Among the remaining, 1,977 steelworkers were subject to special health examinations for lead. From these 1,977 steelworkers, those diagnosed with or undergoing treatment for diabetes and those with a fasting blood sugar level of 126 mg/dL or higher were excluded from the study (81 steelworkers) because diabetes has been associated with higher serum γGT levels.16,17 In addition, based on the results of a comprehensive clinical examination conducted concurrently with the health examination for workers, 59 steelworkers positive for the hepatitis B antigen or hepatitis C antibody and 179 steelworkers with moderate or severe fatty liver on abdominal ultrasonography were excluded. Except for fatty liver, the abdominal ultrasonography results of the steelworkers revealed no liver parenchymal or hepatobiliary abnormalities that could affect the elevation of serum γGT levels. Finally, to determine the effect of low-level lead exposure, 4 steelworkers with outlier BLL values (> 5 μg/dL) were excluded from this study (7.3, 7.4, 7.6, and 19.5 μg/dL, respectively). The final count of the subjects selected for inclusion in this study was 1,654 steelworkers, all of which were men (Fig. 1).
Fig. 1

Flowchart of the inclusion process in the study population.
HBV: hepatitis B virus; HCV: hepatitis C virus; USG: ultrasonography.
Variables representing demographic characteristics and lifestyle included age, body mass index (BMI), smoking, drinking and physical activity. Because the youngest worker was 22 years old and the oldest was 66 years old, age was classified as “22 or older to 29-year-old,” “30 or older to 39-year-old,” “40 or older to 49-year-old,” and “50-years-old to 66-year-old.” BMI (kg/m2) was classified as “normal (BMI < 23),” “overweight (23 ≤ BMI < 25),” and “obese (BMI ≥ 25).” The smoking status was classified as “never-smokers,” “ex-smokers,” and “smokers.” In the multiple linear regression model, smoking was classified into current smokers and non-current smokers (never smokers or ex-smokers). The alcohol consumption per week was calculated by considering the amount of alcohol consumed at a time, the alcohol type, and the drinking frequency based on the National Institute on Alcohol Abuse and Alcoholism (NIAAA) guideline18; subsequently, the drinking status was classified as “non-drinking,” “social drinking,” and “heavy drinking.” Heavy drinking for a male is defined when the amount of alcohol consumed per week exceeds 112 g, while social drinking reflects an alcohol weekly consumption that is lower than 112 g, based on the Korean Alcohol Guidelines for Primary Care Physician.19 The “non-drinking” classification was assigned to those steelworkers who did not drink alcohol at all. In the multiple linear regression model, drinking was classified into heavy drinking and normal drinking (social drinking or non-drinking). Physical activity was classified into three groups: “no,” “little,” and “yes.” Being the standard for physical activity, “yes” reflected the undertaking of medium-strength aerobic physical activity for more than 150 min/week or of high-strength aerobic physical activity for more than 75 min/week (where 1 minute of high-strength aerobic physical activity equals to 2 minutes of medium-strength aerobic physical activity), based on the Physical Activity Guide for Korea published by the Korean Ministry of Health and Welfare in 2013.20 In contrast, “little” reflected the undertaking of medium-strength physical activity for less than 150 min/week or of high-strength physical activity for less than 75 min/week, and “no” was assigned to those who did not undertake any medium- or high-strength physical activity at all.
In terms of variables representing occupational characteristics, shift work, working period, co-exposure to mercury or cadmium, and co-exposure to hepatotoxic substances were applied. The shift work was classified as “yes” and “no” and the working period was classified as being “less than 5 years,” “5 to 10 years,” and “more than 10 years.” The co-exposure to mercury, cadmium, or hepatotoxic substances led to the distinction of the “exposed” and the “nonexposed” groups; a classification that was based on the workers’ special health checkup target substances, as reported by the company. The hepatotoxic substances to which workers of this steel mill were exposed were dimethylformamide, methyl isobutyl ketone, 2-butoxyethanol, xylene, toluene, phenols, hydrazine, and copper.
Steelworkers’ exposure to lead was determined by measuring the lead concentration in their blood. BLLs were measured by using an atomic absorption spectrometer (iCE 3000 series AA; Thermo Fisher Scientific, Waltham, MA, USA) in a volume of 3 mL of whole blood. The association of BLLs with serum γGT levels was assessed using the tertile breakdown of the BLLs in the logistic regression analysis of this study.
Blood sampling for serum γGT was conducted after fasting for more than 8 hours. Approximately 5 mL of whole blood was collected, and the definition of elevation of serum γGT levels for the logistic regression analysis of this study was 78 IU/L or higher; a threshold based on the health checkup criteria set by the Korean Ministry of Health and Welfare.21
Frequency analysis was performed to identify the distribution of the general characteristics, the life style, and the occupational characteristics of the study subjects. Student’s t-test and analysis of variance (ANOVA) were undertaken to determine the distribution and the difference of the BLLs and serum γGT levels according to the characteristics of the study subjects. Because the BLLs and serum γGT levels showed a skewed distribution, they were converted into a natural log, analyzed, and then inverted for the undertaking of the average calculation. For the average expression, BLLs and serum γGT levels were expressed as a geometric mean (GM) and an arithmetic mean (AM) along with a 95% confidence interval (CI). The multiple linear regression analysis was conducted using natural log transformed serum γGT level as a dependent continuous variable and the natural log transformed BLL as an independent variable. Logistic regression analysis was performed with the elevation criterion of serum γGT being set at 78 IU/L using the tertile of BLL.
In Model 1, no variables were adjusted. In Model 2, the variables of demographic and lifestyle presenting characteristics (such as age, BMI, drinking, smoking, and physical activity) were adjusted. In Model 3, the occupational characteristics (such as shift work, working period, co-exposure to mercury or cadmium, and co-exposure to hepatotoxic substances) were adjusted along with Model 2. In addition, stratified analysis was performed according to age, BMI, drinking status, and drinking-smoking status.
Statistical significance was set at a p-value of < 0.05. All statistical analyses were conducted by using the SPSS statistical program (version 26.0; SPSS Inc., Chicago, IL, USA).
This retrospective study was approved by the International Review Board (IRB) of Soonchunhyang University Hospital, Cheonan (IRB No. SCHCA 2022-04-019).
RESULTS
Table 1 presents the distribution of the BLLs and serum γGT levels depending on the characteristics of the subjects. There were 1,654 study subjects; the GM (95% CI) of the BLLs was 1.36 μg/dL (1.33−1.39), and the GM (95% CI) of serum γGT levels was 27.72 IU/L (26.81−28.66). The range of the first tertile of the BLL was 0.1–1.1 μg/dL, the second was 1.2–1.6 μg/dL, and the third was 1.7–4.6 μg/dL. The GMs (95% CI) of serum γGT levels were 23.15 IU/L (21.93–24.43) for the first BLL tertile, 27.39 IU/L (25.92–28.95) for the second BLL tertile, and 33.17 IU/L (31.24–35.22) for the third (highest) BLL tertile. As the BLL increased, the level of serum γGT also increased.
Table 1
Distribution of BLLs and serum γGT levels according to the characteristics of the study population
AM: arithmetic mean; BLL: blood lead level; BMI: body mass index; Cd: cadmium; CI: confidence interval; GM: geometric mean; Hg: mercury; γGT: gamma-glutamyl transpeptidase; SD: standard deviation; SE: standard error; T: blood lead level tertile.
aCalculated by an analysis of variance; bCalculated by a Student’s t-test; cDimethylformamide, methyl isobutyl ketone, 2-butoxyethanol, xylene, toluene, phenols, hydrazine and copper.
By age, those in their 30s were the majority of the included steelworkers (49.8%), as compared to those in their 20s (9.1%), 40s (24.7%), and 50s or older (16.4%) and the AM of age of the study subjects was 39.7 years old. A significant difference in the BLL and serum γGT level was observed when compared across the different age groups. Increases in the BLL and serum γGT level were associated with an increase in age. The obese group (BMI ≥ 25) was the most common, followed by the overweight group (23 ≤ BMI < 25) and normal group (BMI < 23). The BLLs and serum γGT levels were highest in the obese group. As far as the steelworkers’ smoking status is concerned, both the BLL and the level of serum γGT in the smoking group were found to be high. A similar pattern was observed with regard to the drinking state, where both the BLL and the level of serum γGT in the heavy-drinking group were found to be high. The differences in BLL across the examined physical activity groups were not significant, but the serum γGT level was high in the non-physical activity group.
Among the variables representing occupational characteristics, 38.3% of the study subjects were shift workers and there was no significant difference in their serum γGT levels when compared to their non-shift colleagues, but there was a significant difference observed with regard to their BLLs. The group of steelworkers working for more than 10 years represented 53.5% of the study subjects, and the BLLs and serum γGT levels were found to be significantly higher as the working period was prolonged. In the co-exposure group, no significant differences were observed in either the BLLs or serum γGT levels across the groups defined by a co-exposure to mercury, cadmium, or hepatobiliary system-affecting substances.
Multiple linear regression analysis was performed to identify the relationship between the BLL and serum γGT level in steelworkers; results showed a significant difference in Model 1 (β: 0.326; 95% CI: 0.252–0.399; p < 0.001), Model 2 (β: 0.176; 95% CI: 0.103–0.249; p < 0.001), and Model 3 (β: 0.172; 95% CI: 0.099–0.245; p < 0.001). When stratified analysis was performed based on 112 g of alcohol intake per week, BLLs and serum γGT levels showed a statistically significant association in all models. When stratified based on BMI 25 kg/m2 and when stratified based on age 40 years, the association of BLLs and serum γGT levels was statistically significant in all models. When stratified analysis of drinking and smoking was performed simultaneously, it was not statistically significant only in the currently smoking heavy-drinking group (Table 2).
Table 2
Multiple linear regression analyses to reveal the association between ln BLLs and ln serum γGT levels
Model 1 was a crude model; Model 2 was adjusted for age, body mass index, smoking status, drinking status, and physical activity; Model 3 was adjusted for age, body mass index, smoking status, drinking status, physical activity, shift work, working period, co-exposure to mercury or cadmium, and co-exposure to hepatotoxic substances.
BLL: blood lead level; CI: confidence interval; γGT: gamma glutamyl transpeptidase.
In the logistic regression analysis that analyzed the odds ratio (OR) of the elevation in serum γGT levels, the risk of elevation was high in the third (highest) BLL tertile as compared to the first (lowest) BLL tertile in models 1, 2, and 3. The ORs (95% CIs) of the third BLL tertile (relatively to the first BLL tertile) were 2.74 (1.76–4.28), 1.83 (1.13–2.95), and 1.81 (1.12–2.92) in models 1, 2, and 3 (p < 0.001, p = 0.013, and p = 0.016, respectively) (Fig. 2).
Fig. 2
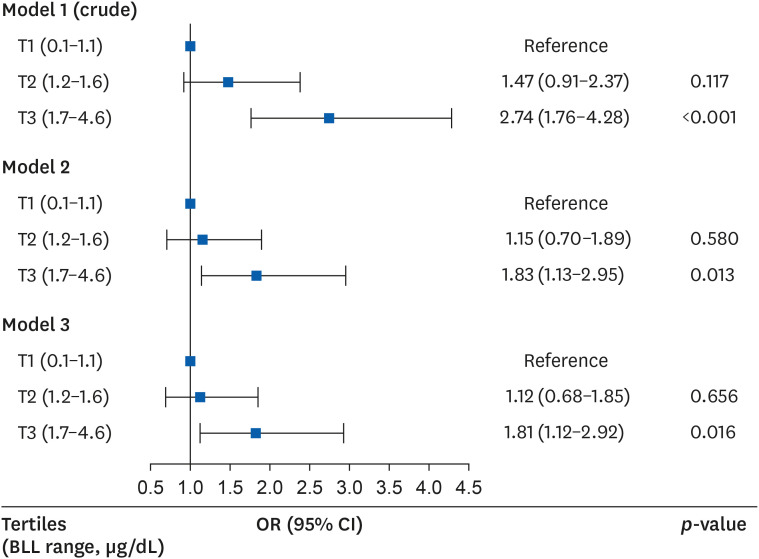
OR (95% CI) for having elevated serum γGT levels according to BLLs after covariate adjustment.
Model 1 was crude model; Model 2 was adjusted for age, body mass index, smoking status, drinking status and physical activity; Model 3 was adjusted for age, body mass index, smoking status, drinking status, physical activity, shift work, working period, co-exposure to mercury or cadmium, and co-exposure to hepatotoxic substances.
BLL: blood lead level; CI: confidence interval; γGT: gamma-glutamyl transpeptidase; OR: odds ratio; T: blood lead level tertile.
DISCUSSION
This study showed that serum γGT levels increases with age and working period before adjusting for other variables, which is consistent with the results of previous related studies,22 and also indicated that serum γGT levels were positively associated with BLLs among steelworkers. When the analysis was stratified by drinking status, BMI, and age, the same results were derived. In the multiple linear regression analysis stratified by drinking and smoking, the serum γGT levels in almost all groups were associated with a BLL increase. Therefore, the oxidative stress of lead exposure may affect the serum γGT level regardless of the drinking or smoking status. However, no association was noted for the current smokers and heavy-drinking groups, which had the highest BLL and serum γGT levels and positive β values but not statistically significant. Possibly, other factors affected oxidative stress more strongly than lead exposure. In a study of the general U.S. population, alcohol intake and serum γGT activity showed a curved trend23 and some studies have reported a significant synergistic effects of smoking and alcohol consumption in the elevation of serum γGT activity.24,25 Therefore, in the current smoker and heavy-drinking subgroup, the increase in serum γGT levels may be due to the synergistic effect of smoking and alcohol consumption rather than oxidative stress caused by lead exposure.
In terms of the BLL as an independent variable, given that the participants’ BLLs were mostly within the reference range, blood lead as a quantile was applied to the study in various ways, from the tertiles to the deciles, in many studies investigating blood lead as an independent variable.6,26,27 In the present study, the BLL’s tertile was used for the logistic regression analysis.
The steel making process is an integrated manufacturing system where iron ores are made into steel products by the multistage process. Generally, the structures of this process are categorized into two types: the integrated process using a blast furnace and the compact process using an electric furnace. In this study, the steelmill mainly produces steel products through the integrated process. Typically, the integrated process includes blast furnace ironmaking, hot metal pretreatment, converter steelmaking, refining, continuous casting, and hot rolling procedures.28 During this process, metals such as cadmium, lead, zinc, mercury, manganese, nickel and chromium may be released from furnaces as dust, fumes or vapors or absorbed into the body in particulate form.29
As a result of reviewing the work environment measurement data, 166 lead measurement processes were found, with 0.015 mg/m3 as the highest measurement (exposure reference: 0.05 mg/m3; South Korea’s Ministry of Employment and Labor,3 threshold limit values [TLV] of the ACGIH4). The GM of the BLLs of the subjects of this study (1.36 μg/dL) was lower than that of the general population of Korea (1.51 μg/dL in the 4th Korean National Environmental Health Survey [KoNEHS], 2018–202030). BLLs are affected by environmental and occupational factors, and BLLs are gradually decreasing due to environmental factors in general population.6,7,31,32 In addition, it can be seen that the BLLs of the steel workers, the subject of this study, has been improved compared to the BLLs of workers in other steel companies in the past. In a study of about 160 Pakistani steel mill workers including a control group, the BLL of lead-exposed workers was about 25.6 μg/dL.33 Moreover, the work environment exposed to lead in the steel-related industry has improved compared to the past. In Korea, the GM of lead in the air of the smelting plant was 0.022 mg/m3 in primary smelting and 0.083 mg/m3 in secondary smelting based on the work environment measurement data surveyed from 1994 to 2007.34 In addition to improving the working environment, in 2020, it can be expected that there was a decrease in the amount of work due to the COVID-19 outbreak, and it is estimated that the wearing of personal protection equipment was more thorough than ever.
According to a study conducted on the general population of the United States, oxidative stress-related indicators exhibited a graded association with the BLLs. Moreover, serum γGT level was positively correlated with the BLL, while vitamin C, carotenoids, and vitamin E exhibited a negative correlation with BLL.26 A study of the American population based on the United States National Health and Nutrition Examination Survey (NHANES) results showed that lead exposure and serum γGT levels as oxidative stress indicators were statistically significant.27 Among pregnant women in the United States, lead quartiles were associated with serum γGT levels as an oxidative stress indicator.35 Moreover, a study of 40 workers at an Iraqi refinery and 20 controls revealed that the levels of serum γGT as an antioxidant were significantly higher in workers exposed to lead, cadmium, and mercury.36 In a study involving 89 workers in a plastics industry in India, the mean and standard deviation of serum γGT levels in the lead-exposed and nonexposed groups were 19 ± 5 and 63 ± 7 IU/L, respectively.37 Furthermore, a study of 148 workers in Pakistan showed high serum γGT levels in the lead-exposed group, with a correlation coefficient of 0.63.38 In the United Arab Emirates, a study including 200 workers revealed higher serum γGT levels in the lead-exposed group than in the nonexposed group, but the difference between these groups was not statistically significant.39 As such, the results of this study are consistent with the results of most previous studies, but many studies that diversify the population group and confounding variables are needed in order to generalize the research results.
The level of lead exposure in the general population is decreasing as policies aiming to reduce exposure to lead are implemented; such restrictions focus on lead use in gasoline and paint as well as in children’s toys. According to studies based on the results of the United States NHANES, the BLL in the general population in the 1970s was about 15 μg/dL, and it has recently decreased to 1−2 μg/dL.31,32 According to studies based on the results of the Korean National Environmental Health Survey (KoNEHS), the BLLs of adults aged 19 or older were 1.79 μg/dL in the 1st KoNEHS (2009−2011),40 1.94 μg/dL in the 2nd KoNEHS (2012−2014),41 1.60 μg/dL in the 3rd KoNEHS (2015−2017),42 and 1.51 μg/dL in the 4th KoNEHS (2018−2020).30 However, the number of studies focusing on the health effects of exposures to low level of lead is increasing.
Some studies have shown that an exposure to low levels of lead that fall within the reference range can also act as a risk factor for the development of cardiovascular diseases and can increase mortality.43 Even at a BLL of 10 μg/dL or less, the mortality rate of all causes and the cardiovascular mortality were associated with the BLL.44 According to a study on the general population of the United States, low BLL (< 5 μg/dL) have also been associated with the development of hypertension. The ORs (95% CIs) of hypertension relatively to the first BLL quartile was 1.14 (1.05−1.25), 1.15 (1.04−1.28), and 1.22 (1.9−1.36) in the second, third, and fourth BLL quartiles, respectively.45 In addition, in a study analyzing the BLLs and the kidney function, the risk of kidney function reduction was found to be 1.631 times higher in the group of the fourth BLL quartile (≥ 3.01 μg/dL) than in the first BLL quartile (< 1.73 μg/dL).46 In a population based cohort, low level of lead exposure was associated with decreased renal function and the development of chronic kidney disease.47 As a result, there are many studies demonstrating that the exposure to even low levels of lead (that fall within the reference range) can have a serious health effect.
This study has several strengths. Firstly, as a cross-sectional study on serum γGT levels of male workers exposed to lead at a steel mill, this study is a relatively large-scale study examining worker exposure to lead. Most of the studies focusing on an exposure to lead and on serum γGT levels are based on big data (such as those generated by the NHANES or the KoNEHS that target the general population). Large-scale studies on workers being occupationally exposed to lead are rare, but this study covered more than 1,000 workers to evaluate the association between the BLLs and serum γGT levels in Korea. Secondly, most of the studies on the association between BLLs and serum γGT levels for workers compared the subjects in the lead-exposed and nonexposed group, but this study was conducted only with lead-exposed workers. In addition, the drinking status (an important factor that can affect serum γGT levels) was relatively accurately and quantitatively calculated and corrected by using the alcohol type, the dose of alcohol consumed, and the drinking frequency based on the NIAAA guideline.18 Lastly, in this study, BLL was used as an indicator of the exposure to lead; considering that lead in the blood has a biological half-life of approximately 40 days in males, BLLs reflect recent as well as continuous chronic exposure to lead, because lead accumulated in the bone is balanced.48
There are some limitations to this study. Firstly, this study is a cross-sectional study using the annual health examination data for workers collected over just 1 year (2020), and only confirming the relationship between an exposure to lead and serum γGT levels. As a result, the study cannot easily investigate the exact causal relationship between these two factors. Secondly, information regarding issues such as underlying diseases (like chronic obstructive pulmonary disease) that can affect the dependent variable of the serum γGT level,17 or the drinking status of steelworkers several days before the examination, could not be collected. Moreover, drinking status was investigated using a self-reported questionnaire, which may have underestimated and reported workers’ drinking status.49 Further, this study is based only on men working in one steel mill, so additional studies are required to generalize this study’s results to the entire population. Finally, in this study, 99.3% of the subjects were exposed to hepatotoxic substances such as dimethylformamide, methyl isobutyl ketone, 2-butoxyethanol, xylene, toluene, phenols, hydrazine, and copper occupationally at the work site, and the measurement results of these substances were “not detected” or within the reference range according to TLV of ACGIH, but the exposure level of individual workers varied from person to person and could not be adjusted. Further studies that consider co-exposure to hepatotoxic substances are needed.
The CDC have updated the blood lead reference range for children from 5.0 to 3.5 μg/dL in 2021.15 The CDC’s Adult Blood Lead Epidemiology and Surveillance defines a level of lead toxicity in adults at 10 μg/dL or above, and the case definition for an elevated BLL in workers at 5 μg/dL or above.5 In contrast, in Korea, the BLL reference range is still set at 30 μg/dL in the workers’ health examination practice guidelines.3 Considering the changes in international standards and the absence of an absolute safety reference for lead toxicity, it is necessary to readjust the BLL reference range of workers in Korea.
As described above, although the results of this study are consistent with the results of many previous studies, this study has occupational health value because there are rare large-scale studies that only selected workers exposed to lead occupationally. To generalize the result of this study, research on the reference range of serum γGT level as an indicator of oxidative stress as well as on the vulnerable group is needed.
CONCLUSIONS
This study shows that an occupational exposure to low concentrations of lead within the reference range can lead to the establishment of BLLs that are related to serum γGT levels. As there are no absolute safety standards for lead toxicity, efforts to reduce exposure to lead should be continued. Moreover, further studies are required to evaluate the association between exposure to low concentrations of lead and oxidative stress and the resulting health effects.
ACKNOWLEDGEMENTS
The authors thank Mr. Nam Hun Heo, Department of Clinical trial center, Soonchunhyang University Hospital, Choenan, Korea for his statistical assistance and Enago (www.enago.co.kr) for the English language review.
Abbreviations
ACGIH
American Conference of Governmental Industrial Hygienists
AM
arithmetic mean
ANOVA
analysis of variance
BLL
blood lead level
BMI
body mass index
CDC
Centers for Disease Control and Prevention
CI
confidence interval
Cd
cadmium
GM
geometric mean
KoNEHS
Korean National Environmental Health Survey
γGT
gamma-glutamyl transpeptidase
HBV
hepatitis B virus
HCV
hepatitis C virus
Hg
mercury
NHANES
National Health and Nutrition Examination Survey
NIAAA
National Institute on Alcohol Abuse and Alcoholism
OR
odds ratio
ROS
reactive oxygen species
SD
standard deviation
SE
standard error
T
blood lead level tertile
TLV
threshold limit value
USG
ultrasonography
-
Funding: This research was supported by the Soonchunhyang University Research Fund.
-
Competing interests: The authors declare that they have no competing interests.
-
Author contributions:
NOTES
- 1. Sohn HS. Current status of lead smelting and recycling. Resources Recycling 2019;28(4):3–14.
- 2. Dobrakowski M, Pawlas N, Kasperczyk A, Kozłowska A, Olewińska E, Machoń-Grecka A, et al. Oxidative DNA damage and oxidative stress in lead-exposed workers. Hum Exp Toxicol 2017;36(7):744–754. 27596070.ArticlePubMedPDF
- 3. Korea Occupational Safety & Healthy Agency. Workers’ health checkup practice guidelines. Updated 2022]. Accessed March 10, 2022]. https://www.kosha.or.kr/kosha/data/mediaBankMain.do .
- 4. Agency for Toxic Substances and Disease Registry. Lead toxicity. Updated 2019]. Accessed March 10, 2022]. https://www.atsdr.cdc.gov/csem/leadtoxicity/safety_standards.html .
- 5. Centers for Disease Control (CDC). Prevention. Adult blood lead epidemiology and surveillance (ABLES). Updated 2021]. Accessed on March 11, 2022]. https://www.cdc.gov/niosh/topics/ables/ReferenceBloodLevelsforAdults.html .
- 6. Kim DW, Ock J, Moon KW, Park CH. Association between Pb, Cd, and Hg exposure and liver injury among Korean adults. Int J Environ Res Public Health 2021;18(13):6783. 34202682.ArticlePubMedPMC
- 7. Tsoi MF, Cheung CL, Cheung TT, Cheung BM. Continual decrease in blood lead level in Americans: United States National Health Nutrition and Examination Survey 1999-2014. Am J Med 2016;129(11):1213–1218. 27341956.ArticlePubMed
- 8. Lee JW, Choi H, Hwang UK, Kang JC, Kang YJ, Kim KI, et al. Toxic effects of lead exposure on bioaccumulation, oxidative stress, neurotoxicity, and immune responses in fish: a review. Environ Toxicol Pharmacol 2019;68:101–108. 30884452.ArticlePubMed
- 9. Teschke R, Brand A, Strohmeyer G. Induction of hepatic microsomal gamma-glutamyltransferase activity following chronic alcohol consumption. Biochem Biophys Res Commun 1977;75(3):718–724. 16594.ArticlePubMed
- 10. Sheehan M, Haythorn P. Predictive values of various liver function tests with respect to the diagnosis of liver disease. Clin Biochem 1979;12(6):262–263. 43785.ArticlePubMed
- 11. Dalton TP, Chen Y, Schneider SN, Nebert DW, Shertzer HG. Genetically altered mice to evaluate glutathione homeostasis in health and disease. Free Radic Biol Med 2004;37(10):1511–1526. 15477003.ArticlePubMed
- 12. Pompella A, Visvikis A, Paolicchi A, De Tata V, Casini AF. The changing faces of glutathione, a cellular protagonist. Biochem Pharmacol 2003;66(8):1499–1503. 14555227.ArticlePubMed
- 13. Lee DH, Blomhoff R, Jacobs DR Jr. Is serum gamma glutamyltransferase a marker of oxidative stress? Free Radic Res 2004;38(6):535–539. 15346644.PubMed
- 14. Lim JS, Yang JH, Chun BY, Kam S, Jacobs DR Jr, Lee DH. Is serum gamma-glutamyltransferase inversely associated with serum antioxidants as a marker of oxidative stress? Free Radic Biol Med 2004;37(7):1018–1023. 15336318.PubMed
- 15. Centers for Disease Control (CDC) and Prevention. CDC updates blood lead reference value to 3.5 µg/dL. Updated 2022]. Accessed on March 5, 2022]. https://www.cdc.gov/nceh/lead/news/cdc-updates-blood-lead-reference-value.html .
- 16. Kunutsor SK, Abbasi A, Adler AI. Gamma-glutamyl transferase and risk of type II diabetes: an updated systematic review and dose-response meta-analysis. Ann Epidemiol 2014;24(11):809–816. 25263236.ArticlePubMed
- 17. Mistry D, Stockley RA. Gamma-glutamyl transferase: the silent partner? COPD 2010;7(4):285–290. 20673038.ArticlePubMed
- 18. National Institute on Alcohol Abuse and Alcoholism. Helping patients who drink too much: a clinician’s GUIDE. Updated 2016]. Accessed January 12, 2022]. https://pubs.niaaa.nih.gov/publications/practitioner/cliniciansguide2005/guide.pdf .
- 19. Jung JG, Kim JS, Yoon SJ, Lee S, Ahn SK. Korean alcohol guidelines for primary care Physician. Korean J Fam Pract 2021;11(1):14–21.Article
- 20. Ministry of Health and Welfare. The physical activity guide for Korean. Updated 2013]. Accessed March 10, 2022]. http://www.mohw.go.kr/react/jb/sjb030301vw.jsp?PAR_MENU_ID=03&MENU_ID=032901&CONT_SEQ=337139 .
- 21. Ministry of Health and Welfare. Notice. The criteria for health checkup of Korean. Partial revision. Accessed March 10, 2022]. http://www.law.go.kr .
- 22. Puukka K, Hietala J, Koivisto H, Anttila P, Bloigu R, Niemelä O. Age-related changes on serum GGT activity and the assessment of ethanol intake. Alcohol Alcohol 2006;41(5):522–527. 16855003.ArticlePubMed
- 23. Agarwal S, Fulgoni VL 3rd, Lieberman HR. Assessing alcohol intake & its dose-dependent effects on liver enzymes by 24-h recall and questionnaire using NHANES 2001-2010 data. Nutr J 2016;15(1):62. 27334005.ArticlePubMedPMCPDF
- 24. Breitling LP, Raum E, Müller H, Rothenbacher D, Brenner H. Synergism between smoking and alcohol consumption with respect to serum gamma-glutamyltransferase. Hepatology 2009;49(3):802–808. 19152425.ArticlePubMed
- 25. Park EY, Lim MK, Oh JK, Cho H, Bae MJ, Yun EH, et al. Independent and supra-additive effects of alcohol consumption, cigarette smoking, and metabolic syndrome on the elevation of serum liver enzyme levels. PLoS One 2013;8(5):e63439. 23667618.ArticlePubMedPMC
- 26. Lee DH, Lim JS, Song K, Boo Y, Jacobs DR Jr. Graded associations of blood lead and urinary cadmium concentrations with oxidative-stress-related markers in the U.S. population: results from the third National Health and Nutrition Examination Survey. Environ Health Perspect 2006;114(3):350–354. 16507456.ArticlePubMedPMC
- 27. Obeng-Gyasi E. Lead exposure and oxidative stress-a life course approach in U.S. adults. Toxics 2018;6(3):E42.ArticlePubMedPMC
- 28. Xu Z, Zheng Z, Gao X. Operation optimization of the steel manufacturing process: a brief review. Int J Miner Metall Mater 2021;28(8):1274–1287.ArticlePDF
- 29. Mousavian NA, Mansouri N, Nezhadkurki F. Estimation of heavy metal exposure in workplace and health risk exposure assessment in steel industries in Iran. Measurement 2017;102:286–290.Article
- 30. Korean Statistical Information Service. Blood lead levels. Updated 2022]. Accessed September 15, 2022]. https://kosis.kr/statHtml/statHtml.do?orgId=106&tblId=DT_106N_99_1100052&vw_cd=MT_OTITLE&list_id=106_002_002&scrId=&seqNo=&lang_mode=ko&obj_var_id=&itm_id=&conn_path=MT_OTITLE&path=%252FstatisticsList%252FstatisticsListIndex.do .
- 31. Muntner P, Menke A, DeSalvo KB, Rabito FA, Batuman V. Continued decline in blood lead levels among adults in the United States: the National Health and Nutrition Examination Surveys. Arch Intern Med 2005;165(18):2155–2161. 16217007.ArticlePubMed
- 32. Ruiz-Hernandez A, Navas-Acien A, Pastor-Barriuso R, Crainiceanu CM, Redon J, Guallar E, et al. Declining exposures to lead and cadmium contribute to explaining the reduction of cardiovascular mortality in the US population, 1988-2004. Int J Epidemiol 2017;46(6):1903–1912. 29025072.ArticlePubMedPMC
- 33. Afridi HI, Kazi TG, Jamali MK, Kazi GH, Arain MB, Jalbani N, et al. Evaluation of toxic metals in biological samples (scalp hair, blood and urine) of steel mill workers by electrothermal atomic absorption spectrometry. Toxicol Ind Health 2006;22(9):381–393. 17533809.ArticlePubMedPDF
- 34. Choi JW, Kim NS, Cho KS, Ham JO, Lee BK. The change of air lead concentrations in litharge making and smelting industries. J Korean Soc Occup Environ Hyg 2010;20(1):10–18.
- 35. Obeng-Gyasi E. Cholesterol and oxidative stress in U.S. pregnant women exposed to lead. Med Sci (Basel) 2019;7(3):E42.ArticlePubMedPMC
- 36. Ajeel MA, Ajeel AA, Nejres AM, Salih RA. Assessment of heavy metals and related impacts on antioxidants and physiological parameters in oil refinery workers in Iraq. J Health Pollut 2021;11(31):210907. 34434599.ArticlePubMedPMCPDF
- 37. Mazumdar I, Goswami K. Chronic exposure to lead: a cause of oxidative stress and altered liver function in plastic industry workers in Kolkata, India. Indian J Clin Biochem 2014;29(1):89–92. 24478556.ArticlePubMedPMCPDF
- 38. Khan DA, Qayyum S, Saleem S, Khan FA. Lead-induced oxidative stress adversely affects health of the occupational workers. Toxicol Ind Health 2008;24(9):611–618. 19106128.ArticlePubMedPDF
- 39. Al-Neamy FR, Almehdi AM, Alwash R, Pasha MA, Ibrahim A, Bener A. Occupational lead exposure and amino acid profiles and liver function tests in industrial workers. Int J Environ Health Res 2001;11(2):181–188. 11382350.ArticlePubMed
- 40. Joo Y, Kwon YM, Kim SY, Choi K, Lee C, Yu SD, et al. A study on heavy metals exposure and major sociodemographic influence factors among Korean Adults - Korean National Environmental Health Survey (2009-2017). J Environ Health Sci 2019;45(5):541–555.
- 41. Choi W, Kim S, Baek YW, Choi K, Lee K, Kim S, et al. Exposure to environmental chemicals among Korean adults-updates from the second Korean National Environmental Health Survey (2012-2014). Int J Hyg Environ Health 2017;220(2 Pt A):29–35.Article
- 42. Jung SK, Choi W, Kim SY, Hong S, Jeon HL, Joo Y, et al. Profile of environmental chemicals in the Korean population-results of the Korean National Environmental Health Survey (KoNEHS) cycle 3, 2015-2017. Int J Environ Res Public Health 2022;19(2):626. 35055445.ArticlePubMedPMC
- 43. Lanphear BP, Rauch S, Auinger P, Allen RW, Hornung RW. Low-level lead exposure and mortality in US adults: a population-based cohort study. Lancet Public Health 2018;3(4):e177–e184. 29544878.ArticlePubMed
- 44. Menke A, Muntner P, Batuman V, Silbergeld EK, Guallar E. Blood lead below 0.48 micromol/L (10 microg/dL) and mortality among US adults. Circulation 2006;114(13):1388–1394. 16982939.ArticlePubMed
- 45. Tsoi MF, Lo CW, Cheung TT, Cheung BM. Blood lead level and risk of hypertension in the United States National Health and Nutrition Examination Survey 1999-2016. Sci Rep 2021;11(1):3010. 33542319.ArticlePubMedPMCPDF
- 46. Kim Y, Lee BK. Associations of blood lead, cadmium, and mercury with estimated glomerular filtration rate in the Korean general population: analysis of 2008-2010 Korean National Health and Nutrition Examination Survey data. Environ Res 2012;118:124–129. 22749111.ArticlePubMed
- 47. Harari F, Sallsten G, Christensson A, Petkovic M, Hedblad B, Forsgard N, et al. Blood lead levels and decreased kidney function in a population-based cohort. Am J Kidney Dis 2018;72(3):381–389. 29699886.ArticlePubMed
- 48. Alarcon WA. State Adult Blood Lead Epidemiology and Surveillance (ABLES) Program Investigators. Elevated blood lead levels among employed adults—United States, 1994-2013. MMWR Morb Mortal Wkly Rep 2016;63(55):59–65. 27736830.PubMed
- 49. Northcote J, Livingston M. Accuracy of self-reported drinking: observational verification of ‘last occasion’ drink estimates of young adults. Alcohol Alcohol 2011;46(6):709–713. 21949190.ArticlePubMed
REFERENCES
REFERENCES
Figure & Data
REFERENCES
Citations
Citations to this article as recorded by 
- Association of heavy metal exposure, C-reactive protein, and stroke risk in US adults: A cross-sectional analysis (NHANES 2005–2008)
Yanli Cui, Juan Gao, Jing Zhang, Jing Li, Ziwen Wang, Xin Zhang, Yujing Ma
Medicine.2026; 105(24): e48203. CrossRef - Occupational Lead Exposure Among Civilian Indoor Shooting Range Workers in Korea: A Report of Blood Lead Levels and Airborne Lead
Sungjin Park, Jaeyoung Park, Bumjoon Lee, Yi-Ryoung Lee, Jiho Kim, Younmo Cho, Hyeongyeong Choi, Kyeongyeon Kim
Journal of Korean Medical Science.2025;[Epub] CrossRef - Association Between Low-Level Lead Exposure and Serum Gamma-Glutamyl Transferase Concentrations as a Biomarker of Oxidative Stress in U.S. Adolescents Aged 12–19 Years
Wenping Hu, Tanya T. LeBlanc, Audrey F. Pennington, Cheryl R. Cornwell, Paul B. Allwood
International Journal of Environmental Research and Public Health.2025; 23(1): 28. CrossRef - The Association Between Blood Lead Levels and Urgency Urinary Incontinence Among Adult Females: A Retrospective Study Based on NHANES 2005–2020
Junwei Wang, Cunming Zhang, Aiwei Zhang
Biological Trace Element Research.2024; 203(7): 3630. CrossRef - The Association Between Blood Lead Levels and Coronary Artery Calcium Score Determined by Using Coronary Computed Tomography Angiography
Eunyoung Park, Suwhan Kim, Seunghyeon Cho, Hyeonjun Kim, Inho Jung, Jai-Dong Moon, Won-Ju Park
Journal of Korean Medical Science.2023;[Epub] CrossRef
 Cite
CiteThe health effects of low blood lead level in oxidative stress as a marker, serum gamma-glutamyl transpeptidase level, in male steelworkers
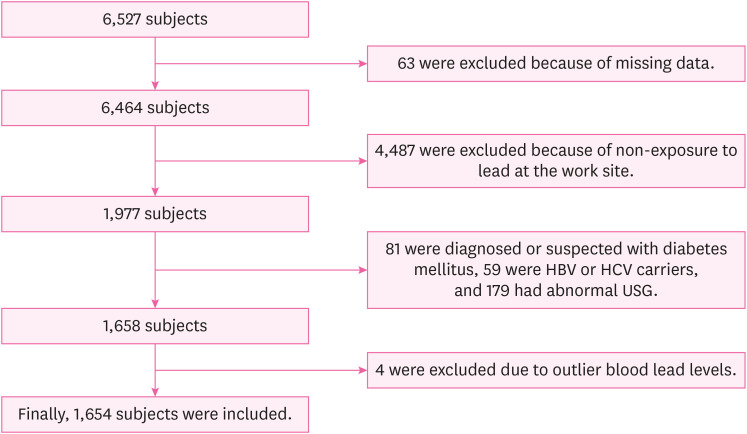

Fig. 1 Flowchart of the inclusion process in the study population.HBV: hepatitis B virus; HCV: hepatitis C virus; USG: ultrasonography.
Fig. 2 OR (95% CI) for having elevated serum γGT levels according to BLLs after covariate adjustment.Model 1 was crude model; Model 2 was adjusted for age, body mass index, smoking status, drinking status and physical activity; Model 3 was adjusted for age, body mass index, smoking status, drinking status, physical activity, shift work, working period, co-exposure to mercury or cadmium, and co-exposure to hepatotoxic substances.BLL: blood lead level; CI: confidence interval; γGT: gamma-glutamyl transpeptidase; OR: odds ratio; T: blood lead level tertile.
Fig. 1
Fig. 2
The health effects of low blood lead level in oxidative stress as a marker, serum gamma-glutamyl transpeptidase level, in male steelworkers
| Variables | No. (%) | BLL (μg/dL) | Serum γGT level | |||||
|---|---|---|---|---|---|---|---|---|
| AM (95% CI) | GM (95% CI) | AM (95% CI) | GM (95% CI) | |||||
| Total | 1,654 (100.0) | 1.49 (1.46–1.52) | 1.36 (1.33–1.39) | 36.64 (34.90–38.37) | 27.72 (26.81–28.66) | |||
| Tertiles of BLL(μg/dL) | < 0.001a | |||||||
| T1 (0.1–1.1) | 515 (31.1) | 0.85 (0.84–0.87) | 0.82 (0.80–0.84) | 28.99 (26.87–31.10) | 23.15 (21.93–24.43) | |||
| T2 (1.2–1.6) | 584 (35.3) | 1.39 (1.38–1.40) | 1.38 (1.37–1.39) | 35.99 (33.09–38.88) | 27.39 (25.92–28.95) | |||
| T3 (1.7–4.6) | 555 (33.6) | 2.21 (2.15–2.24) | 2.15 (2.11–2.18) | 44.43 (40.84–48.02) | 33.17 (31.24–35.22) | |||
| Age (yr) | < 0.001a | < 0.001a | ||||||
| 22–29 | 151 (9.1) | 1.28 (1.19–1.38) | 1.16 (1.08–1.25) | 25.81 (22.18–29.45) | 20.79 (18.89–22.89) | |||
| 30–39 | 823 (49.8) | 1.37 (1.33–1.41) | 1.25 (1.21–1.29) | 35.71 (33.33–38.09) | 27.36 (26.12–28.65) | |||
| 40–49 | 408 (24.7) | 1.61 (1.55–1.67) | 1.49 (1.43–1.55) | 40.81 (37.03–44.59) | 30.49 (28.43–32.69) | |||
| 50–66 | 272 (16.4) | 1.82 (1.74–1.90) | 1.70 (1.62–1.78) | 39.21 (34.48–43.94) | 29.32 (26.95–31.89) | |||
| AM ± SE | 39.7 ± 0.21 (SD: 8.63) | |||||||
| BMI (kg/m2) | 0.020a | < 0.001a | ||||||
| < 23 | 327 (19.8) | 1.43 (1.36–1.50) | 1.29 (1.23–1.36) | 26.36 (23.71–29.01) | 21.19 (19.85–22.62) | |||
| 23–25 | 483 (29.2) | 1.48 (1.42–1.54) | 1.35 (1.30–1.40) | 34.37 (30.99–37.75) | 25.74 (24.23–27.34) | |||
| ≥ 25 | 844 (51.0) | 1.53 (1.48–1.57) | 1.40 (1.36–1.44) | 41.92 (39.38–44.47) | 32.08 (30.61–33.63) | |||
| Smoking | < 0.001a | < 0.001a | ||||||
| Never-smokers | 632 (38.2) | 1.31 (1.27–1.36) | 1.20 (1.16–1.24) | 28.39 (26.17–30.60) | 22.34 (21.28–23.46) | |||
| Ex-smokers | 522 (31.6) | 1.54 (1.49–1.60) | 1.42 (1.37–1.47) | 37.94 (34.90–40.98) | 29.16 (27.52–30.90) | |||
| Smokers | 500 (30.2) | 1.67 (1.61–1.73) | 1.53 (1.47–1.59) | 45.71 (41.99–49.43) | 34.51 (32.42–36.75) | |||
| Drinking | < 0.001a | < 0.001a | ||||||
| No | 205 (12.4) | 1.37 (1.29–1.45) | 1.24 (1.16–1.20) | 25.54 (22.27–28.81) | 20.55 (18.94–22.30) | |||
| < 112 g/week | 1,058 (64.0) | 1.48 (1.45–1.52) | 1.36 (1.32–1.39) | 34.75 (32.75–36.76) | 26.64 (25.58–27.74) | |||
| ≥ 112 g/week | 391 (23.6) | 1.58 (1.51–1.65) | 1.44 (1.38–1.51) | 47.56 (43.12–52.01) | 36.09 (33.64–38.71) | |||
| Physical activity | 0.674a | 0.001a | ||||||
| No | 263 (15.9) | 1.45 (1.39–1.52) | 1.35 (1.29–1.42) | 43.64 (37.89–49.38) | 31.60 (28.87–34.59) | |||
| Little | 309 (18.7) | 1.53 (1.45–1.61) | 1.39 (1.32–1.46) | 38.23 (34.08–42.37) | 29.37 (27.25–31.66) | |||
| Yes | 1,082 (65.4) | 1.49 (1.45–1.53) | 1.36 (1.32–1.39) | 34.49 (32.57–36.40) | 26.41 (25.36–27.50) | |||
| Shift work | ||||||||
| No | 1,020 (61.7) | 1.46 (1.42–1.5) | 1.32 (0.29–1.36) | 0.001b | 36.22 (34.18–38.26) | 27.92 (26.78–29.11) | 0.587b | |
| Yes | 634 (38.3) | 1.55 (1.50–1.60) | 1.43 (1.38–1.47) | 37.31 (34.19–40.44) | 27.39 (25.91–28.96) | |||
| Working period (yr) | < 0.001a | 0.001a | ||||||
| < 5 | 87 (5.3) | 1.18 (1.07–1.29) | 1.07 (0.96–1.18) | 25.34 (21.94–28.75) | 21.72 (19.36–24.38) | |||
| 5–10 | 682 (41.2) | 1.37 (1.32–1.42) | 1.25 (1.21–1.30) | 34.27 (31.79–36.76) | 26.13 (24.83,27.50) | |||
| > 10 | 885 (53.5) | 1.62 (1.57–1.66) | 1.49 (1.44–1.53) | 36.57 (36.99–42.15) | 29.71 (28.36–31.12) | |||
| Co-exposure to Hg or Cd | 0.318b | 0.159b | ||||||
| No | 50 (3.0) | 1.56 (1.38–1.74) | 1.49 (1.29–1.62) | 43.04 (30.29–55.79) | 31.74 (25.79–39.06) | |||
| Yes | 1,604 (97.0) | 1.49 (1.46–1.52) | 1.36 (1.33–1.39) | 36.44 (34.69–38.19) | 27.60 (26.68–28.55) | |||
| Co-exposure to hepatotoxic substancesc | 0.579b | 0.305b | ||||||
| No | 11 (0.7) | 1.32 (1.04–1.59) | 1.27 (1.04–1.55) | 33.00 (9.03–56.97) | 22.39 (12.62–39.73) | |||
| Yes | 1,643 (99.3) | 1.49 (1.46–1.53) | 1.36 (1.33–1.39) | 36.66 (34.92–38.40) | 27.75 (26.84–28.70) | |||
| Subgroups | N (%) | Model 1 (crude) | Model 2 | Model 3 | ||||
|---|---|---|---|---|---|---|---|---|
| β (95% CI) | β (95% CI) | β (95% CI) | ||||||
| Total | 1,654 (100.0) | 0.326 (0.252–0.399) | < 0.001 | 0.176 (0.103–0.249) | < 0.001 | 0.172 (0.099–0.245) | < 0.001 | |
| Drinking | ||||||||
| < 112 g/week | 1,263 (76.4) | 0.285 (0.204–0.367) | < 0.001 | 0.172 (0.091–0.254) | < 0.001 | 0.170 (0.088–0.253) | < 0.001 | |
| ≥ 112 g/week | 391 (23.6) | 0.364 (0.204–0.524) | < 0.001 | 0.224 (0.081–0.407) | 0.004 | 0.246 (0.082–0.410) | 0.003 | |
| Body mass index (kg/m2) | ||||||||
| < 25 | 810 (49.0) | 0.322 (0.255–0.419) | < 0.001 | 0.208 (0.106–0.310) | < 0.001 | 0.222 (0.120–0.224) | < 0.001 | |
| ≥ 25 | 844 (51.0) | 0.290 (0.182–0.397) | < 0.001 | 0.167 (0.060–0.273) | 0.002 | 0.173 (0.065–0.281) | 0.002 | |
| Age (yr) | ||||||||
| < 40 | 974 (58.9) | 0.311 (0.217–0.405) | < 0.001 | 0.169 (0.079–0.259) | < 0.001 | 0.156 (0.066–0.246) | 0.001 | |
| ≥ 40 | 680 (41.1) | 0.302 (0.172–0.432) | < 0.001 | 0.197 (0.073–0.322) | 0.002 | 0.199 (0.073–0.324) | 0.002 | |
| Drinking and smoking | ||||||||
| Normal drinking, non-current smoker | 934 (56.5) | 0.239 (0.149–0.328) | < 0.001 | 0.170 (0.079–0.260) | < 0.001 | 0.169 (0.078–0.260) | < 0.001 | |
| Heavy drinking, non-current smoker | 220 (13.3) | 0.423 (0.199–0.646) | < 0.001 | 0.340 (0.115–0.565) | 0.003 | 0.340 (0.114–0.566) | 0.003 | |
| Normal drinking, current smoker | 329 (19.9) | 0.254 (0.074–0.433) | 0.006 | 0.224 (0.016–0.041) | 0.016 | 0.218 (0.035–0.402) | 0.020 | |
| Heavy drinking, current smoker | 171 (10.3) | 0.248 (0.010–0.486) | 0.041 | 0.178 (−0.068–0.425) | 0.155 | 0.172 (−0.080–0.423) | 0.180 | |
Table 1 Distribution of BLLs and serum γGT levels according to the characteristics of the study population
AM: arithmetic mean; BLL: blood lead level; BMI: body mass index; Cd: cadmium; CI: confidence interval; GM: geometric mean; Hg: mercury; γGT: gamma-glutamyl transpeptidase; SD: standard deviation; SE: standard error; T: blood lead level tertile.
aCalculated by an analysis of variance; bCalculated by a Student’s t-test; cDimethylformamide, methyl isobutyl ketone, 2-butoxyethanol, xylene, toluene, phenols, hydrazine and copper.
Table 2 Multiple linear regression analyses to reveal the association between ln BLLs and ln serum γGT levels
Model 1 was a crude model; Model 2 was adjusted for age, body mass index, smoking status, drinking status, and physical activity; Model 3 was adjusted for age, body mass index, smoking status, drinking status, physical activity, shift work, working period, co-exposure to mercury or cadmium, and co-exposure to hepatotoxic substances.
BLL: blood lead level; CI: confidence interval; γGT: gamma glutamyl transpeptidase.

