Abstract
-
Background
This study aimed to investigate the characteristics of work-related musculoskeletal disorders (WRMSDs) in occupational disease claims and identify patterns of WRMSDs for each body part by industry and occupation.
-
Methods
This study analyzed the raw data of occupational disease claims for musculoskeletal disorders deliberated by the Occupational Disease Decision Committee of the Korea Workers’ Compensation & Welfare Service in 2020. The data was classified into 6 body parts with the highest numbers of occupational disease cases by using the complete enumeration data on principal diagnoses and 4 types of subdiagnoses in the raw data. The characteristics and approval rates of WRMSDs by body part, industry and occupation were examined and summarized.
-
Results
A total of 13,015 occupational disease cases for WRMSDs were classified, and lumbar spinal (back) diseases accounted for the largest proportion of claimed diseases, followed by shoulder, elbow, wrist, knee, and neck diseases in a descending order. The occupations with the highest and second highest numbers of occupational disease cases by body part were found to be automobile assemblers and production-related elementary workers for the neck, school meal service workers and cooks for the back, construction frame mold carpenters and school meal service workers for the shoulder, elementary workers in mining and food service workers for the elbow, food service workers and automobile parts assemblers for the wrist, and ship welders and school meal service workers for the knee.
-
Conclusions
This study examined the characteristics and approval status of WRMSDs by body part and occupation. Based on the study results, management strategies for the prevention of WRMSDs should be established regarding occupations with a high risk of WRMSDs for each body part.
-
Keywords: Work-related musculoskeletal disorders; Approval status; Occupation; Industry
BACKGROUND
Musculoskeletal disorders are diseases that occur in the musculoskeletal system, and they are functional disorders resulting from the accumulation of microscopic damage to muscle or tissue. Work-related musculoskeletal disorders (WRMSDs) occur mainly in some parts of the body, such as the lower back, shoulder, elbow, wrist, and knee. They are known to be caused by simple repetitive work motions, uncomfortable work postures, excessive use of force, vibration, touch stress, and thermal conditions as a result of the development of industrial technology and mechanization. The occurrence of WRMSDs affects the physical activities of workers, reducing their quality of life, and also results in the loss of labor due to sickness absence, a decrease in the quality of work, an increase in the compensation costs of industrial accidents, thereby causing many social and economic problems.
1,2 With the abolition of the employer seal system in 2018, the number of industrial accident claims, including claims for both work-related accidents and occupational diseases, increased by 29.7% from 113,716 cases in 2017 to 147,512 cases in 2020. Among them, the number of occupational disease claims increased by 87.3% from 5,127 cases in 2017 to 9,601 cases in 2020. In addition, the total number of occupational disease claims for musculoskeletal disorders was 9,601 out of a total of 14,816 occupational disease claim cases in 2020, accounting for 64.8%, so the proportion of musculoskeletal disorders was highest among the total occupational diseases.
3,4
However, despite such a high proportion of musculoskeletal disorders, there is a limited amount of statistical data on WRMSDs, and it is difficult to gain information on specific diseases included in WRMSDs and their characteristics. The analysis report on the status of industrial accidents published annually by the Ministry of Employment and Labor provides data on musculoskeletal disorders classified by industry, company size, sex, and age, but the disease classification of the data is limited to 4 categories: physically burdensome tasks, non-accidental back pain, accidental back pain, and carpal tunnel syndrome (CTS). Therefore, it is difficult to get concrete information on the current status of the occurrence of musculoskeletal disorders for each specific disease and for each body part. In addition, in Korea, studies on musculoskeletal disorders have been mostly focused on the prevalence and risk factors of them in some occupations.
5,6 Although some studies were conducted using data on occupational disease compensation,
7,8 research was limited to specific parts of the body or the characteristics of musculoskeletal disorders by sex were investigated.
9 In short, previous studies did not provide an adequate analysis of frequently occurring musculoskeletal disorders by body part or occupations with a high prevalence or a high risk for specific musculoskeletal disorders. A similar situation exists in foreign studies on WRMSDs.
10,11
Therefore, this study aimed to investigate WRMSDs as occupational diseases among industrial accidents by using the raw data of occupational disease claims for musculoskeletal disorders reviewed by the Occupational Disease Decision Committee of the Korea Workers’ Compensation and Welfare Service in 2020 in order to identify general characteristics of WRMSDs by industry and occupation, claim diagnoses by body part, and the status of occupational disease cases and the prevalence of WRMSDs by occupation. Through this investigation, this study intended to provide basic data for the prevention of musculoskeletal disorders in consideration of WRMSDs with a high prevalence for each body part and the improvement of the industrial accident compensation system.
METHODS
Subjects
This study used data of a total of 9,925 claims of musculoskeletal disorders deliberated by the Occupational Disease Decision Committee of the Korea Workers’ Compensation and Welfare Service from January 1 to December 31 in 2020 to investigate the characteristics and approval status of WRMSDs. Total claims were counted based on the date finally determined after deliberation in 2020.
Contents of data
The study data from the Korea Workers’ Compensation and Welfare Service included personal information of industrial accident victims (sex, age, and date of the first medical examination), work-related information (industry name, industry type code, occupation title, occupation type code, and date of employment), disease-related data (names of the principal diagnosis and subdiagnosis of occupational disease cases, and injury site), and data on industrial accident investigation and deliberation (industrial accident investigation report, occupational disease decision report, and approval status).
Reclassification and analysis of data
In order to analyze the characteristics of WRMSDs, data was classified into 6 body parts with the highest numbers of occupational disease cases by using the complete enumeration data on the principal diagnoses and 4 types of subdiagnoses. Regarding the classification of diagnoses, when an individual made an occupational disease claim for a cervical spine disorder alone, it was classified as 1 case of cervical spine disorder. Meanwhile, when an individual filed an occupational disease claim for a total of 4 kinds of diagnoses, including a cervical spine disorder as the principal diagnosis and shoulder impingement syndrome, meniscus tear, and knee osteoarthritis as subdiagnoses, the case was classified as a total of 4 cases of WRMSDs (1 case of cervical spine disorder, 1 case of shoulder disorder, and 2 cases of knee disorder), although one occupational disease claim was made by a single applicant.
The sex, age, and working duration of applicants and the approval rates of occupational disease cases by body part were examined. The types of industries and occupations of the 2020 raw data from the Korea Workers’ Compensation and Welfare Service were described according to the occupation codes of the industrial accident compensation insurance and the 7th Korean Standard Classification of Occupations. In this study, industry types were analyzed using the industry type data of the raw data. However, in the case of types of occupations, the occupation classification method used by the Korea Workers’ Compensation and Welfare Service has some limitations in that it does not reflect tasks performed by workers and the contents of jobs because occupations have been classified based on the types of industries and occupations of employer companies. In addition, since there were cases of misclassification, industrial accident investigation reports and occupational disease decision reports were checked one by one to reclassify occupational titles according to the actual jobs of applicants, and this reclassified data was used to analyze occupations. However, if classification is conducted by more than one person, there may be differences in classification criteria, so an occupational and environmental medicine physician performed classification according to a single classification criterion, and when a worker performed multiple jobs, classification was made using the job that had the longest working duration and was most closely related to the onset of disease. The working duration was defined as the period of employment for the reclassified job contents. The frequency, approval rate, and average working duration were examined in top 20 occupations with the highest numbers of occupational disease cases regarding 2 WRMSDs with the highest and second highest numbers of cases for each body part.
Ethics statement
This study used only a de-identified database disclosed to the public without personal identification information; therefore, neither approval by the Institutional Review Board nor obtainment of the informed consent is necessary.
RESULTS
General characteristics and approval status of occupational disease claims
Occupational disease claims for WRMSDs 9,925 deliberated by the Occupational Disease Decision Committee of the Korea Workers’ Compensation and Welfare Service in 2020 were reclassified according to body parts, and the analysis results of the reclassified data are shown in
Table 1. A total of 13,015 cases were classified and analyzed. With respect to body parts affected by WRSMDs, lumbar spine diseases (a total of 4,155 cases) accounted for the largest proportion, followed by the shoulder, elbow, wrist, knee, and cervical spine diseases. Regarding the sex distribution of applicants, the proportion of males (76.6%) was higher than that of females, and the number of males was about 3–4.5 times higher than that of females. The mean age of the total applicants was 52.5 years, and in relation to the age distribution of applicants for each body part, overall, the number of cases increased with the increase of age. In the case of shoulder diseases, people aged 60 to 69 accounted for almost half of the applicants, but for diseases of other body parts, people aged 50 to 59 made up the largest proportion. In terms of working duration, the number of cases increased with the decrease of working duration, showing an inversely proportional relation. However, when working duration exceeded 30 years, the number of cases started to increase again, so the number of cases according to working duration showed a reverse J-shaped distribution. The average working duration of the total applicants was 142.6 months, a period close to 12 years, and the approval rate of a total of 13,015 cases was 66.2%, showing that more than half of the cases were approved.
Table 1The characteristics of work-related musculoskeletal diseases by the parts of the body
|
Variables |
Categories |
Neck |
Back |
Shoulder |
Elbow |
Wrist |
Knee |
Total |
|
Total |
|
704 |
4,155 |
3,820 |
1,770 |
1,408 |
1,158 |
13,015 |
|
Sex |
Male |
575 (81.7) |
3,447 (83.0) |
3,016 (79.0) |
1,360 (76.8) |
771 (54.8) |
818 (70.6) |
9,987 (76.7) |
|
Female |
129 (18.3) |
708 (17.0) |
804 (21.0) |
410 (23.2) |
637 (45.2) |
340 (29.4) |
3,028 (23.3) |
|
Age (year) |
20–30 |
4 (0.6) |
178 (4.3) |
20 (0.5) |
15 (0.8) |
146 (10.4) |
18 (1.6) |
381 (2.9) |
|
30–40 |
55 (7.8) |
599 (14.4) |
153 (4.0) |
149 (8.4) |
278 (19.7) |
109 (9.4) |
1,343 (10.3) |
|
40–50 |
166 (23.6) |
1,006 (24.2) |
570 (14.9) |
544 (30.7) |
346 (24.6) |
226 (19.5) |
2,858 (22.0) |
|
50–60 |
261 (37.1) |
1,311 (31.6) |
1,336 (35.0) |
604 (34.1) |
429 (30.5) |
431 (37.2) |
4,372 (33.6) |
|
> 60 |
218 (31.0) |
1,061 (25.5) |
1,741 (45.6) |
458 (25.9) |
209 (14.9) |
374 (32.3) |
4,061 (31.2) |
|
Average age (year) |
|
53.8 ± 9.7 |
50.3 ± 10.4 |
56.8 ± 9.1 |
52.3 ± 9.4 |
46.6 ± 11.8 |
53.3 ± 10.1 |
52.5 ± 8.7 |
|
WD (year) |
0–5 |
177 (25.1) |
1,704 (41.0) |
880 (23.0) |
495 (28.0) |
624 (44.3) |
254 (21.9) |
4,134 (31.8) |
|
5–10 |
132 (18.8) |
832 (20.0) |
920 (24.1) |
310 (17.5) |
316 (22.4) |
255 (22.0) |
2,765 (21.2) |
|
10–15 |
105 (14.9) |
632 (15.2) |
719 (18.8) |
337 (19.0) |
198 (14.1) |
246 (21.2) |
2,237 (17.2) |
|
15–20 |
107 (15.2) |
401 (9.7) |
423 (11.1) |
200 (11.3) |
126 (8.9) |
140 (12.1) |
1,397 (10.7) |
|
20–25 |
57 (8.1) |
236 (5.7) |
240 (6.3) |
124 (7.0) |
64 (4.5) |
80 (6.9) |
801 (6.2) |
|
25–30 |
58 (8.2) |
151 (3.6) |
204 (5.3) |
101 (5.7) |
41 (2.9) |
56 (4.8) |
611 (4.7) |
|
> 30 |
68 (9.7) |
199 (4.8) |
434 (11.4) |
203 (11.5) |
39 (2.8) |
127 (11.0) |
1,070 (8.0) |
|
Average WD (month) |
|
167.2 ± 125.1 |
119.7 ± 102.2 |
161.3 ± 123.7 |
158.1 ± 131.0 |
101.0 ± 72.0 |
161.35 ± 118.8 |
142.65 ± 112.4 |
|
Median WD (month) |
|
135 |
88 |
129 |
128 |
72 |
132 |
113 |
|
AR (%) |
|
34.2 |
55.6 |
78.5 |
77.4 |
65.3 |
62.8 |
65.8 |
Approval status of occupational disease cases by body part and industry
Table 2 shows the analysis results of occupational disease cases for each body part by industry. For most parts of the body, the number of occupational disease cases was highest in the manufacturing industry, and only the number of occupational disease cases for the wrist was higher in other industries. Since the number of occupational disease cases of the manufacturing industry was highest for most body parts, the approval rates for each body part in the manufacturing industry were also similar or higher than the average approval rates for each body part. The construction industry had the third highest number of occupational disease cases, making up 14% of the total number of occupational disease cases, but this type of industry showed the highest approval rate in comparison with other industries. With respect to approval rates by body part, approval rates for shoulder and elbow disorders were 78.5% and 77.4%, respectively, higher than the average approval rate, and approval rates for the diseases of the neck (cervical spine) and the lower back (lumbar spine), 2 spinal regions, were 34.2% and 56.8%, respectively, lower than the average approval rate. The analysis results of the approval status of occupational disease cases by body part are shown in
Table 3.
Table 2The work-related musculoskeletal diseases by the type of industry
|
Industries |
Neck |
Back |
Shoulder |
Elbow |
Wrist |
Knee |
Total |
|
Cases |
AR (%) |
Cases |
AR (%) |
Cases |
AR (%) |
Cases |
AR (%) |
Cases |
AR (%) |
Cases |
AR (%) |
Cases |
AR (%) |
|
Manufacturing |
371 (52.7) |
39.6 |
1,727 (41.6) |
58.5 |
1,663 (43.5) |
80.4 |
833 (47.1) |
83.1 |
602 (42.8) |
72.1 |
511 (44.1) |
72.6 |
5,707 (43.4) |
69.9 |
|
Others |
172 (24.4) |
20.9 |
1,404 (33.8) |
49.4 |
1,089 (28.5) |
69.4 |
519 (29.3) |
69.1 |
623 (44.2) |
60.8 |
358 (30.9) |
39.1 |
4,165 (31.7) |
56.7 |
|
Construction |
84 (11.9) |
56.0 |
590 (14.2) |
65.7 |
714 (18.7) |
91.9 |
211 (11.9) |
84.7 |
90 (6.4) |
70.0 |
182 (15.7) |
83.0 |
1,871 (14.2) |
79.3 |
|
Transportation and storage |
51 (7.2) |
15.7 |
320 (7.7) |
51.9 |
156 (4.1) |
75.9 |
72 (4.1) |
63.4 |
54 (3.8) |
42.6 |
43 (3.7) |
65.1 |
696 (5.3) |
55.9 |
|
Mining and quarrying |
23 (3.3) |
13.0 |
80 (1.9) |
37.5 |
170 (4.5) |
61.5 |
123 (6.9) |
70.0 |
29 (2.1) |
48.3 |
55 (4.7) |
56.4 |
480 (3.6) |
56.0 |
|
Agriculture |
1 (0.1) |
0.0 |
24 (0.6) |
70.6 |
12 (0.3) |
91.7 |
4 (0.2) |
50.0 |
4 (0.3) |
75.0 |
4 (0.3) |
75.0 |
49 (0.4) |
73.4 |
|
Financial and insurance activities |
2 (0.3) |
0.0 |
6 (0.1) |
50.0 |
2 (0.1) |
50.0 |
5 (0.3) |
60.0 |
3 (0.2) |
33.3 |
|
|
18 (0.1) |
44.4 |
|
Forestry |
|
|
|
|
9 (0.2) |
100.0 |
2 (0.1) |
100.0 |
3 (0.2) |
100.0 |
3 (0.3) |
66.7 |
17 (0.1) |
94.1 |
|
Fishing and aquaculture |
|
|
2 (0.0) |
100.0 |
3 (0.1) |
66.7 |
|
|
|
|
2 (0.2) |
50.0 |
7 (0.1) |
71.4 |
|
Electricity, gas, steam and air conditioning supply |
|
|
2 (0.0) |
100.0 |
2 (0.1) |
100.0 |
1 (0.1) |
100.0 |
|
|
|
|
5 (0.0) |
100.0 |
|
Total |
704 |
34.2 |
4,155 |
55.6 |
3,820 |
78.5 |
1,770 |
77.4 |
1,408 |
65.3 |
1,158 |
62.8 |
13,155 |
65.8 |
Table 3The work-related musculoskeletal diseases by the parts of the body
|
Variables |
Categories |
Cases |
AR (%) |
Total |
|
Neck |
Herniated intervertebral disc |
556 (79.0) |
33.6 |
704 |
|
Spinal stenosis |
94 (13.4) |
37.2 |
|
Others |
54 (7.7) |
35.2 |
|
Back |
Herniated intervertebral disc |
2,468 (59.4) |
57.5 |
4,155 |
|
Sprain |
718 (17.3) |
57.0 |
|
Spinal stenosis |
621 (14.9) |
58.6 |
|
Spondylolisthesis |
186 (4.5) |
48.4 |
|
Others |
162 (3.9) |
48.8 |
|
Shoulder |
Rotator cuff syndrome |
2,702 (70.7) |
79.7 |
3,820 |
|
Impingement syndrome |
452 (11.8) |
82.5 |
|
Labral tear |
131 (3.4) |
76.3 |
|
Tendinitis |
110 (2.9) |
74.5 |
|
Others |
425 (11.1) |
68.2 |
|
Elbow |
Lateral epicondylitis |
920 (52.0) |
82.2 |
1,770 |
|
Medial epicondylitis |
283 (16.0) |
73.9 |
|
Tendon tear |
198 (11.2) |
80.8 |
|
Osteoarthritis |
79 (4.5) |
75.9 |
|
Ulnar neuropathy |
74 (4.2) |
73.0 |
|
Sprain |
49 (2.8) |
57.1 |
|
Synovitis |
31 (1.8) |
74.2 |
|
Others |
136 (7.6) |
58.8 |
|
Wrist |
Carpal tunnel syndrome |
452 (32.1) |
71.5 |
1,408 |
|
Triangular fibrocartilage complex injury |
232 (16.5) |
66.8 |
|
De ouervain syndrome |
120 (8.5) |
78.3 |
|
Ulnar impaction syndrome |
94 (6.7) |
73.4 |
|
Sprain |
93 (6.6) |
55.9 |
|
Synovitis |
78 (5.5) |
72.5 |
|
Tendinitis |
58 (4.1) |
56.9 |
|
Ganglion |
54 (3.8) |
53.7 |
|
Osteoarthritis |
52 (3.7) |
42.3 |
|
Tenosynovitis |
36 (2.6) |
80.6 |
|
Others |
139 (9.9) |
46.4 |
|
Knee |
Tear of meniscus |
548 (47.3) |
68.0 |
1,158 |
|
Osteoarthritis |
324 (28.0) |
64.0 |
|
Sprain |
36 (3.1) |
68.5 |
|
Ligament injury |
34 (2.9) |
43.3 |
|
Others |
36 (3.1) |
44.7 |
Approval status of occupational diseases cases by body part and occupation
With respect to top 2 occupational diseases for each body part among cases of occupational disease cases, top 20 occupations with the highest numbers of occupational disease cases, approval rates and the average working duration were examined.
In the case of disorders of the neck or cervical spine, occupational disease cases for herniated intervertebral disc and cervical spinal stenosis were analyzed, and occupations with a high number of occupational disease cases were production-related elementary workers, automobile assemblers, and clerks. Regarding the approval rates for herniated intervertebral disc, occupations with a high approval rate were ship welders (61.6%), construction frame mold carpenters (60.0%), and automobile assembly/chassis/parts assembly/modification workers (46.7%). The approval rates of production-related elementary workers and clerks were 19.4% and 13.0%, respectively, showing lower approval rates compared to the number of occupational disease cases.
As for lumbar spine disorders, occupational disease cases for herniated intervertebral disc and lumbar spinal stenosis were analyzed, and it was found that occupations with the highest numbers of occupational disease cases were school meal service workers, cooks, construction frame mold carpenters, ship welders, and carers. Regarding approval rates, approval rates for herniated intervertebral disc were 78.9% in construction frame mold carpenters, 77.5% in general welders, and 74.1% in ship welders, showing higher approval rates than the average approval rate for the total lumbar spine disorders. Although a high number of occupational disease cases were made by cooks and careers, these occupations showed low approval rates of 46.3% and 48.8%, respectively.
As to shoulder diseases, occupational disease cases for rotator cuff tear and shoulder impingement syndrome were analyzed. The occupations with the highest number of occupational disease cases were construction frame mold carpenters, school meal service workers, elementary workers in mining, and cooks. The approval rates were as high as 94.4% in construction frame mold workers, 88.4% in ship welders, and 86.0% in school meal service workers. The approval rates of cooks and building cleaners were 68.5% and 65.1%, respectively, showing lower values than the average approval rate.
In the case of elbow disorders, occupational disease cases for lateral epicondylitis and medial epicondylitis were examined. The occupations with a high number of occupational disease cases were elementary workers in mining, school meal service workers, cooks of general restaurants, and loading and lifting elementary workers. The occupations with a high approval rate were construction frame mold carpenters and automobile parts assemblers. Although elementary workers in mining showed the highest number of occupational disease cases (104 cases), this occupation had a lower approval rate than the average approval rate for the elbow region.
Regarding wrist diseases, occupational disease cases for CTS and triangular fibrocartilage complex injury were examined. The occupations with a high number of occupational disease cases for these disorders were school meal service workers, cooks, automobile parts assemblers, and automobile assemblers. The approval rate tended to be high in automobile assemblers and loading and lifting elementary workers as well as food-related fields, such as school meal service workers and food processing industry.
In the case of knee diseases, occupational disease cases for meniscus tear and knee osteoarthritis were analyzed, and occupations with a high number of occupational disease cases were ship welders, school meal service workers, ship painters, and elementary workers in mining. Occupations related to ship building showed a very high approval rate with 100% for ship painters and 93.2% for ship welders (
Tables 4,
5,
6,
7,
8,
9).
Table 4The top 20 occupations with the highest numbers of WRMSDs in neck
|
Occupations |
Total cases |
Cervical HIVD |
Cervical canal stenosis |
|
Cases |
AR (%) |
Average WD (month) |
Cases |
AR (%) |
Average WD (month) |
|
Automobile assemblers |
36 |
30 |
46.7 |
220.3 ± 120.1 |
6 |
66.7 |
275.5 ± 122.3 |
|
Production related elementary workers |
35 |
31 |
19.4 |
109.2 ± 105.5 |
4 |
50.0 |
224.0 ± 136.4 |
|
Clerks |
29 |
23 |
13.0 |
91.5 ± 100.5 |
6 |
0.0 |
162.8 ± 157.3 |
|
Elementary workers in mining |
22 |
21 |
9.5 |
294.2 ± 95.3 |
1 |
0.0 |
354.0 |
|
Welders in shipyard |
21 |
18 |
61.1 |
274.2 ± 124.9 |
3 |
33.3 |
203.0 ± 144.9 |
|
Metal processing machine operators |
20 |
19 |
42.1 |
156.8 ± 112.1 |
1 |
100.0 |
113.0 |
|
Loading and lifting elementary workers |
19 |
17 |
17.6 |
83.8 ± 56.3 |
2 |
50.0 |
176.0 ± 75.0 |
|
Cooks |
18 |
15 |
20.0 |
90.8 ± 83.4 |
3 |
33.3 |
142.7 ± 152.7 |
|
Health and medical related workers |
16 |
13 |
30.8 |
69.0 ± 66.2 |
3 |
33.3 |
77.3 ± 95.6 |
|
Bus drivers |
16 |
13 |
15.4 |
177.5 ± 75.9 |
3 |
0.0 |
124.3 ± 76.5 |
|
Other automobile drivers |
14 |
12 |
0.0 |
151.7 ± 96.7 |
2 |
0.0 |
265.5 ± 160.5 |
|
Frame mold carpenters in construction |
13 |
10 |
60.0 |
106.2 ± 71.4 |
3 |
66.7 |
118.3 ± 81.8 |
|
Building cleaners |
12 |
10 |
0.0 |
48.9 ± 42.2 |
2 |
0.0 |
25.5 ± 7.8 |
|
School & company meal service workers |
12 |
11 |
18.2 |
163.5 ± 69.3 |
1 |
0.0 |
160.0 |
|
Forklift operators |
11 |
10 |
50.0 |
181.1 ± 146.4 |
1 |
0.0 |
240.0 |
|
Tire production workers |
11 |
8 |
62.5 |
263.9 ± 103.0 |
3 |
66.7 |
295.0 ± 62.5 |
|
Grinders in shipyard |
11 |
8 |
62.5 |
235.1 ± 126.3 |
3 |
33.3 |
227.0 ± 102.8 |
|
Automobile parts assemblers |
10 |
8 |
50.0 |
160.6 ± 108.6 |
2 |
0.0 |
127.5 ± 173.2 |
|
Signalmen in shipyard |
10 |
9 |
22.2 |
251.7 ± 140.4 |
1 |
0.0 |
130.0 |
|
Automobile painters |
10 |
9 |
33.3 |
221.1 ± 110.3 |
1 |
0.0 |
309.0 |
Table 5The top 20 occupations with the highest numbers of WRMSDs in back
|
Occupations |
Total cases |
Lumbar HIVD |
Lumbar sprain |
|
Cases |
AR (%) |
Average WD (month) |
Cases |
AR (%) |
Average WD (month) |
|
School & company meal service workers |
114 |
85 |
67.1 |
121.5 ± 72.3 |
29 |
65.5 |
108.9 ± 85.6 |
|
Cooks |
85 |
67 |
46.3 |
53.6 ± 68.9 |
18 |
55.6 |
49.8 ± 86.1 |
|
Frame mold carpenters in construction |
75 |
57 |
78.9 |
113.6 ± 119.7 |
18 |
77.8 |
93.4 ± 55.9 |
|
Welders in shipyard |
60 |
58 |
74.1 |
178.8 ± 102.1 |
2 |
50.0 |
184.0 ± 45.3 |
|
Licensed caregivers |
60 |
43 |
48.8 |
50.7 ± 52.9 |
17 |
47.1 |
45.6 ± 40.7 |
|
Welders in manufacturing |
55 |
40 |
77.5 |
90.1 ± 75.0 |
15 |
80.0 |
85.8 ± 77.8 |
|
Garbage collectors |
53 |
35 |
65.7 |
108.9 ± 102.9 |
18 |
61.1 |
86.2 ± 86.5 |
|
Automobile assemblers |
49 |
36 |
58.3 |
194.2 ± 99.9 |
13 |
38.5 |
191.5 ± 119.1 |
|
Plumbers in construction |
46 |
36 |
66.7 |
100.3 ± 76.2 |
10 |
70.0 |
97.0 ± 53.2 |
|
Elementary workers in construction |
44 |
36 |
58.3 |
38.6 ± 48.7 |
8 |
50.0 |
21.8 ± 37.2 |
|
Production related elementary workers |
43 |
35 |
48.6 |
48.5 ± 61.6 |
8 |
37.5 |
37.8 ± 46.0 |
|
Fit-up workers in shipyard |
42 |
35 |
74.3 |
206.1 ± 124.7 |
7 |
71.4 |
166.3 ± 111.0 |
|
Building cleaners |
42 |
34 |
44.1 |
75.8 ± 60.2 |
8 |
37.5 |
76.9 ± 90.4 |
|
Bus drivers |
41 |
35 |
48.6 |
150.9 ± 90.9 |
6 |
50.0 |
96.8 ± 106.4 |
|
Building equipment operators |
36 |
29 |
37.9 |
117.0 ± 98.0 |
7 |
42.9 |
61.0 ± 24.2 |
|
Equipment, machine operating workers |
35 |
25 |
68.0 |
159.2 ± 119.4 |
10 |
50.0 |
142.1 ± 113.6 |
|
Elementary workers in mining |
31 |
30 |
50.0 |
224.6 ± 130.6 |
1 |
0.0 |
8.0 |
|
Electricians in construction |
31 |
24 |
66.7 |
101.0 ± 117.6 |
7 |
85.7 |
111.6 ± 119.6 |
|
Store sales workers |
29 |
19 |
63.2 |
99.0 ± 62.1 |
10 |
50.0 |
73.8 ± 59.8 |
|
Waste collectors |
25 |
22 |
59.1 |
66.8 ± 51.5 |
3 |
33.3 |
298.0 ± 161.7 |
Table 6The top 20 occupations with the highest numbers of WRMSDs in shoulder
|
Occupations |
Total cases |
Rotator cuff syndrome |
Shoulder impingement syndrome |
|
Cases |
AR (%) |
Average WD (month) |
Cases |
AR (%) |
Average WD (month) |
|
Frame mold carpenters in construction |
185 |
180 |
94.4 |
117.4 ± 66.6 |
5 |
80.0 |
104.2 ± 70.3 |
|
School & company meal service workers |
167 |
143 |
86.0 |
149.4 ± 83.6 |
24 |
95.8 |
161.0 ± 69.6 |
|
Welders in shipyard |
126 |
86 |
88.4 |
291.2 ± 140.0 |
40 |
90.0 |
324.3 ± 138.3 |
|
Elementary workers in mining |
109 |
83 |
73.5 |
283.5 ± 126.3 |
26 |
76.9 |
299.2 ± 140.2 |
|
Cooks |
105 |
92 |
68.5 |
89.7 ± 90.7 |
13 |
69.2 |
63.5 ± 48.6 |
|
Automobile assemblers |
69 |
51 |
86.3 |
255.3 ± 122.7 |
18 |
88.9 |
236.8 ± 103.6 |
|
Garbage collectors |
66 |
57 |
86.0 |
121.8 ± 85.4 |
9 |
100.0 |
93.1 ± 43.7 |
|
Building cleaners |
64 |
63 |
65.1 |
81.9 ± 58.6 |
1 |
0.0 |
128.0 |
|
Licensed caregivers |
58 |
51 |
70.6 |
72.0 ± 45.2 |
7 |
57.1 |
36.0 ± 29.4 |
|
Plasters |
57 |
53 |
100.0 |
142.3 ± 62.7 |
4 |
100.0 |
181.8 ± 151.8 |
|
Painters in shipyard |
55 |
35 |
85.7 |
169.3 ± 98.7 |
20 |
90.0 |
204.2 ± 146.9 |
|
Automobile mechanics |
54 |
49 |
98.0 |
205.3 ± 110.3 |
5 |
100.0 |
138.8 ± 106.4 |
|
Waste collectors |
54 |
48 |
91.7 |
131.0 ± 68.5 |
6 |
100.0 |
110.6 ± 67.7 |
|
Fit-up workers in shipyard |
52 |
38 |
84.2 |
270.1 ± 136.8 |
14 |
100.0 |
312.6 ± 131.9 |
|
Tire production workers |
49 |
39 |
89.7 |
296.1 ± 83.6 |
10 |
90.0 |
189.2 ± 111.1 |
|
Automobile parts assemblers |
40 |
32 |
81.3 |
239.9 ± 110.4 |
8 |
87.5 |
168.0 ± 117.9 |
|
Welders in manufacturing |
38 |
34 |
91.2 |
161.9 ± 111.2 |
4 |
100.0 |
237.5 ± 158.0 |
|
Plumbers in construction |
37 |
35 |
85.7 |
123.8 ± 86.0 |
2 |
100.0 |
92.0 ± 2.8 |
|
Grinders in shipyard |
37 |
25 |
100.0 |
145.6 ± 91.4 |
12 |
91.7 |
114.8 ± 108.6 |
|
Metal processing machine operators |
37 |
35 |
91.4 |
171.2 ± 120.9 |
2 |
50.0 |
178.5 ± 205.8 |
Table 7The top 20 occupations with the highest numbers of WRMSDs in elbow
|
Occupations |
Total cases |
Lateral epicondylitis |
Medial epicondylitis |
|
Cases |
AR (%) |
Average WD (month) |
Cases |
AR (%) |
Average WD (month) |
|
Elementary workers in mining |
104 |
79 |
65.8 |
315.1 ± 126.1 |
25 |
68.0 |
303.1 ± 122.6 |
|
School & company meal service workers |
56 |
35 |
85.7 |
128.1 ± 78.3 |
21 |
85.7 |
132.7 ± 74.2 |
|
Cooks |
53 |
42 |
85.7 |
62.2 ± 57.3 |
11 |
81.8 |
78.6 ± 47.5 |
|
Welders in shipyard |
45 |
36 |
86.1 |
251.0 ± 135.0 |
9 |
77.8 |
245.6 ± 78.0 |
|
Loading and lifting elementary workers |
45 |
34 |
82.4 |
85.6 ± 79.8 |
11 |
72.7 |
45.7 ± 67.5 |
|
Automobile parts assemblers |
41 |
31 |
93.5 |
172.3 ± 117.1 |
10 |
100.0 |
204.8 ± 86.7 |
|
Automobile assemblers |
37 |
28 |
85.7 |
208.0 ± 87.1 |
9 |
88.9 |
201.2 ± 105.9 |
|
Frame mold carpenters in construction |
29 |
20 |
95.0 |
128.4 ± 84.9 |
9 |
66.7 |
120.8 ± 73.1 |
|
Store sales workers |
28 |
22 |
81.8 |
79.4 ± 56.6 |
6 |
66.7 |
82.4 ± 59.3 |
|
Fit-up workers in shipyard |
26 |
22 |
81.8 |
222.6 ± 143.4 |
4 |
75.0 |
278.3 ± 138.8 |
|
Tire production workers |
25 |
19 |
100.0 |
243.1 ± 105.2 |
6 |
100.0 |
198.8 ± 59.6 |
|
Garbage collectors |
21 |
15 |
100.0 |
105.0 ± 67.1 |
6 |
100.0 |
79.8 ± 64.8 |
|
Welders in manufacturing |
20 |
16 |
93.8 |
138.1 ± 96.1 |
4 |
75.0 |
94.0 ± 68.5 |
|
Grinders in shipyard |
19 |
13 |
100.0 |
169.8 ± 74.3 |
6 |
100.0 |
127.2 ± 40.1 |
|
Building cleaners |
19 |
12 |
91.7 |
51.0 ± 51.2 |
7 |
71.4 |
74.4 ± 48.4 |
|
Automobile mechanics |
18 |
13 |
100.0 |
223.2 ± 112.0 |
5 |
100.0 |
159.6 ± 99.3 |
|
Product transporter |
16 |
10 |
90.0 |
97.4 ± 85.2 |
6 |
50.0 |
73.8 ± 57.1 |
|
Elementary workers in construction |
15 |
14 |
100.0 |
54.2 ± 76.7 |
1 |
100.0 |
8.0 |
|
Catering service workers |
14 |
11 |
90.9 |
33.9 ± 24.4 |
3 |
100.0 |
30.7 ± 12.4 |
|
Meat processors |
13 |
9 |
100.0 |
79.6 ± 60.2 |
4 |
75.0 |
76.0 ± 53.6 |
Table 8The top 20 occupations with the highest numbers of WRMSDs in wrist
|
Occupations |
Total cases |
Carpal tunnel syndrome |
TFCC injury |
|
Cases |
AR (%) |
Average WD (month) |
Cases |
AR (%) |
Average WD (month) |
|
School & company meal service workers |
62 |
52 |
92.3 |
139.8 ± 68.8 |
10 |
90.0 |
118.3 ± 49.7 |
|
Cooks |
59 |
43 |
62.8 |
60.4 ± 65.1 |
16 |
68.8 |
55.4 ± 54.2 |
|
Automobile parts assemblers |
26 |
19 |
57.9 |
140.8 ± 120.5 |
7 |
85.7 |
193.7 ± 124.0 |
|
Automobile assemblers |
25 |
7 |
85.7 |
197.9 ± 80.1 |
18 |
88.9 |
176.4 ± 80.4 |
|
Food processing workers |
23 |
17 |
70.6 |
82.9 ± 73.6 |
6 |
50.0 |
39.3 ± 39.2 |
|
Elementary workers in mining |
18 |
12 |
41.7 |
218.8 ± 110.0 |
6 |
66.7 |
261.0 ± 103.9 |
|
Catering service workers |
16 |
12 |
91.7 |
69.5 ± 75.6 |
4 |
25.0 |
28.0 ± 19.3 |
|
Kitchen helpers |
16 |
13 |
84.6 |
66.3 ± 45.8 |
3 |
33.3 |
25.0 ± 20.0 |
|
Clerks |
15 |
10 |
10.0 |
131.1 ± 62.8 |
5 |
40.0 |
124.0 ± 115.6 |
|
Loading and lifting elementary workers |
15 |
8 |
100.0 |
55.0 ± 53.8 |
7 |
28.6 |
20.0 ± 15.1 |
|
Store sales workers |
15 |
7 |
100.0 |
83.9 ± 74.5 |
8 |
75.0 |
91.6 ± 79.7 |
|
Production related elementary workers |
14 |
12 |
75.0 |
104.4 ± 82.7 |
2 |
50.0 |
105.5 ± 132.2 |
|
Hand packers |
14 |
11 |
81.8 |
109.9 ± 87.5 |
3 |
66.7 |
87.7 ± 62.5 |
|
Painters in shipyard |
10 |
10 |
70.0 |
166.5 ± 76.2 |
0 |
0.0 |
|
|
Welders in shipyard |
8 |
4 |
100.0 |
111.3 ± 70.4 |
4 |
100.0 |
173.0 ± 158.8 |
|
Building cleaners |
7 |
7 |
57.1 |
128.4 ± 86.8 |
0 |
0.0 |
|
|
Frame mold carpenters in construction |
7 |
6 |
83.3 |
113.7 ± 64.7 |
1 |
100.0 |
58.0 |
|
Automobile mechanics |
7 |
3 |
100.0 |
370.0 ± 17.3 |
4 |
75.0 |
203.3 ± 145.3 |
|
Dental hygienists |
6 |
5 |
100.0 |
77.2 ± 3.8 |
1 |
0.0 |
64.0 |
|
Metal processing machine operators |
6 |
5 |
60.0 |
106.4 ± 64.3 |
1 |
100.0 |
308.0 |
Table 9The top 20 occupations with the highest numbers of WRMSDs in knee
|
Occupations |
Total cases |
Tear of meniscus |
Knee osteoarthritis |
|
Cases |
AR (%) |
Average WD (month) |
Cases |
AR (%) |
Average WD (month) |
|
Welders in shipyard |
57 |
44 |
93.2 |
248.4 ± 129.8 |
13 |
69.2 |
304.2 ± 123.5 |
|
School & company meal service workers |
47 |
35 |
51.4 |
132.3 ± 73.1 |
12 |
41.7 |
161.0 ± 75.4 |
|
Painters in shipyard |
36 |
19 |
100.0 |
154.1 ± 90.8 |
17 |
82.4 |
162.7 ± 84.9 |
|
Elementary workers in mining |
36 |
13 |
69.2 |
311.9 ± 124.9 |
23 |
43.5 |
297.8 ± 112.2 |
|
Building cleaners |
31 |
18 |
27.8 |
90.0 ± 54.8 |
13 |
38.5 |
106.0 ± 57.2 |
|
Construction related technical workers |
30 |
19 |
78.9 |
81.3 ± 56.5 |
11 |
81.8 |
112.9 ± 63.7 |
|
Frame mold carpenters in construction |
29 |
19 |
100.0 |
142.9 ± 86.7 |
10 |
100.0 |
149.4 ± 67.7 |
|
Product transporter |
22 |
18 |
83.3 |
134.9 ± 151.5 |
4 |
75.0 |
149.7 ± 138.4 |
|
Fit-up workers in shipyard |
19 |
18 |
94.4 |
267.0 ± 117.3 |
1 |
100.0 |
294.7 ± 97.3 |
|
Cooks |
18 |
13 |
30.8 |
80.8 ± 76.9 |
5 |
20.0 |
95.1 ± 81.1 |
|
Garbage collectors |
18 |
15 |
60.0 |
122.8 ± 101.9 |
3 |
100.0 |
163.0 ± 131.3 |
|
Grinders in shipyard |
17 |
17 |
100.0 |
135.2 ± 90.0 |
0 |
0.0 |
|
|
Licensed caregivers |
16 |
15 |
33.3 |
72.6 ± 42.4 |
1 |
0.0 |
33.0 |
|
Welders in manufacturing |
15 |
11 |
90.9 |
173.4 ± 112.5 |
4 |
75.0 |
159.2 ± 123.0 |
|
Other automobile workers |
15 |
13 |
30.8 |
176.7 ± 112.6 |
2 |
50.0 |
205.7 ± 110.6 |
|
Plasters |
12 |
6 |
66.7 |
104.3 ± 58.8 |
6 |
83.3 |
134.6 ± 63.5 |
|
Plumbers in shipyard |
11 |
10 |
90.0 |
285.7 ± 138.0 |
1 |
100.0 |
359.0 |
|
Ship rig assemblers |
10 |
7 |
100.0 |
318.7 ± 122.0 |
3 |
66.7 |
250.0 ± 158.5 |
|
Other shipyard workers |
10 |
7 |
85.7 |
318.4 ± 130.9 |
3 |
66.7 |
311.9 ± 141.8 |
|
Construction stonemasons |
7 |
3 |
100.0 |
120.1 ± 114.0 |
4 |
100.0 |
122.5 ± 109.4 |
DISCUSSION
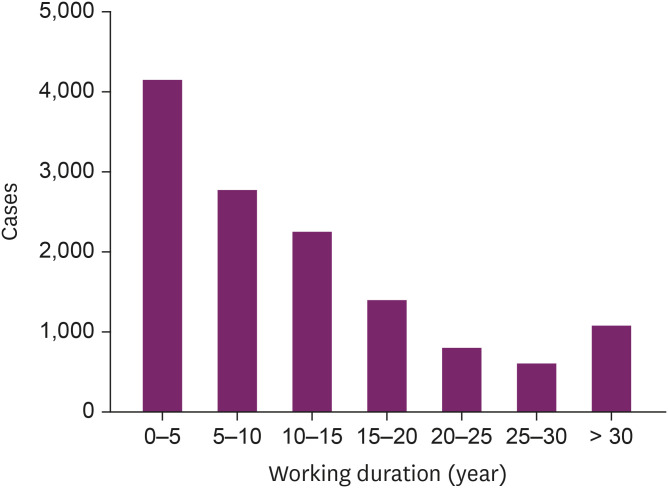
Analysis results showed that the proportion of men (76.7%) was higher than that of women (23.3%), and people aged 50 or older (61.3%) accounted for the majority of applicants. Regarding the working duration of applicants, the number of occupational disease cases was high during the first 5 years of employment, and decreased thereafter. However, when the working duration exceeded 30 years, the number of occupational disease cases started to increase again, so the number of occupational disease cases according to the working duration showed a reverse J-shaped distribution. A high number of occupational disease cases among people with a short working duration is thought to reflect the characteristics of diseases. In other words, since the development of medial or lateral epicondilitis, CTS, tendonitis or tendinitis does not take a lot of time, these diseases may occur in people with a short working duration. In addition, early occupational disease cases by workers with a short working duration may also be related to the fact that large corporations or workplaces with a labor union have a relatively freer atmosphere regarding the application for industrial accident compensation than small and medium-sized enterprises or workplaces without a labor union. Meanwhile, an increase in the number of occupational disease cases among people with 30 or more years of working duration is presumed to be due to the fact that workers tend to put off making an occupational disease claim and apply for compensation immediately before and after retirement (
Fig. 1).
Fig. 1 Number of cases according to working duration.
In terms of body parts related to occupational disease cases, lumbar spine diseases took up the largest proportion with 4,155 cases, followed by shoulder diseases. In the case of cervical spine diseases, herniated intervertebral disc was most common, and the approval rate for it was 33.6%, which was lower than the average approval rate of total occupational disease cases. The incidence of neck pain has been reported to be high among clerks, computer workers, workers in manufacturing, and healthcare workers.
12 In agreement with these findings, the results of this study showed that the number of occupational disease cases for neck pain was higher in manufacturing workers, such as automobile assemblers and ship welders, and clerks. A National Institute for Occupational Safety & Health study presented posture as strong evidence of work-relatedness,
13 and other previous studies also reported that poor posture significantly increases the risk.
14,15 In this study, occupations such as ship welders, construction frame mold carpenters, and automobile assemblers showed a higher approval rate than the average approval rate, and it is well known that these occupations are related to improper neck postures.
Among lumbar spine diseases, lumbar herniated intervertebral disc took up the highest percentage, and the approval rate was 57.5%, a lower rate than the average approval rate of total occupational disease cases. Herniated intervertebral disc occurs most frequently among people aged 30–50, relatively younger age groups.
16 In this study, the mean age of applicants of occupational disease cases for lumbar spinal disorders was 50.3 years. Although it was the second lowest value after the mean age for the wrist, it is difficult to make a direct comparison of mean ages between body parts because it is difficult to consider the mean age as the time of onset of disease. Work-related physical risk factors for musculoskeletal disorders in the lumbar region have been reported to be handling heavy objects, whole body vibration and unstable back posture, and work-related psychosocial risk factors have been identified as low job satisfaction, high job demands, low social support, and high perceived stress.
17 In this study, occupations such as school meal service workers, construction frame mold carpenters, and carers showed higher numbers of occupational disease cases, and the approval rate was higher in occupations such as construction frame mold carpenters, general welders, and ship welders. In the case of welders and construction frame mold carpenters, there is an agreement on the work relatedness of herniated intervertebral disc because their jobs frequently involve handling heavy objects and working in an unstable back posture. Compared to them, carers showed a lower approval rate than the average approval rate, and the lower approval rate of this occupation may have been affected by the fact that the mean age of carers is high, but their mean working duration is relatively short.
In the case of shoulder disorders, rotator cuff tear took up the largest percentage. The approval rate for rotator cuff tear was 79.7%, and this region had a high approval rate along with other diseases of the upper extremity. Occupations in construction and beauty industry and physical factors, such as sports activities involving raising arms above the head, lifting heavy objects, and repetitive movements in uncomfortable positions, are known to increase the risk for shoulder disorders.
18 In this study, most of the top 20 occupations had a high approval rate, and applicants in those occupations mostly had a relatively long working duration. In comparison, occupations with a relatively shorter working duration tended to show a slightly lower approval rate. A representative example is the occupation of building cleaners.
As for elbow-joint disorders, the number of occupational disease cases for lateral epicondylitis was highest, and the approval rate was a very high level of 82.2%. Generally, the prevalence of lateral epicondylitis is higher than that of medial epicondylitis, and the results of this study also confirmed the tendency. Battevi et al.
19 found that the prevalence of lateral epicondylitis was 0.3% in men and 0.2% in women among 749 adults aged 35 or older with occupations unrelated to the repetitive use of the upper extremities. However, Descatha et al.
20 reported that the prevalence of medial epicondylitis was 4%–5%, and its annual incidence rate was 1.5% among 1,757 workers excessively using the repetitive movements of the upper extremities, and repetitive movements were found to be a factor negatively affecting the prognosis of medial epicondylitis. As demonstrated by previous studies, the occurrence of lateral or medial epicondylitis is related to the use of the arm. In particular, combined factors (force, posture, and repetitiveness) have a high association with the disease in the case of jobs that require repetitively applying force with the elbow bent excessively or with the arm extended.
21 In agreement with previous studies, in this study, most of the top 20 occupations with higher levels of exposure to these factors, such as construction frame mold carpenters, ship welders, and school meal service workers, were found to have a high approval rate. However, elementary workers in mining had a lower approval rate compared to other occupations, and a factor affecting this lower approval rate is thought to be the tendency that miners tend to file occupational disease cases for musculoskeletal disorders 3 to 7 years after retirement.
With respect to wrist diseases, CTS had the highest proportion, and the average approval rate for it was 71.5%. The proportion of female applicants was higher than that of men. This result is consistent with previous research reporting that CTS is more common in women than men, and the prevalence of CTS is higher in elderly people than younger age groups.
22 A higher prevalence of CTS in women than in men is related to the fact that the diameter of the carpal tunnel of women is anatomically smaller than that of men, making women more vulnerable to CTS, and women’s hormonal changes due to menstruation, pregnancy, child-birth, and menopause are reported to be a risk factor increasing women’s vulnerability to CTS compared to men.
23,24 In this study, for CTS, school meal service workers, cooks, and automobile parts assemblers accounted for a large proportion of applicants of occupational disease cases, and this result can be attributed to the fact that these occupations are traditionally dominated by women. In particular, school meal food service consists of various tasks including pretreatment of foods before cooking, cooking, serving meals, washing the dishes, and cleaning the kitchen, which involve repetitive movements, uncomfortable postures, and the excessive use of force by the upper limbs. Also, the use of relatively heavy metal plates and cooking tools and high work intensity of kitchen cleaning for hygiene management are considered additional risk factors.
Regarding knee diseases, the number of occupational disease cases for meniscus tear was highest and the approval rate was 68.0%, which was similar to the average approval rate. Major occupational risk factors for knee diseases are known to be squatting,
25 male floor layers,
26 handling heavy objects and climbing stairs.
27 Similarly, in this study, occupations related to ship building such as ship welders and ship painters accounted for a large proportion of applicants for meniscus tear and showed a high approval rate, showing a similar tendency to the findings of previous studies. On the other hand, the approval rate tended to be very low in cases where workers generally work in a standing position as in the case of cooks or assembly line workers or in cases where workers have a high mean age and a short working duration as in the case of carers or building cleaners. These results showed that the approval rate for occupational disease cases for knee diseases is related to the frequency of squatting postures during work.
The study identified characteristics of WRMSDs as occupational diseases by using the complete enumeration data of industrial accident claims on WRMSDs in 2020. In particular, study results revealed specific diseases, occupations, and approval rates of occupational disease cases for WRMSDs by body part for 6 body parts. It is thought that these results can be utilized in the evaluation of work-relatedness of musculoskeletal disorders in the future and the prediction of the probability of approval of occupational disease cases for industrial accidents in the front line of handling such cases. In addition, high approval rates of specific occupations indicate that the occupations involve work putting an undue burden on the related body parts. Therefore, omission of on-site investigation for evaluation of work-relatedness for these occupations is thought to help to improve the procedure to process compensation claims for industrial accidents. However, it is regrettable that this data is still not related to the status of the occurrence of musculoskeletal disorders. Therefore, in follow-up studies, there is a need to conduct further research on the epidemiology of musculoskeletal disorders through data analysis that can estimate the occurrence of WRMSDs by matching health insurance data with employment insurance data.
CONCLUSIONS
The present study used total claims of WRMSDs deliberated by the Occupational Disease Decision Committee of the Korea Workers’ Compensation and Welfare Service in 2020, and the 6 body parts with the highest numbers of occupational disease cases were analyzed. So, the results are expected to help identify occupational differences in WRMSDs by body part and to know approval status and characteristics of WRMSDs in Korea. Also, unlike previous studies, this study classified the data by body parts with the highest numbers of occupational disease cases. Occupations and diseases with a large number of cases were organized according to the body part, showing the current status of WRMSDs among Korean workers in 2020. Further research is then needed to follow trend of occupational disease cases.
Abbreviations
herniated intervertebral disc
triangular fibrocartilage complex
work-related musculoskeletal disorder
NOTES
-
Funding: This research was supported by 2-year Research Grant Pusan National University (2021).
-
Competing interests: The authors declare that they have no competing interests.
-
Author Contributions:
Conceptualization: Kim Y, Kim I.
Data curation: Kim Y, Jung S, Lee I, Kim D, Choi E, Kim Y, Lee K, Kang Y, Kim H.
Investigation: Kim Y, Jung S, Lee I, Kim D, Choi E, Kim Y, Lee K, Kang Y, Kim H.
Writing - original draft: Cha E, Kim Y.
Writing - review & editing: Kim Y.
REFERENCES
REFERENCES
- 1. Kang D, Kim YK, Kim EA, Kim DH, Kim I, Kim HR, et al. Prevention of work-related musculoskeletal disorders. Ann Occup Environ Med 2014;26(1):14. 25089204.PubMedPMC
- 2. Jeong BY. Ergonomics’ role for preventing musculoskeletal disorders. J Ergon Soc Korea 2010;29(4):393–404.Article
- 3. Ministry of Employment and Labor. Analysis of industrial accidents in 2017. Updated 2018]. Accessed December 10, 2021].
http://www.moel.go.kr/
.
- 4. Ministry of Employment and Labor. Analysis of industrial accidents in 2020. Updated 2021]. Accessed December 10, 2021].
http://www.moel.go.kr/
.
- 5. Myong JP, Lee HK, Kim HR, Jung HS, Jeong EH, Nam W, et al. Musculo-skeletal symptoms of municipal sanitation workers and ergonomic evaluation on upperlimb. Korean J Occup Environ Med 2008;20(2):93–103.ArticlePDF
- 6. Kim MJ, Choi E. Occupational accident compensation insurance coverage and occupational accidents for special-type delivery workers. J Korean Acad Community Health Nurs 2021;32(1):64–72.ArticlePDF
- 7. Kim KS, Park JK, Kim DS. Status and characteristics of occurrence of work-related musculoskeletal disorders. J Ergon Soc Korea 2010;29(4):405–422.Article
- 8. Kim KH, Hwang RI, Suk MH. The trends and status of work-related musculoskeletal diseases under Korean worker’s compensation system. Korean J Occup Health Nurs 2013;22(2):102–111.Article
- 9. Hwang R, Kim KH, Suk MH, Jung SW. Gender differences in factors affecting musculoskeletal diseases among the Korean workers. J Muscle Joint Health 2014;21(1):65–74.Article
- 10. Bhattacharya A. Costs of occupational musculoskeletal disorders (MSDs) in the United States. Int J Ind Ergon 2014;44(3):448–454.Article
- 11. Wang X, Dong XS, Choi SD, Dement J. Work-related musculoskeletal disorders among construction workers in the United States from 1992 to 2014. Occup Environ Med 2017;74(5):374–380. 28039200.ArticlePubMed
- 12. Cohen SP. Epidemiology, diagnosis, and treatment of neck pain. Mayo Clin Proc 2015;90(2):284–299. 25659245.ArticlePubMed
- 13. Bernard BP. Musculoskelectal Disorders and Workplace Factors: A Critical Review of Epidemiologic Evidence for Work-Related Musculoskelectal Disorders of Neck, Upper Extremity, and Low Back. Cincinnati, OH, USA: National Institute for Occupational Safety and Health(NIOSH), U.S. Department of Health and Human Services; 1997.
- 14. Sluiter JK, Rest KM, Frings-Dresen MH. Criteria document for evaluating the work-relatedness of upper-extremity musculoskeletal disorders. Scand J Work Environ Health 2001;27(Suppl 1):1–102.Article
- 15. Kasumovic M, Gorcevic E, Gorcevic S, Osmanovic J. Cervical syndrome - the effectiveness of physical therapy interventions. Med Arh 2013;67(6):414–417.ArticlePubMedPMC
- 16. You JW. Lumbar disc disease. J Korean Soc Spine Surg 1999;6(2):208–219.
- 17. Boden SD, Davis DO, Dina TS, Patronas NJ, Wiesel SW. Abnormal magnetic-resonance scans of the lumbar spine in asymptomatic subjects. A prospective investigation. J Bone Joint Surg Am 1990;72(3):403–408. 2312537.ArticlePubMed
- 18. Woodward TW, Best TM. The painful shoulder: Part II. Acute and chronic disorders. Am Fam Physician 2000;61(11):3291–3300. 10865925.PubMed
- 19. Battevi N, Menoni O, Vimercati C. The occurrence of musculoskeletal alterations in worker populations not exposed to repetitive tasks of the upper limbs. Ergonomics 1998;41(9):1340–1346. 9754035.ArticlePubMed
- 20. Descatha A, Leclerc A, Chastang JF, Roquelaure Y. Study Group on Repetitive Work. Medial epicondylitis in occupational settings: prevalence, incidence and associated risk factors. J Occup Environ Med 2003;45(9):993–1001. 14506342.ArticlePubMedPMC
- 21. Shiri R, Viikari-Juntura E. Lateral and medial epicondylitis: role of occupational factors. Best Pract Res Clin Rheumatol 2011;25(1):43–57. 21663849.ArticlePubMed
- 22. Franklin GM, Friedman AS. Work-related carpal tunnel syndrome: diagnosis and treatment guideline. Phys Med Rehabil Clin N Am 2015;26(3):523–537. 26231963.PubMed
- 23. Keir PJ, Rempel DM. Pathomechanics of peripheral nerve loading. Evidence in carpal tunnel syndrome. J Hand Ther 2005;18(2):259–269. 15891983.PubMed
- 24. Winn FJ Jr, Habes DJ. Carpal tunnel area as a risk factor for carpal tunnel syndrome. Muscle Nerve 1990;13(3):254–258. 2181299.ArticlePubMed
- 25. Hong CY, Lee CG, Kim DH, Cho YS, Kim KY, Ryu SY, et al. Work-related risk factors of knee meniscal tears in Korean farmers: a cross-sectional study. Saf Health Work 2020;11(4):485–490. 33329915.ArticlePubMedPMC
- 26. Rytter S, Jensen LK, Bonde JP, Jurik AG, Egund N. Occupational kneeling and meniscal tears: a magnetic resonance imaging study in floor layers. J Rheumatol 2009;36(7):1512–1519. 19411395.ArticlePubMed
- 27. Snoeker BA, Bakker EW, Kegel CA, Lucas C. Risk factors for meniscal tears: a systematic review including meta-analysis. J Orthop Sports Phys Ther 2013;43(6):352–367. 23628788.ArticlePubMed

 , Sae-mi Jung1

 Cite
Cite

