
Articles
- Page Path
- HOME > Ann Occup Environ Med > Volume 34; 2022 > Article
- Original Article Poor worker’s long working hours paradox: evidence from the Korea National Health and Nutrition Examination Survey, 2013-2018
-
Min Young Park1
 , Jaeyoung Park1, Jun-Pyo Myong1, Hyoung-Ryoul Kim1, Dong-Wook Lee2, Mo-Yeol Kang1
 -
Annals of Occupational and Environmental Medicine 2022;34:e2.
DOI: https://doi.org/10.35371/aoem.2022.34.e2
Published online: February 14, 2022
1Department of Occupational and Environmental Medicine, Seoul St. Mary’s Hospital, College of Medicine, The Catholic University of Korea, Seoul, Korea.
2Public Health Center, Seoul National University Hospital, Seoul, Korea.
- Correspondence: Mo-Yeol Kang. Department of Occupational and Environmental Medicine, Seoul St. Mary’s Hospital, College of Medicine, The Catholic University of Korea, 222 Banpo-daero, Seocho-gu, Seoul 06591, Korea. snaptoon@naver.com
• Received: August 21, 2021 • Accepted: January 25, 2022
Copyright © 2022 Korean Society of Occupational & Environmental Medicine
This is an Open Access article distributed under the terms of the Creative Commons Attribution Non-Commercial License (https://creativecommons.org/licenses/by-nc/4.0/) which permits unrestricted non-commercial use, distribution, and reproduction in any medium, provided the original work is properly cited.
Abstract
-
Background Because income and working hours are closely related, the health impact of working hours can vary according to economic status. This study aimed to investigate the relationship between working hours and the risk of poor self-rated health according to household income level.
-
Methods We used the data from the Korea National Health and Nutrition Examination Survey VI and VII. The information on working hours and self-rated health was obtained from the questionnaire. After stratifying by household income level, the risk of poor self-rated health for long working hour group (≥ 52 hours a week), compared to the 35–51 working hour group as a reference, were calculated using multiple logistic regression.
-
Results Long working hours increased the risk of poor self-rated health in the group with the highest income, but not in the group with the lowest income. On the other hand, the overall weighted prevalence of poor self-rated health was higher in the low-income group.
-
Conclusions The relationship between long working hours and the risk of poor self-rated health varied by household income level. This phenomenon, in which the health effects of long working hours appear to diminish in low-income households can be referred to as the ‘poor worker’s long working hours paradox’. Our findings suggest that the recent working hour restriction policy implemented by the Korean government should be promoted, together with a basic wage preservation to improve workers’ general health and well-being.
BACKGROUND
It has been a significant amount of time since Korea was identified as a leading country with long working hours among Organization for Economic Cooperation and Development (OECD) countries. In the 2021 OECD report, the average Korean was found to work 1,908 hours per year, ranking fourth after Colombia (2,172 hours), Mexico (2,124 hours), and Costa Rica (1,913 hours).1 The adverse effects of long working hours on health have been revealed in many previous studies. Long working hours can increase the risk of mental health problems such as depression, anxiety, alcohol consumption, or sleep disorders.2,3,4 In addition, long working hours are associated with metabolic syndrome, coronary artery disease, and stroke,5,6,7 and have been reported to increase the number of occupational injuries.8
Economists view the labor supply as a matter of assessing the opportunity cost for various activities that can fill an individual’s available time and choosing an allocation method. In other words, if workers choose to work more, they earn more but have less leisure time; thus, decisions are made in the direction of maximizing personal utility.9 In general, the longer an individual’s working hours, the higher the wages they receive. However, if wages are above a certain level, the purchasing power is not significantly affected, even if the working hours are reduced. Therefore, the willingness to work decreases, and eventually, a reduction in working hours and an increase in leisure time are chosen. This phenomenon is termed the backwards bending labor supply curve in labor economics. From a health economics point of view, leisure and rest are considered investments in health. Because income and working hours are closely related, the health impact of working hours can vary according to economic status.10,11,12
Although many previous studies have investigated the association between long working hours and health status, income level has been considered only a confounding factor. This is because it has been widely believed that the magnitude of influence of long working hours depends solely on working hours, regardless of the economic status of workers. Although it is more reasonable from an economic perspective that the value of a product, including time, depends on demand and experiencing marginal utility, it has been overlooked in previous studies on the health effects of long working hours. In fact, in a recent study conducted in Korea, it was reported that the risk of cardiovascular diseases due to long working hours increased significantly only in male workers with the highest income.13 This raises the need for further research on how and why income differences affect the health effects of long working hours.
Self-rated health (SRH) has been widely used as a surrogate variable for actual health conditions, such as diagnosed diseases, hospitalization, or experienced accidents.14,15,16 Despite its subjective nature, SRH has proven to be a good predictor of future health care needs and mortality.17 Several studies have explored the association between working hours and SRH. It has been found that long working hours are related to poor SRH, especially in women.18,19 In addition, high educational level, managerial and professional occupations, and precarious work schedules could affect the association between long working hours and poor SRH as moderating factors.20 However, in most studies, income level has not been considered in depth. Therefore, this study aimed to investigate the relationship between working hours and SRH according to household income level using nationally representative population-based surveys in Korea.
METHODS
This study was conducted in compliance with the premises of the Strengthening the Reporting of Observational Studies in Epidemiology (STROBE) statement.21
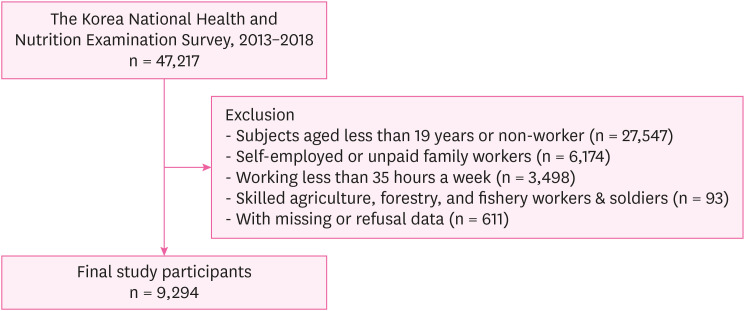
This study was based on nationally representative data obtained from the sixth and seventh Korea National Health and Nutrition Examination Survey (KNHANES VI and VII), 2013–2018, Korea Centers for Disease Control and Prevention. A total of 47,217 participants were enrolled, derived from a systematic, stratified, cluster-sampling procedure based on the National Census Registry. The current study investigated adult paid workers, excluding those who worked less than 35 hours a week (n = 3,498). Skilled agriculture, forestry, and fishery workers; soldiers (n = 93); and individuals who had missing data or declined to respond (n = 611) were also excluded. A total of 9,294 participants were included in this study (Fig. 1).
Working hours were assessed by the following question on the KHANES: ‘What are the average weekly working hours, including overtime, and excluding meal times?’ Working hours were classified into 2 groups: i) 35–51 hours and ii) 52 hours or more. This classification is based on the fact that the maximum weekly working hours, regulated by the Korean Labor Standards Act since 2018, is 52 hours.22 In addition, the regulations of the Korea Workers’ Compensation and Welfare Service stipulate that if the weekly working hours exceed 52 hours, the longer the working hours, the higher the risk of cerebrovascular and cardiovascular disease.23 Participants working less than 35 hours a week were excluded from the current study because their characteristics could be completely different from those of general workers. A reduction in working hours might be due to old age, childcare, or health problems, or as a result of precarious employment.
SRH is a widely used five-point Likert scale assessment on subjective health perception, which is used as a predictor of a general health condition or mortality.24,25,26 Participants were asked to evaluate their health as “very good,” “good,” “fair,” “poor” and “very poor.” In the current study, those who reported “very good,” “good” and “fair” were defined as good SRH, whereas “poor” or “very poor” were classified as poor SRH.
The study participants were classified into four groups (low, low-medium, medium-high, and high) according to the quartile of EHI, which is gross household income divided by the square root of household size. This square root scale was adopted in recent OECD publications,27 out of many scales, to compare household income levels across countries. The guidelines for KNHANES provide the standard amount of income quartiles of sample households every year, and the study participants were classified into each EHI group using the standard amount of the year of participation in the study.
Marital status was classified into three groups: married, unmarried, or others (widowed, separated, or divorced), and education level was divided into four groups: elementary, middle, high school, and college or higher. In terms of employment status, those who responded as being temporary or daily workers were defined as precarious workers. According to the Korean Standard Classification of Occupations, the occupations were categorized as follows: white-collar workers (managers, professionals, technicians, and associated professionals), blue-collar workers (crafts and related trades, plant and machine operators and assemblers, and elementary occupations), or pink-collar workers (clerical support, service, and sales workers).28 Smoking status was classified into three categories: none, past, and current. Participants who had smoked fewer than 100 cigarettes or had never smoked in their lifetime were classified as non-smokers. Problematic drinking was grouped into 2 groups (yes or no). Problematic drinkers were defined as those who consumed seven or more glasses of alcoholic beverages for men and 5 or more glasses for women, and drank more than twice a week. Disease states, such as hypertension, diabetes, and depression, were evaluated using physical examination, diagnosis, and treatment.
The demographics of the study population and the weighted prevalence of poor SRH, calculated using the integrated weights estimated from the KNHANES’s sampling design, are described. Chi-square tests were used to assess the relationships between participants’ SRH and other variables (age, sex, marital status, education level, EHI, occupation, employment status, weekly working hours, type of work schedule, smoking, drinking, hypertension, diabetes mellitus, and depression). The odds ratio (OR) and 95% confidence interval (CI) of poor SRH for the long working hour group (≥ 52 hours per week), compared to the 35–51 working hour group as a reference, were calculated using multiple logistic regression. After the following three types of models were constructed, multiple logistic regression was performed, adjusting for the relevant variables. Model 1 was adjusted for age, sex, and marital status, and Model 2 was adjusted for age, sex, marital status, education, occupation, employment status, and shift work. Model 3 included smoking, drinking, hypertension, diabetes, and depression as covariates, and included the confounding variables of Model 2. In addition, subgroup analyses stratified by the EHI group were performed, and the interactive effects of long working hours with EHI level on SRH were assessed. The generalized additive model was built to assess the non-linear relationship between weekly working hours (35–80 hours) and SRH scores (1 “very good” to 5 “very poor”) for each EHI level, after adjusting for the demographic factors listed above. We considered an unusually large value of weekly working hours of > 80 hours per week (which is more than twice the prescribed working hours) as an outlier, and removed it to prevent distortion of the graph. In addition, the weighted frequency of poor SRH by EHI level for each working hour group is presented as a bar graph to identify differences in characteristics. SAS software (version 9.4; SAS Institute Inc., Cary, NC, USA) was used for the statistical analyses.
This study was carried out in accordance with the guidelines laid down in the Declaration of Helsinki and was exempted from deliberation by the Institutional Review Board of Seoul St. Mary’s Hospital, the Catholic University of Korea (study number: KC21ZASI0251).
RESULTS
The characteristics of the study participants according to working hours and SRH status are presented in Tables 1 and 2, respectively. In Table 1, the weighted prevalence of long working hours was higher in men (28.7%) than women (15.2%), and in blue-collar workers (35.4%) than white-collar workers (15.3%). In addition, the lower the educational level or the more precarious the employment status, the longer the working hours. The tendency to work longer hours was shown as the income level decreased, but the low-medium EHI group worked ≥ 52 hours a week at the highest proportion (31.0%).
Table 1
Characteristics of the study participants (n = 9,294)
aWidowed, separated, or divorced.
bGross household income divided by square root of household size. EHI groups were classified according to the standard income quartile of sample households for each year presented by the Korea National Health and Nutrition Examination Survey.
cIncluding evening or night work.
Table 2
Self-rated health according to characteristics of the study participants
aWidowed, separated, or divorced.
bGross household income divided by square root of household size. EHI groups were classified according to the standard income quartile of sample households for each year presented by the Korea National Health and Nutrition Examination Survey.
cIncluding evening or night work.
In Table 2, the weighted prevalence of poor SRH was higher in women (14.4%) than in men (11.1%), and lower in participants with marital status listed as married (11.0%) than in unmarried (13.7%) and others (20.1%). Regarding the proportion of participants with poor SRH according to occupational group, pink-collar workers were the highest (14.1%), and white-collar workers were the lowest (11.3%). The prevalence of poor SRH decreased with increasing levels of education. In particular, the proportions of poor SRH were 18.7%, 13.1%, and 12.7% for the low, low-medium, and medium-high EHI groups, respectively. The high EHI group demonstrated the lowest proportion of poor SRH (10.9%). In addition, a higher prevalence of poor SRH was observed in the long working hours group and in participants with hypertension, diabetes, and depression.
As shown in Table 3, the crude OR of poor SRH for the long working hours group, considering the 35–51 working hours group as a reference, was 1.235 (95% CI, 1.048–1.454). The ORs for the long working hours of Models 1, 2, and 3 were 1.296 (95% CI, 1.094–1.536), 1.218 (95% CI, 1.017–1.458), and 1.172 (95% CI, 0.977–1.406), respectively. The same analytical method was applied to calculate the OR stratified by each EHI group, and the adjusted OR in Model 3 for long working hours in order from low to high EHI groups were as follows: 0.88 (95% CI, 0.41–1.87), 0.97 (95% CI, 0.69–1.37), 1.17 (95% CI, 0.86–1.59), and 1.46 (95% CI, 1.09–1.97). The crude OR increased with an increase in the EHI level, but the interaction of long working hours with EHI level was not statistically significant.
Table 3
The odds ratio of poor self-rated health by long working hours stratified by equivalised household incomea
aThe participants who worked < 52 hours a week were considered as a reference group.
bCrude odds ratio was calculated by logistic regression.
cModel 1: Adjusted for age, sex, and marrital status.
dModel 2: Adjusted for age, sex, marrital status, education, occupation, employment status, and shiftwork.
eModel 3: Adjusted for age, sex, marrital status, education, occupation, employment status, shiftwork, smoking, drinking, hypertension, diabetes, and depression.
Fig. 2 demonstrates a non-linear relationship between weekly working hours and poor SRH score for each EHI group using the generalized additive model built on Model 3. A total of 98 (1.1%) participants who worked more than 80 hours a week were excluded from the analysis, and 9,196 participants were included. In the low EHI group, the poor SRH score decreased as the number of weekly working hours increased, indicating that the long working hours group had better SRH for the low EHI group, but the result was not statistically significant. However, the opposite trend was observed for other EHI groups; longer working hours were associated with poorer SRH status in low-medium, medium-high, and high-EHI groups. In particular, the risk of poor SRH significantly increased as weekly working hours increased for participants working about < 70 h/week in the high EHI group.
Fig. 2

Nonparametric association between weekly working hours and poor self-rated health score in each group of EHI. (A) Low EHI. (B) Low-medium EHI. (C) Medium-high EHI. (D) High EHI.
EHI: equivalised household income.
Fig. 3 shows the weighted prevalence of poor SRH according to working hours and EHI groups. The low EHI group had a higher overall prevalence of poor SRH; however, it showed a decreased prevalence with increased working hours. In other EHI groups, the weighted prevalence of poor SRH increased with an increase in weekly working hours. The difference in the weighted prevalence between working hours groups was found to be most evident in the high EHI group (p = 0.002).
Fig. 3
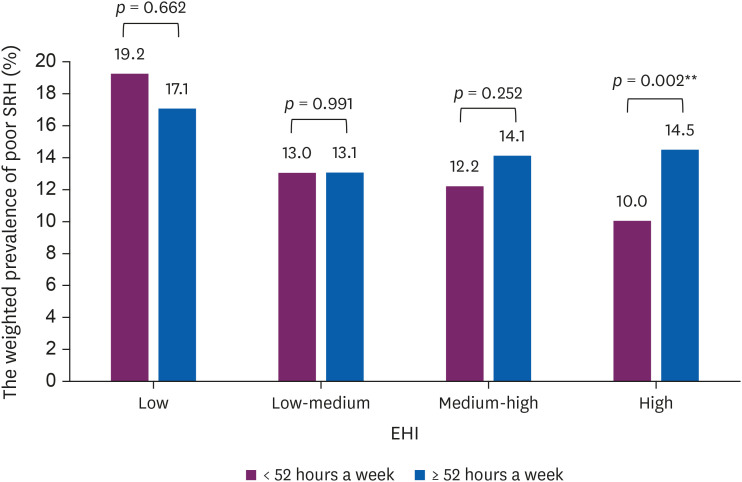
The weighted prevalence of poor SRH by working hours and EHI.
SRH: self-rated health; EHI: equivalised household income.
**p < 0.01.
DISCUSSION
This study aimed to explore the relationship between working hours and subjective health assessments according to household income level. As hypothesized at the beginning of this study, we found that long working hours had different association with SRH, depending on the income level. As shown in Table 3, long working hours significantly increased the risk of poor SRH only in the high-income group, and not in the low-income group. Furthermore, the higher the income, the higher the OR value for poor SRH, suggesting that working hours have different effects on subjective health perception by socioeconomic status.
Long working hours impede recovery during official off-job time, and reduce the opportunities for relaxation, resulting in prolongation of physiological activation and eventually in chronic health impairment.29,30 However, how the difference in income level intervenes and influences the mechanism has not been well studied. The discrepancy between the preferred and actual working hours has been discussed in several previous studies. Some workers decide to invest more time into themselves and their families, even if their earnings decline, while others accept jobs that require longer working hours for higher earnings and thus must sacrifice their leisure time.31,32,33 In the context of working time and earning preference, the results of this study can be interpreted as a difference in health effects due to working hours-preference mismatch. This perspective of preference mismatch in working hour also has been applied and interpreted in previous studies for actual health conditions. According to the results of a recent study conducted in Korea, the negative effects on health generally increase as working hours increase, and the health conditions of workers who work in accordance with their preferred working hours were found to be the best, regardless of working hours.34 In other words, given the backwards bending labor supply curve, unwanted long working hours can adversely affect health in the group whose income is above a certain level, but the negative health effects of long working hours may not be apparent on the surface in those who want to receive higher wages by working long hours due to low income. For example, since the socioeconomically disadvantaged, who have difficulty making a living without earning by working long hours, prefer to work longer hours, therefore, long working hours consistent with their preferences may not adversely affect their health. Therefore, the results of this study support the complex inter-relationship between income, working hours, and health, by considering the concept of a working hours-preference mismatch.
According to the results presented in Table 3 and Fig. 2, the low-income group showed a weak association between long working hours and the risk of poor SRH. However, this should not be interpreted as indicating that long working hours in the low-income group do not adversely affect subjective health assessment. Previous studies on the socioeconomic level and SRH showed that subjective ill-health perception was higher among low-income groups, which was considered to be due to differences in healthcare service utilization rates, health knowledge acquisition, and health management abilities.35,36,37,38 Particularly, in an era of rapid advances in healthcare technologies and increasing complexity of health information, the ability to effectively use abundant resources and make rational choices to promote health is critical.39,40 In the same context, health literacy, defined as the degree to which individuals have the capacity to obtain, process, and understand basic health information and services needed to make appropriate health decisions,41 was suggested to be a common mediator linking socioeconomic position to self-reported health, and it is also regarded as an important determinant in various health outcomes.40,42,43 Similarly, in our study, Table 2 and Fig. 3 showed that the weighted prevalence of poor SRH was higher in the low-income group.
In previous studies analyzing the health effects of long working hours according to household income level, it was found that long working hours can have differential effects on cardiovascular disease and depression risk by income.13,44 Both cardiovascular and depression risk did not show significant increased as the weekly working hours increased in the low-income group, and it was understood that the positive income effect in the low-income group may dominate the potential negative health effects of long working hours. After all, in order for the negative effects of long working hours to go beyond the positive effects of wage earning and, eventually, affect health, a basic income level must be met. This phenomenon, in which the health effects of long working hours appear to diminish in low-income households can be referred to as the ‘poor worker’s long working hours paradox’. When interpreting this paradox, it should be noted that this does not encourage long working hours for low-income workers. It emphasizes the fact that in order to solve the adverse health effects of long working hours from a public health point of view, it is necessary not only to shorten working hours, but also to guarantee a basic living wage for workers at the lowest income. The living wage refers to the amount of wages that can not only provide basic necessities for the lives of workers and their families, but also lead a life above a certain level including housing, education, or cultural living expenses.45 In the case of Seoul, the living wage as of 2021 was set at 10,720 KRW per hour, which was 1,982 KRW higher than the minimum wage.46
This study has several limitations. First, due to its cross-sectional study design, it is limited to demonstrating causality between working hours and SRH. It is also persuasive that individuals with poor SRH might reduce their working hours, which may lead to attenuation of the results toward the null hypothesis. In addition, as studies have shown that self-assessed changes in health using a longitudinal dataset have a higher power of explanation with a surrogate variable for actual health status than SRH,47 further longitudinal analysis is needed to clarify whether working hours are predictors or outcomes of poor SRH. Second, SRH is a subjective measure of health status, and various characteristics, as well as socioeconomic status, can influence poor SRH. However, in many previous studies, it has been suggested that subjective health evaluation is a good index for future health care use and mortality, and plays a role as a global health measurement. Third, despite adjusting for potential confounding factors, we could not investigate other variables that might be intimately related to long working hours, income, and the risk of poor SRH, such as personal characteristics or family roles.
Nevertheless, this study has a novel advantage. The fact that we included a representative sample of the general population of Korea with relatively long working hours makes these participants appropriate to be assessed the association between long working hours and subjective health perception. Our research into the combined impact of working hours and income level on poor SRH could contribute to recognizing populations at risk and thereby to the development of public health policies.
CONCLUSIONS
The results of this study showed that the association between long working hours and poor SRH varied according to the household income level. In the group with the highest income, the strongest association between long working hours and poor SRH was observed, but not in the group with lower income. These findings suggest that the negative health effects of long working hours can appear only when basic income is met, which is affected by the working hour-preference mismatch. However, those who did not meet the basic income level showed a high prevalence of poor SRH, regardless of working hours. We named this phenomenon the poor worker’s long working hours paradox, in which the overall health level is poor, and the negative effects of long working hours are insignificant. In the context of our study, the recent working hour restriction policy implemented by the Korean government should be promoted, together with a basic wage preservation to improve workers’ general health and well-being. We hope that our results will contribute to accumulating evidence supporting the implementation of effective strategies to protect workers’ health.
ACKNOWLEDGMENTS
We thank the team of the Korea National Health and Nutrition Examination Survey (KNHANES) and Korea Centers for Disease Control and Prevention (KCDC) for providing the original KNHANES data. The authors are solely responsible for the contents of the present study, and they do not necessarily represent the official views of the KCDC.
Abbreviations
CI
confidence interval
EHI
equivalised household income
KNHANES
Korea National Health and Nutrition Examination Survey
OECD
Organization for Economic Cooperation and Development
OR
odds ratio
SRH
self-rated health
STROBE
Strengthening the Reporting of Observational Studies in Epidemiology
-
Competing interests: The authors declare that they have no competing interest.
-
Author Contributions:
NOTES
- 1. Organization for Economic Cooperation and Development (OECD). Hours worked (indicator). Paris, France: OECD; 2021.
- 2. Bannai A, Tamakoshi A. The association between long working hours and health: a systematic review of epidemiological evidence. Scand J Work Environ Health 2014;40(1):5–18. 24100465.ArticlePubMed
- 3. Amagasa T, Nakayama T. Relationship between long working hours and depression in two working populations: a structural equation model approach. J Occup Environ Med 2012;54(7):868–874. 22547121.PubMed
- 4. Virtanen M, Jokela M, Nyberg ST, Madsen IE, Lallukka T, Ahola K, et al. Long working hours and alcohol use: systematic review and meta-analysis of published studies and unpublished individual participant data. BMJ 2015;350:g7772. 25587065.ArticlePubMedPMC
- 5. Kobayashi T, Suzuki E, Takao S, Doi H. Long working hours and metabolic syndrome among Japanese men: a cross-sectional study. BMC Public Health 2012;12(1):395. 22651100.ArticlePubMedPMCPDF
- 6. Kang MY, Park H, Seo JC, Kim D, Lim YH, Lim S, et al. Long working hours and cardiovascular disease: a meta-analysis of epidemiologic studies. J Occup Environ Med 2012;54(5):532–537. 22576460.PubMed
- 7. Lee DW, Hong YC, Min KB, Kim TS, Kim MS, Kang MY. The effect of long working hours on 10-year risk of coronary heart disease and stroke in the Korean population: the Korea National Health and Nutrition Examination Survey (KNHANES), 2007 to 2013. Ann Occup Environ Med 2016;28(1):64. 27891238.ArticlePubMedPMCPDF
- 8. Dembe AE, Erickson JB, Delbos RG, Banks SM. The impact of overtime and long work hours on occupational injuries and illnesses: new evidence from the United States. Occup Environ Med 2005;62(9):588–597. 16109814.ArticlePubMedPMC
- 9. McConnell C, Brue S, Macpherson D. Contemporary Labor Economics. 11th ed. New York, NY, USA: McGraw Hill Education; 2016.
- 10. Wilkinson RG, Pickett KE. Income inequality and population health: a review and explanation of the evidence. Soc Sci Med 2006;62(7):1768–1784. 16226363.ArticlePubMed
- 11. Wagstaff A, van Doorslaer E. Income inequality and health: what does the literature tell us? Annu Rev Public Health 2000;21(1):543–567. 10884964.ArticlePubMed
- 12. Pickett KE, Wilkinson RG. Income inequality and health: a causal review. Soc Sci Med 2015;128:316–326. 25577953.ArticlePubMed
- 13. Lee DW, Kim HR, Myong JP, Choi J, Hong YC, Kang MY. Does working long hours increase the risk of cardiovascular disease for everyone? J Occup Health 2019;61(6):431–441. 31237053.ArticlePubMedPMCPDF
- 14. Manor O, Matthews S, Power C. Self-rated health and limiting longstanding illness: inter-relationships with morbidity in early adulthood. Int J Epidemiol 2001;30(3):600–607. 11416091.ArticlePubMed
- 15. Kim SH, Wolde-Tsadik G, Reuben DB. Predictors of perceived health in hospitalized older persons: a cross-sectional and longitudinal study. J Am Geriatr Soc 1997;45(4):420–426. 9100709.ArticlePubMed
- 16. Benyamini Y, Idler EL, Leventhal H, Leventhal EA. Positive affect and function as influences on self-assessments of health: expanding our view beyond illness and disability. J Gerontol B Psychol Sci Soc Sci 2000;55(2):107–116.Article
- 17. Palladino R, Tayu Lee J, Ashworth M, Triassi M, Millett C. Associations between multimorbidity, healthcare utilisation and health status: evidence from 16 European countries. Age Ageing 2016;45(3):431–435. 27013499.ArticlePubMedPMC
- 18. Ryu J, Yoon Y, Kim H, Kang CW, Jung-Choi K. The change of self-rated health according to working hours for two years by gender. Int J Environ Res Public Health 2018;15(9):1984.ArticlePubMedPMC
- 19. Song JT, Lee G, Kwon J, Park JW, Choi H, Lim S. The association between long working hours and self-rated health. Ann Occup Environ Med 2014;26(1):2. 24472333.ArticlePubMedPMCPDF
- 20. Jeon J, Lee W, Choi WJ, Ham S, Kang SK. Association between Working Hours and Self-Rated Health. Int J Environ Res Public Health 2020;17(8):2736.ArticlePubMedPMC
- 21. von Elm E, Altman DG, Egger M, Pocock SJ, Gøtzsche PC, Vandenbroucke JP, et al. The Strengthening the Reporting of Observational Studies in Epidemiology (STROBE) statement: guidelines for reporting observational studies. Bull World Health Organ 2007;85(11):867–872. 18038077.ArticlePubMedPMC
- 22. Ministry of Employment and Labor. Chapter IV. Working hours and recess. Labor Standards Act. Sejong, Korea: Ministry of Employment and Labor; 2021.
- 23. Korea Workers’ Compensation & Welfare Services. The Manual of Occupational Disease Adjudication. Ulsan, Korea: Korea Workers’ Compensation & Welfare Services; 2019.
- 24. Jylhä M. What is self-rated health and why does it predict mortality? Towards a unified conceptual model. Soc Sci Med 2009;69(3):307–316. 19520474.ArticlePubMed
- 25. Wu S, Wang R, Zhao Y, Ma X, Wu M, Yan X, et al. The relationship between self-rated health and objective health status: a population-based study. BMC Public Health 2013;13(1):320. 23570559.ArticlePubMedPMCPDF
- 26. Lorem G, Cook S, Leon DA, Emaus N, Schirmer H. Self-reported health as a predictor of mortality: a cohort study of its relation to other health measurements and observation time. Sci Rep 2020;10(1):4886. 32184429.ArticlePubMedPMCPDF
- 27. Organization for Economic Cooperation and Development (OECD). Divided We Stand: Why Inequality Keeps Rising. Paris, France: OECD Publishing Paris; 2011.
- 28. Lee W, Yeom H, Yoon JH, Won JU, Jung PK, Lee JH, et al. Metabolic outcomes of workers according to the International Standard Classification of Occupations in Korea. Am J Ind Med 2016;59(8):685–694. 27345305.ArticlePubMed
- 29. Geurts SA, Sonnentag S. Recovery as an explanatory mechanism in the relation between acute stress reactions and chronic health impairment. Scand J Work Environ Health 2006;32(6):482–492. 17173204.ArticlePubMed
- 30. Spurgeon A, Harrington JM, Cooper CL. Health and safety problems associated with long working hours: a review of the current position. Occup Environ Med 1997;54(6):367–375. 9245942.ArticlePubMedPMC
- 31. Altonji JG, Paxson CH. Labor supply preferences, hours constraints, and hours-wage trade-offs. J Labor Econ 1988;6(2):254–276.Article
- 32. Stier H, Lewin-Epstein N. Time to work: a comparative analysis of preferences for working hours. Work Occup 2003;30(3):302–326.
- 33. Lu L. Working hours and personal preference among Taiwanese employees. Int J Workplace Health Manag 2011;4(3):244–256.Article
- 34. Lee Y. Analysis of the relationship between working hour mismatch and worker’s health. Health Soc Welf Rev 2015;35(3):135–165.Article
- 35. Smith PM, Glazier RH, Sibley LM. The predictors of self-rated health and the relationship between self-rated health and health service needs are similar across socioeconomic groups in Canada. J Clin Epidemiol 2010;63(4):412–421. 19926448.ArticlePubMed
- 36. Kennedy BP, Kawachi I, Glass R, Prothrow-Stith D. Income distribution, socioeconomic status, and self rated health in the United States: multilevel analysis. BMJ 1998;317(7163):917–921. 9756809.ArticlePubMedPMC
- 37. Weich S, Lewis G, Jenkins SP. Income inequality and self rated health in Britain. J Epidemiol Community Health 2002;56(6):436–441. 12011200.ArticlePubMedPMC
- 38. Yoon BJ. Differential effects on self-rated health by socioeconomic class. J Health Inf Stat 2016;41(1):35–42.ArticlePDF
- 39. Berkman ND, Sheridan SL, Donahue KE, Halpern DJ, Viera A, Crotty K, et al. Health literacy interventions and outcomes: an updated systematic review. Evid Rep Technol Assess (Full Rep) 2011;(199):1–941.
- 40. Sørensen K, Van den Broucke S, Fullam J, Doyle G, Pelikan J, Slonska Z, et al. Health literacy and public health: a systematic review and integration of definitions and models. BMC Public Health 2012;12(1):80. 22276600.PubMedPMC
- 41. Ratzan S, Parker R, Selden C, Zorn M. National Library of Medicine Current Bibliographies in Medicine: Health Literacy. Bethesda, MD, USA: National Institutes of Health, US Department of Health and Human Services; 2000.
- 42. Sørensen K, Brand H. Health literacy lost in translations? Introducing the European Health Literacy Glossary. Health Promot Int 2014;29(4):634–644. 23479322.ArticlePubMed
- 43. Furuya Y, Kondo N, Yamagata Z, Hashimoto H. Health literacy, socioeconomic status and self-rated health in Japan. Health Promot Int 2015;30(3):505–513. 24131729.ArticlePubMed
- 44. Park MY, Lee J, Kim HR, Lee YM, Ahn J, Lee DW, et al. Long working hours and risk of depression by household income level: findings from the Korea National Health and Nutrition Examination Survey (KNHANES). J Occup Environ Med 2022;64(2):99–104. 34723909.PubMed
- 45. Pennycook M. What Price a Living Wage?: Understanding the Impact of a Living Wage on Firm-level Wage Bills. London, UK: Institute for Public Policy Research; 2012.
- 46. Seoul confirms living wage of 10,702 KRWO per hour next year, 1.7% hourly wage increase. Updated September 17, 2020]. Accessed November 4, 2021]. https://news.seoul.go.kr/economy/archives/509472 .
- 47. Choi YH. Is subjective health reliable as a proxy variable for true health? A comparison of self-rated health and self-assessed change in health among middle-aged and older South Koreans. Health Soc Welf Rev 2016;36(4):431–459.Article
REFERENCES
REFERENCES
Figure & Data
REFERENCES
Citations
Citations to this article as recorded by 
- Association between working hours, income, and work-related injury among freelancers in Japan: a cross-sectional study
Kazuhiro Watanabe, Kazuhito Yokoyama, Akizumi Tsutsumi
Journal of Occupational Health.2025;[Epub] CrossRef - Paradox of long working hours: how income levels and satisfaction modify health outcomes
Jeehee MIN, Min-Seok KIM, Dong-Wook LEE, Seong-Sik CHO, Mo-Yeol KANG
Industrial Health.2025; 63(5): 443. CrossRef - Effect of long working hours on psychological distress among young workers in different types of occupation
Seong-Uk Baek, Jin-Ha Yoon
Preventive Medicine.2024; 179: 107829. CrossRef - High levels of anxiety and depression in women farmers from Ecuador: A cross-section study in Coastal and Highlands regions
Aline Siteneski, Viviana Septimia Gómez Mieles, Paola Andrea Romero Riaño, Karime Montes Escobar, German Josuet Lapo-Talledo, Andrea Valeria Dueñas-Rodriguez, María Antonieta Palma Cedeño, Yliana Consuelo Villacis Lascano, Lincon Oliver Echeverria Zurita
International Journal of Social Psychiatry.2024; 70(6): 1138. CrossRef - Association between single-person household wage workers in South Korea and insomnia symptoms: the 6th Korean Working Conditions Survey (KWCS)
Yoon Ho Lee, Yong-Jin Lee, Eun-Chul Jang, Young-Sun Min, Soon-Chan Kwon
Ann Occup Environ Med.2024; 36: e25. CrossRef - Multi-Dimensional Comparison of the Impact Mechanism of the Self-Rated Health Status of Urban and Rural Residents in Chinese Social Environments
Chao Yu, Xinyi Zhang, Junbo Gao
International Journal of Environmental Research and Public Health.2022; 19(17): 10625. CrossRef
 Cite
Cite- Figure
-
- Related articles
-
- Association between heavy metal exposure and high-sensitivity C-reactive protein in the elderly: Korea National Health and Nutrition Examination Survey (KNHANES) 2016–2017
- Relationship between long-term PM2.5 exposure and myopia prevalence in adults: analysis of the Korea National Health and Nutrition Examination Survey–Air Pollution Linked Data, 2020
- Exploring the impact of age and socioeconomic factors on health-related unemployment using propensity score matching: results from Korea National Health and Nutrition Examination Survey (2015–2017)
Poor worker’s long working hours paradox: evidence from the Korea National Health and Nutrition Examination Survey, 2013-2018

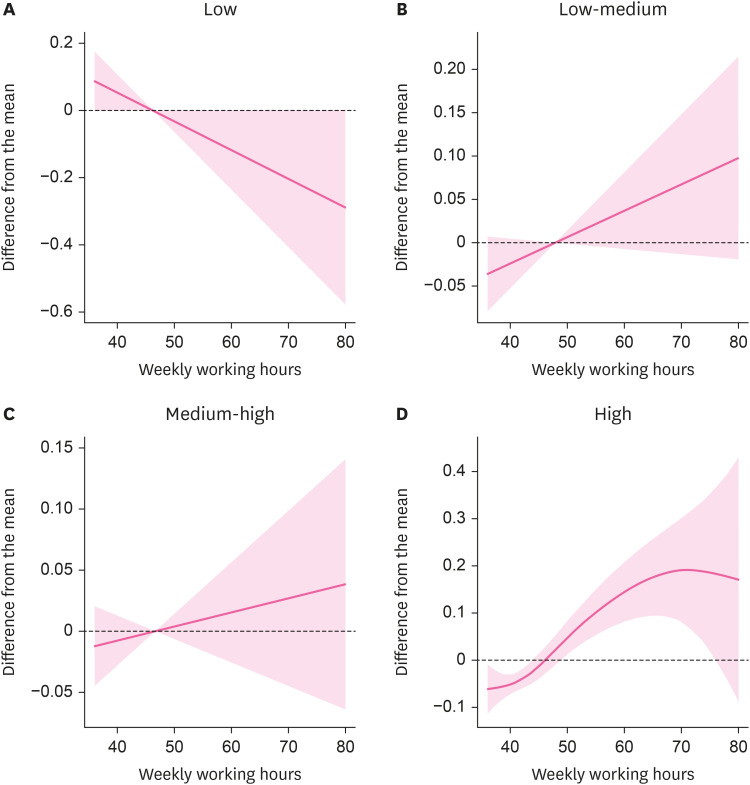

Fig. 1 Schematic diagram of the study participants.
Fig. 2 Nonparametric association between weekly working hours and poor self-rated health score in each group of EHI. (A) Low EHI. (B) Low-medium EHI. (C) Medium-high EHI. (D) High EHI.EHI: equivalised household income.
Fig. 3 The weighted prevalence of poor SRH by working hours and EHI.SRH: self-rated health; EHI: equivalised household income.**p < 0.01.
Fig. 1
Fig. 2
Fig. 3
Poor worker’s long working hours paradox: evidence from the Korea National Health and Nutrition Examination Survey, 2013-2018
| Characteristics | Long working hours | Total | |||
|---|---|---|---|---|---|
| Yes (≥ 52 hours/week) | No (35–51 hours/week) | ||||
| No. (%) | No. (%) | ||||
| Total | 2,160 (23.8) | 7,134 (76.2) | 9,294 | ||
| Age (years) | < 0.001 | ||||
| 19–39 | 778 (22.0) | 3,029 (78.0) | 3,807 | ||
| 40–54 | 822 (24.6) | 2,739 (75.4) | 3,561 | ||
| 55–64 | 377 (25.4) | 1,099 (74.6) | 1,476 | ||
| ≥ 65 | 183 (38.4) | 267 (61.6) | 450 | ||
| Sex | < 0.001 | ||||
| Male | 1,527 (28.7) | 3,752 (71.3) | 5,279 | ||
| Female | 633 (15.2) | 3,382 (84.8) | 4,015 | ||
| Marital status | < 0.001 | ||||
| Married | 1,571 (24.9) | 4,996 (75.1) | 6,567 | ||
| Unmarried | 395 (20.6) | 1,651 (79.4) | 2,046 | ||
| Othersa | 194 (26.5) | 487 (73.5) | 681 | ||
| Education | < 0.001 | ||||
| Elementary | 245 (37.7) | 418 (62.3) | 663 | ||
| Middle | 254 (39.2) | 413 (60.8) | 667 | ||
| High | 799 (26.8) | 2,268 (73.2) | 3,067 | ||
| ≥ College | 862 (19.0) | 4,035 (81.0) | 4,897 | ||
| Equivalised household incomeb | < 0.001 | ||||
| Low | 111 (25.3) | 322 (74.7) | 433 | ||
| Low-medium | 609 (31.0) | 1,362 (69.0) | 1,971 | ||
| Medium-high | 768 (24.5) | 2,410 (75.5) | 3,178 | ||
| High | 672 (19.4) | 3,040 (80.6) | 3,712 | ||
| Occupation | < 0.001 | ||||
| White collar | 697 (15.3) | 4,201 (84.7) | 4,898 | ||
| Pink collar | 425 (30.0) | 938 (70.0) | 1,363 | ||
| Blue collar | 1,038 (35.4) | 1,995 (64.6) | 3,033 | ||
| Employment status | < 0.001 | ||||
| Permanent | 1,678 (22.7) | 6,007 (77.3) | 7,685 | ||
| Precarious | 482 (29.6) | 1,127 (70.4) | 1,609 | ||
| Self-rated health | |||||
| Good | 1,846 (23.3) | 6,298 (76.7) | 8,144 | ||
| Poor | 314 (27.3) | 836 (72.7) | 1,150 | ||
| Work schedule | < 0.001 | ||||
| Day time | 1,678 (22.1) | 6,299 (77.9) | 7,977 | ||
| Shift workc | 482 (33.8) | 835 (66.2) | 1,317 | ||
| Smoking | < 0.001 | ||||
| No | 918 (18.4) | 4,126 (81.6) | 5,044 | ||
| Current | 757 (32.2) | 1,643 (67.8) | 2,400 | ||
| Past | 485 (25.2) | 1,365 (74.8) | 1,850 | ||
| Problematic drinking | 0.002 | ||||
| Yes | 394 (27.5) | 1,012 (72.5) | 1,406 | ||
| No | 1,766 (23.1) | 6,122 (76.9) | 7,888 | ||
| Hypertension | < 0.001 | ||||
| Yes | 571 (28.2) | 1,434 (71.8) | 2,005 | ||
| No | 1,589 (22.7) | 5,700 (77.3) | 7,289 | ||
| Diabetes Mellitus | 0.002 | ||||
| Yes | 201 (29.6) | 446 (70.4) | 647 | ||
| No | 1,959 (23.5) | 6,688 (76.5) | 8,647 | ||
| Depression | 0.502 | ||||
| Yes | 15 (28.1) | 43 (71.9) | 58 | ||
| No | 2,145 (23.8) | 7,091 (76.2) | 9,236 | ||
| Characteristics | Self-rated health | Total | |||
|---|---|---|---|---|---|
| Poor | Good | ||||
| No. (%) | No. (%) | ||||
| Total | 1,150 (12.3) | 8,144 (87.7) | 9,294 | ||
| Age | 0.322 | ||||
| 19–39 | 447 (12.2) | 3,360 (87.8) | 3,807 | ||
| 40–54 | 426 (11.9) | 3,135 (88.1) | 3,561 | ||
| 55–64 | 204 (13.3) | 1,272 (86.7) | 1,476 | ||
| ≥ 65 | 73 (15.2) | 377 (84.8) | 450 | ||
| Sex | < 0.001 | ||||
| Male | 556 (11.1) | 4,723 (88.9) | 5,279 | ||
| Female | 594 (14.4) | 3,421 (85.6) | 4,015 | ||
| Marital status | < 0.001 | ||||
| Married | 739 (11.0) | 5,828 (89.0) | 6,567 | ||
| Unmarried | 273 (13.7) | 1,773 (86.3) | 2,046 | ||
| Othersa | 138 (20.1) | 543 (79.9) | 681 | ||
| Education | < 0.001 | ||||
| Elementary | 137 (19.5) | 526 (80.5) | 663 | ||
| Middle | 115 (17.7) | 552 (82.3) | 667 | ||
| High | 408 (13.7) | 2,659 (86.3) | 3,067 | ||
| ≥ College | 490 (10.2) | 4,407 (89.8) | 4,897 | ||
| Equivalised household incomeb | < 0.001 | ||||
| Low | 85 (18.7) | 348 (81.3) | 433 | ||
| Low-medium | 275 (13.1) | 1,696 (86.9) | 1,971 | ||
| Medium-high | 393 (12.7) | 2,785 (87.3) | 3,178 | ||
| High | 397 (10.9) | 3,315 (89.1) | 3,712 | ||
| Occupation | 0.017 | ||||
| White collar | 527 (11.3) | 4,371 (88.7) | 4,898 | ||
| Pink collar | 202 (14.1) | 1,161 (85.9) | 1,363 | ||
| Blue collar | 421 (13.2) | 2,612 (86.8) | 3,033 | ||
| Employment status | < 0.001 | ||||
| Permanent | 866 (11.3) | 6,819 (88.7) | 7,685 | ||
| Precarious | 284 (17.2) | 1,325 (82.8) | 1,609 | ||
| Weekly working hour | 0.011 | ||||
| 35–51 | 836 (11.7) | 6,298 (88.3) | 7,134 | ||
| ≥ 52 | 314 (14.1) | 1,846 (85.9) | 2,160 | ||
| Work schedule | 0.138 | ||||
| Day time | 968 (12.1) | 7,009 (87.9) | 7,977 | ||
| Shift workc | 182 (13.7) | 1,135 (86.3) | 1,317 | ||
| Smoking | < 0.001 | ||||
| No | 605 (11.3) | 4,439 (88.7) | 5,044 | ||
| Current | 355 (15.9) | 2,045 (84.1) | 2,400 | ||
| Past | 190 (9.5) | 1,660 (90.5) | 1,850 | ||
| Problematic drinking | 0.007 | ||||
| Yes | 193 (14.9) | 1,213 (85.1) | 1,406 | ||
| No | 957 (11.8) | 6,931 (88.2) | 7,888 | ||
| Hypertension | < 0.001 | ||||
| Yes | 323 (16.3) | 1,682 (83.7) | 2,005 | ||
| No | 827 (11.3) | 6,462 (88.7) | 7,289 | ||
| Diabetes Mellitus | < 0.001 | ||||
| Yes | 154 (23.4) | 493 (76.6) | 647 | ||
| No | 996 (11.6) | 7,651 (23.4) | 8,647 | ||
| Depression | < 0.001 | ||||
| Yes | 25 (40.8) | 33 (59.2) | 58 | ||
| No | 1,125 (12.1) | 8,111 (87.9) | 9,236 | ||
| Equivalised household income | Weighted prevalence of poor self-rated health (%) | Crude ORb | Model 1c | Model 2d | Model 3e | ||||||
|---|---|---|---|---|---|---|---|---|---|---|---|
| < 52 hours a week | ≥ 52 hours a week | OR | 95% CI | OR | 95% CI | OR | 95% CI | OR | 95% CI | ||
| Overall | 11.7 | 14.1 | 1.24 | 1.05–1.45 | 1.30 | 1.09–1.54 | 1.22 | 1.017–1.458 | 1.17 | 0.98–1.41 | |
| Subgroups for income | |||||||||||
| Low | 19.2 | 17.1 | 0.86 | 0.44–1.70 | 0.96 | 0.46–1.99 | 0.88 | 0.410–1.896 | 0.88 | 0.41–1.87 | |
| Low-medium | 13.0 | 13.1 | 1.00 | 0.73–1.37 | 1.09 | 0.79–1.50 | 1.05 | 0.753–1.465 | 0.97 | 0.69–1.37 | |
| Medium-high | 12.2 | 14.1 | 1.18 | 0.89–1.57 | 1.28 | 0.95–1.73 | 1.21 | 0.887–1.644 | 1.17 | 0.86–1.59 | |
| High | 10.0 | 14.5 | 1.52 | 1.16–1.99 | 1.58 | 1.19–2.08 | 1.52 | 1.138–2.039 | 1.46 | 1.09–1.97 | |
Table 1 Characteristics of the study participants (n = 9,294)
aWidowed, separated, or divorced.
bGross household income divided by square root of household size. EHI groups were classified according to the standard income quartile of sample households for each year presented by the Korea National Health and Nutrition Examination Survey.
cIncluding evening or night work.
Table 2 Self-rated health according to characteristics of the study participants
aWidowed, separated, or divorced.
bGross household income divided by square root of household size. EHI groups were classified according to the standard income quartile of sample households for each year presented by the Korea National Health and Nutrition Examination Survey.
cIncluding evening or night work.
Table 3 The odds ratio of poor self-rated health by long working hours stratified by equivalised household incomea
aThe participants who worked < 52 hours a week were considered as a reference group.
bCrude odds ratio was calculated by logistic regression.
cModel 1: Adjusted for age, sex, and marrital status.
dModel 2: Adjusted for age, sex, marrital status, education, occupation, employment status, and shiftwork.
eModel 3: Adjusted for age, sex, marrital status, education, occupation, employment status, shiftwork, smoking, drinking, hypertension, diabetes, and depression.

