
Articles
- Page Path
- HOME > Ann Occup Environ Med > Volume 33; 2021 > Article
- Original Article Association between sleep disturbance and occupational injury among Korean employees
-
Jongwoo Lee1
 , Seong-Sik Cho2,3, JungIl Kim2, Mo-yeol Kang4, Suhwan Ju1, Byoung Gwon Kim2, Young Seoub Hong3
 -
Annals of Occupational and Environmental Medicine 2021;33:e29.
DOI: https://doi.org/10.35371/aoem.2021.33.e29
Published online: September 10, 2021
1Department of Occupational and Environmental Medicine, Dong-A University Hospital, Busan, Korea.
2Department of Occupational and Environmental Medicine, College of Medicine, Dong-A University, Busan, Korea.
3Department of Preventive Medicine, College of Medicine, Dong-A University, Busan, Korea.
4Department of Occupational and Environmental Medicine, College of Medicine, The Catholic University of Korea, Seoul, Korea.
- Correspondence: Seong-Sik Cho. Department of Occupational and Environmental Medicine, Dong-A University Hospital, College of Medicine, Dong-A University, 32 Daesingongwon-ro, Seo-gu, Busan 49201, Korea. sscho@dau.ac.kr
• Received: June 1, 2021 • Revised: July 27, 2021 • Accepted: August 30, 2021
Copyright © 2021 Korean Society of Occupational & Environmental Medicine
This is an Open Access article distributed under the terms of the Creative Commons Attribution Non-Commercial License (https://creativecommons.org/licenses/by-nc/4.0/) which permits unrestricted non-commercial use, distribution, and reproduction in any medium, provided the original work is properly cited.
Abstract
-
Background Occupational injury has been a serious social problem steadily. Sleep disturbance is a risk factor for occupational injury. However, there were few researches studied on the linking between sleep disturbance and occupational injury in general working population of Korea. Therefore, we explored the association between sleep disturbance and occupational injury among Korean workers.
-
Methods This study used data from the 5th Korean Working Conditions Survey. Occupational injury was assessed by asking work related injury for 12 months prior to the point of the survey. Sleep disturbance was assessed using the Minimal Insomnia Symptoms Scale (MISS). To analyze the association between sleep disturbance and occupational injury, multiple logistic regression analysis was conducted.
-
Results The odds ratio (OR) of sleep disturbance group for occupational injury was 2.57 (95% confidence interval [CI]: 1.68–3.93) in the fully adjusted model. For the association between MISS score and occupational injury, it showed increasing trend that ORs increase from the 1st to the 4th quartiles. The OR of 2nd quartile was 1.10 (95% CI: 0.60–2.01), the OR of 3rd quartile was 2.27 (95% CI: 1.53–3.38) and the OR of 4th quartile was 2.80 (95% CI: 1.84–4.26).
-
Conclusions Sleep disturbance was associated with occupational injury. In addition, increasing trend was observed between MISS score and occupational injury. These findings imply that developing of intervention programs to manage sleep disturbance and fatigue may be necessary to prevent occupational injury.
BACKGROUND
Sleep is indispensable for normal human activity, and sleep disturbance can lead to various health problems, such as increased mortality,1,2 diabetes,3,4 obesity,5,6 and mental disorders.7,8,9 Approximately 10%, 32%, and 8%–26% of day, night, and rotating shift workers, respectively, have experienced impaired sleep conditions.10 The prevalence of insomnia in Korea in 2013 was estimated to be 1.58%, 2.59%, 3.74%, and 6.50% in their 20s, 30s, 40s, and 50s, respectively.11
Occupational injuries are serious social concern. The industrial accident rate in Korea was 0.58% in 2019.12 In 2019, 109,242 persons were injured and 855 workers died from occupational accidents in Korea. Korea has the highest death rate by industrial accidents among Organization for Economic Cooperation and Development (OECD) countries alongside low industrial accident rate which is eccentric statistics. It was reported that more than 80% of industrial accidents might be concealed.13 Occupational injury grows significant social costs due to lost income, compensation costs, disability, and long-term health problems.14,15,16 Therefore, the underreporting of occupational injury should be addressed, and countermeasures to prevent occupational injury should be implemented. Previous studies in other countries have reported that sleep disturbance is a significant risk factor for occupational injury.17,18 A meta-analysis estimated that about 13% of work injury could be affected by sleep problems in 2014.19 There were some researches studied the association between sleep disturbance and occupational injury in Korea, however, they had some limitations. One study examined the associations between working conditions and occupational injury in 2017 using the 4th Korean working conditions survey (KWCS).20 Nonetheless, the survey contained only one question related to sleep disturbance and the authors did not focus on sleep disturbance. Sleep disturbance has also been related to fatal occupational traffic accidents.21 Further, an association was found between sleep hours and occupational injury among ship-building supply workers.22 Nevertheless, there have been no large-scale study targeting Korean general population using validated tool about sleep disturbance. Thus, the objective of this study was to investigate the association between sleep disturbance and occupational injury in general working Korean population using a validated questionnaire to assess sleep disturbance.9 Additionally, we studied how each question of Minimal Insomnia Symptoms Scale (MISS) relates to occupational injury.
METHOD
This study used data from the 5th KWCS, which was conducted by the Occupational Safety and Health Research Institute (OSHRI) of Korea. The survey comprised 50,205 participants. Of these, paid workers (n = 37,132) were included in the analysis of this study. Self-employed persons without employees (n = 7,709), self-employed persons with employees (n = 2,998), non-paid familial workers (n = 2,162), and other workers (n = 204) were excluded from the analysis (Fig. 1). Non-respondents to any of the questions were also excluded from the analysis.

Sleep disturbance
Sleep disturbance was estimated using a question that was assessed by the MISS.9 There were 3 sleep-related symptoms listed: i) Difficulty falling asleep; ii) Waking up repeatedly during the sleep; and iii) Waking up with a feeling of exhaustion and fatigue. Participants selected an answer to each question. The MISS scoring method, assigned 0–5 points to each response: 0 “never,” 1 “less often,” 2 “several times a month,” 3 “several times a week,” and 4 “daily.” The scores for each item were aggregated within a range of 0 to 12 points. Based on the study about the design of MISS, ≥ 6 points was regarded as sleep disturbance, and < 6 points was regarded as normal sleep.9 For every sleep-related symptom, participants who responded with “never,” “less often,” or “several times a month” were regarded as having no symptom, and those who responded with “several times a week” or “daily” were regarded as having symptoms. To assess trend between MISS score and occupational injury, MISS score was categorized into quartiles as follows (1st quartile:1 point; 2nd quartile: 2 points; 3rd quartile: 3–4 points; and 4th quartile: > 4 points). The value of Cronbach's α of MISS is 0.73, and the area under the receiver operating characteristic curve was 0.92 (standard error = 0.01; 95% confidence interval [CI]: 0.89–0.94).
Occupational injury
Occupational injury was estimated using the question: “Over the last 12 months, did you have any of the following health problems?” including “Injury(ies)”, and “[If yes] Are your health problems due to your job?” Occupational injury was considered when the answer was “Yes” for “Injury(ies)” in both questions.
Covariates
The variables known to be associated with sleep disturbance and occupational injury were included in this analysis.23 Sex, age, education level, income, employment status, occupation, weekly working hours, shift work and perceived risk at work were the control variables. The participants were classified into different age groups: 15–39, 40–49, 50–59, ≥ 60 years. Education level was classified as middle school graduation or lower, high school graduation, or college graduation or higher. Income was classified into 4 quartiles based on average monthly income. Employment status was categorized as regular, temporary, or daily. Occupation was classified as professional & managerial, clerical, sales and service, or manual. Weekly working hours were classified as 1–34, 35–40, 41–52, 53–60, and ≥ 61 hours. Shift work was indicated by “Yes or “No.” Perceived risk at work was categorized as “Risk (−)” or “Risk (+).”
The characteristics of the study population by sleep disturbance, and occupational injury and related factors are presented using numbers and proportions. Survey-weighted logistic regression analysis was performed to investigate the association between sleep disturbance and occupational injury. Odd ratios (ORs) and 95% CI were calculated for the unadjusted model; Model 1, adjusted for age, sex, education level, income, occupation, employment status; Model 2, adjusted for the factors in Model 1, along with shift work and working hours; and Model 3, adjusted for the factors in Model 2, along with perceived risk at work.
The 5th KWCS conducted multistage-stratified sampling that reflected the 2010 census and inquired on socioeconomic demographics, working conditions, health status, and occupational characteristics, and included a weight variable for the data to describe the working population in Korea.24 The design weight was determined by sample design non-response rate and post-stratification. All statistical analyses were performed using STATA 16.1 (StataCorp., College Station, TX, USA).
The study was approved by the Institutional Review Board of Dong-A University Hospital (DAUHIRB-EXP-21-091).
RESULTS
Table 1 presents the characteristics of the study population by sleep disturbance. There was a higher proportion of female, older age, and lower education individuals who had sleep disturbance. In terms of job characteristics, participants with lower income, temporary employment, occupation in the sales and service field, long weekly working hours, shift work and having perceived risk at work were more likely to have sleep disturbance. The proportion of having experience of sleep disturbance of shift workers (8.9%) were analogous to the result of aforementioned study.10 The proportion of having experience of sleep disturbance of age 15–39 (6.1%) and 40–49 (6.6%) were higher than the research about sleep disturbance aforementioned (1.58% in 20s, 2.59% in 30s, 3.74% in 40s).11
Table 1
Characteristics of the study population by sleep disturbance
Occupational injury and related factors are shown in Table 2. In terms of sleep characteristics, there was a high proportion of having sleep disturbance, high MISS score, waking up repeatedly during the sleep, waking up with a feeling of exhaustion and fatigue to have occupational injury. Participants who is male, younger age, lower education, lower income, manual worker, and shorter weekly working hours were more likely to experience occupational injury.
Table 2
Occupational injury and related factors
Values are presented as number (%).
aPatients with ≥ 6 points were considered to have sleep disturbance and those with < 6 points were considered to have normal sleep using the Minimal Insomnia Symptoms Scale (MISS).
bMISS score was categorized into quartiles as follows (1st quartile:1 point; 2nd quartile: 2 points; 3rd quartile: 3–4 points; and 4th quartile: > 4 points).
MISS: Minimal Insomnia Symptoms Scale.
Table 3 shows the association between sleep disturbance and occupational injury by subgroups using univariable logistic regression analysis. In most subgroups, participants with sleep disturbance were more likely to have occupational injury than normal. The exceptions were age 40–49 (OR: 0.79; 95% CI: 0.27–2.35) and sales & service workers (OR: 0.96; 95% CI: 0.33–2.83). which were not statistically significant.
Table 3
Association between sleep disturbance and occupational injury by subgroups
Table 4 shows the association between sleep disturbance and occupational injury by logistic regression analysis. Participants with sleep disturbance were more likely to have occupational injury than normal participants when fully adjusted (OR: 2.57; 95% CI: 1.68–3.93). The association between MISS score and occupational injury showed increasing trend in which ORs increased sequentially from the 1st to the 4th quartile in every model. In Model 3, compared to the first quartile, MISS score had greater risk of occupational injury (OR: 2.80; 95% CI: 1.84–4.26).
Table 4
Association between sleep disturbance and occupational injury by logistic regression analysis
OR: odds ratio; CI: confidence interval; MISS: Minimal Insomnia Symptoms Scale.
aModel 1: adjusted for age, sex, education, income, occupation, and employment status. bModel 2: adjusted for age, sex, education, income, occupation, employment status, shift work, and working hours. cModel 3: adjusted for age, sex, education, income, occupation, employment status, shift work, working hours, and perceived risk at work. dPatients with ≥ 6 points were considered to have sleep disturbance and those with < 6 points were considered to have normal sleep using the Minimal Insomnia Symptoms Scale (MISS). eMISS score was categorized into quartiles as follows (1st quartile:1 point; 2nd quartile: 2 points; 3rd quartile: 3–4 points; and 4th quartile: > 4 points).
The association between sleep-related symptoms and occupational injury by logistic regression analysis is presented in Table 5. Participants with symptoms were more likely to have occupational injury than normal participants for every symptom. However, the result of the symptom “Difficulty falling asleep” was not statistically significant (OR: 1.15; 95% CI: 0.57–2.35).
Table 5
Association between sleep-related symptoms and occupational injury by logistic regression analysis
OR: odds ratio; CI: confidence interval.
aModel 1: adjusted for age, sex, education, income, occupation, and employment status. bModel 2: adjusted for age, sex, education, income, occupation, employment status, shift work, and working hours. cModel 3: adjusted for age, sex, education, income, occupation, employment status, shift work, working hours, and perceived risk at work.
The association between sleep-related symptoms and occupational injury by logistic regression analysis is shown in Table 5. The difference between participants who have difficulty in falling asleep and normal participants was insignificant in every model. Participants who wake up repeatedly during sleep were 3.28 times more often involved in occupational injury than those who does not wake up repeatedly during sleep (95% CI: 1.92–5.62). Participants who wake up with a feeling of exhaustion and fatigue were 2.64 times more often involved in occupational injury than participants who does not wake up with a feeling of exhaustion and fatigue (95% CI: 1.69–4.11).
DISCUSSION
This study explored the association between sleep disturbance and occupational injury using nationwide data representative of Korean working population. When adjusted for age, sex, education level, income, occupation, employment status, shift work, working hours and perceived risk at work, the OR for occupational injury among participants who have experienced sleep disturbance was higher than normal participants (OR: 2.57; 95% CI: 1.68–3.93). When adjusted as above, the ORs of MISS score for occupational injury gradually increased from the first to the fourth quartile. Participants who had sleep disturbance had higher odds of suffering occupational injuries for the symptom “Waking up repeatedly during sleep” (OR: 3.28; 95% CI: 1.92–5.62) and “Waking up with a feeling of exhaustion and fatigue” (OR: 2.64; 95% CI: 1.69–4.11). The reason why the proportion of having experienced occupational injury of male, age 15–39, low income and manual working was high is presumed to be because they take more dangerous, physical work. The reason why the proportion of having experienced occupational injury of the participants works 1–34 hours weekly was high is considered to be because they may not be familiar with their work. Our findings suggest that sleep disturbances and each of sleep-related symptoms are associated with the occurrence of occupational injuries.
Both of the symptoms “Difficulty falling asleep” and “Waking up repeatedly during sleep” affects to the occurrence of occupational injury although it is plausible that the influence of the latter symptom is stronger than the former symptom, that suggests that the progress of sleep is more important than the beginning of sleep. The symptom “Waking up with a feeling of exhaustion and fatigue” might be the result of two symptoms mentioned above since the OR for this symptom is between the ORs for other symptoms.
Several possible mechanism can explain the effect of sleep disturbance on occupational injury. Sleep disturbance results in cognitive decline and slows reaction time which is crucial for completing tasks and solving problems.23,25,26 Consequently, poor sleep health influence lowers decision-making function, and increases mistakes during the job which leads to resultant accidents and errors in workplace.25
The finding of this study that sleep disturbance is related to occupational injury is consistent with the findings of previous studies.18,27,28,29,30 A systemic review and meta-analysis that analyzed 27 studies also concluded that sleep problems increase the risk of being injured at work by 62% (RR: 1.62; 95% CI: 1.43-1.84).19 A cohort study investigated the role of sleep disturbances in occupational injury among Swedish women reported persistent insomnia increased risk of occupational accident.31 Several reviews have reported that obstructive sleep apnea,32,33 sleepiness,34,35 and hypersomnia36 increased the risk of work-related traffic accidents among commercial drivers. It was reported that in cases of professional driving jobs, crashes were more likely with longer working hours, which occur because of lack of sleep or rest and poor working conditions.31,37,38 Drowsy driving accounts for approximately 25 percent of all traffic accidents.39
The result of this study and previous studies suggest intervention program for workers' sleep-related problems and fatigue may be helpful to reduce occupational injuries.40 For instance, fatigue risk management system (FRMS) is employed in sectors related serious result when accidents occur, such as public transportation and aviation.40,41 Also intervention program for sleep apnea among drivers can reduce drowsy driving and traffic accidents.42 A randomized clinical trial in 2017 reported firefighters who had completed sleep disorders screening and joined education sessions reported 46% fewer disability days than control group.43 Effective intervention programs for sleep disturbance related accidents and injuries should be developed in the future.
This study has several strengths. First, this study contributes to the existing knowledge base of the association between sleep disturbance and occupational injury using nationally representative sample. There was no large-scale study applying validated questionnaire tools to assess sleep disturbance on this topic in Korea. Second, in subgroup analysis, we observed that participants having sleep disturbance showed higher OR for occupational injury than normal participants in most subgroups. Third, the higher the MISS score was, the higher the OR for occupational injury was observed regardless of adjustment.
This study has several limitations. First, this study was a cross-sectional study. Causal relationship could not be established although the positive association between sleep disturbance and occupational injury was observed. Second, other aspects of sleep disturbance were not investigated in 5th KWCS, including daytime sleepiness, sleep debt, and poor sleep quality. Third, it is not clear about the severity or type of occupational injury because there is no such question in the 5th KWCS.
CONCLUSIONS
This study not only observed an association between sleep disturbance and occupational injury but also found that the higher MISS score, the higher the risk of occupational injury. Prospective cohort study or intervention studies will be necessary in the future. In addition, it is necessary to prevent occupational injury by introducing intervention programs to manage sleep disturbance and fatigue.
ACKNOWLEDGEMENTS
The authors appreciate the Occupational Safety and Health Research Institute (OSHRI) for offering the data from the 5th Korean working conditions survey.
-
Funding: This research is supported by national research fund of Korea (NRF-2021R1C1C1007796).
-
Competing interests: The authors declare that they have no competing interest.
-
Author contributions:
NOTES
- 1. Vgontzas AN, Liao D, Pejovic S, Calhoun S, Karataraki M, Basta M, et al. Insomnia with short sleep duration and mortality: the Penn State cohort. Sleep 2010;33(9):1159–1164. 20857861.ArticlePubMedPMC
- 2. Rod NH, Vahtera J, Westerlund H, Kivimaki M, Zins M, Goldberg M, et al. Sleep disturbances and cause-specific mortality: results from the GAZEL cohort study. Am J Epidemiol 2011;173(3):300–309. 21193534.ArticlePubMedPMC
- 3. Yaggi HK, Araujo AB, McKinlay JB. Sleep duration as a risk factor for the development of type 2 diabetes. Diabetes Care 2006;29(3):657–661. 16505522.ArticlePubMedPDF
- 4. Gangwisch JE, Heymsfield SB, Boden-Albala B, Buijs RM, Kreier F, Pickering TG, et al. Sleep duration as a risk factor for diabetes incidence in a large U.S. sample. Sleep 2007;30(12):1667–1673. 18246976.ArticlePubMedPMC
- 5. Beccuti G, Pannain S. Sleep and obesity. Curr Opin Clin Nutr Metab Care 2011;14(4):402–412. 21659802.ArticlePubMedPMC
- 6. Panossian LA, Veasey SC. Daytime sleepiness in obesity: mechanisms beyond obstructive sleep apnea--a review. Sleep (Basel) 2012;35(5):605–615.ArticlePubMedPMC
- 7. Morin CM, Bélanger L, LeBlanc M, Ivers H, Savard J, Espie CA, et al. The natural history of insomnia: a population-based 3-year longitudinal study. Arch Intern Med 2009;169(5):447–453. 19273774.ArticlePubMed
- 8. McCall WV. A psychiatric perspective on insomnia. J Clin Psychiatry 2001;62(Suppl 10):27–32.
- 9. Broman JE, Smedje H, Mallon L, Hetta J. The Minimal Insomnia Symptom Scale (MISS): a brief measure of sleeping difficulties. Ups J Med Sci 2008;113(2):131–142. 18509808.PubMed
- 10. Vallières A, Azaiez A, Moreau V, LeBlanc M, Morin CM. Insomnia in shift work. Sleep Med 2014;15(12):1440–1448. 25277664.ArticlePubMed
- 11. Chung S, Cho SW, Jo MW, Youn S, Lee J, Sim CS. The prevalence and incidence of insomnia in Korea during 2005 to 2013. Psychiatry Investig 2020;17(6):533–540.ArticlePubMedPMCPDF
- 12. Korea Occupational Safety and Health Agency. Occurrence of industrial accidents in 2019. Updated 2020]. Accessed May 28, 2021]. https://www.kosha.or.kr/kosha/data/industrialAccidentStatus.do?mode=view&boardNo=229&articleNo=412099&attachNo= .
- 13. Survey on industrial accident coverage and direction of improvement of system: 2014 state audit and processing results evaluation report 2015-3. Updated 2015]. Accessed July 13, 2021]. https://www.nars.go.kr/report/view.do?cmsCode=CM0018&brdSeq=17121 .
- 14. Wilkins K, Mackenzie SG. Work injuries. Health Rep 2007;18(3):25–42. 17892250.PubMed
- 15. Kachan D, Fleming LE, LeBlanc WG, Goodman E, Arheart KL, Caban-Martinez AJ, et al. Worker populations at risk for work-related injuries across the life course. Am J Ind Med 2012;55(4):361–366. 22170632.ArticlePubMedPMC
- 16. Shi J, Wheeler KK, Lu B, Bishai DM, Stallones L, Xiang H. Medical expenditures associated with nonfatal occupational injuries among U.S. workers reporting persistent disabilities. Disabil Health J 2015;8(3):397–406. 25573252.ArticlePubMed
- 17. Salminen S, Oksanen T, Vahtera J, Sallinen M, Härmä M, Salo P, et al. Sleep disturbances as a predictor of occupational injuries among public sector workers. J Sleep Res 2010;19(1 Pt 2):207–213. 19840241.ArticlePubMed
- 18. Chau N, Mur JM, Touron C, Benamghar L, Dehaene D. Correlates of occupational injuries for various jobs in railway workers: a case-control study. J Occup Health 2004;46(4):272–280. 15308826.ArticlePubMedPDF
- 19. Uehli K, Mehta AJ, Miedinger D, Hug K, Schindler C, Holsboer-Trachsler E, et al. Sleep problems and work injuries: a systematic review and meta-analysis. Sleep Med Rev 2014;18(1):61–73. 23702220.ArticlePubMed
- 20. Hyun SH. Associations between working conditions and occupational injury of Korean employees. J Digit Converg 2018;16(12):523–531.
- 21. Shin DS. Characteristics of taxi, bus and truck drivers in industrial and traffic accidents databases, and sleep disorder and depression in working conditions survey [dissertation]. Seoul, Korea: Hansung University; 2019.
- 22. Shin SH, Kim DH, Ahn JH, Kim HD, Kim JH, Kang HM, et al. Factors associated with occupational injuries of ship-building supply workers in Busan. Korean J Occup Environ Med 2008;20(1):15–24.ArticlePDF
- 23. Grandner MA. Sleep and Health. Oxford, UK: Academic Press; 2019.
- 24. Occupational Safety and Health Research Institute. User guide of raw data for the 5the Korean Working Conditions Survey. Updated 2017]. Accessed May 27, 2021]. https://oshri.kosha.or.kr/eoshri/resources/KWCSDownload.do .
- 25. Rosekind MR, Gregory KB, Mallis MM, Brandt SL, Seal B, Lerner D. The cost of poor sleep: workplace productivity loss and associated costs. J Occup Environ Med 2010;52(1):91–98. 20042880.ArticlePubMed
- 26. Goel N, Rao H, Durmer JS, Dinges DF. Neurocognitive consequences of sleep deprivation. Semin Neurol 2009;29(4):320–339. 19742409.ArticlePubMedPMC
- 27. Chau N, Mur JM, Benamghar L, Siegfried C, Dangelzer JL, Français M, et al. Relationships between certain individual characteristics and occupational injuries for various jobs in the construction industry: a case-control study. Am J Ind Med 2004;45(1):84–92. 14691972.ArticlePubMed
- 28. Gauchard GC, Mur JM, Touron C, Benamghar L, Dehaene D, Perrin P, et al. Determinants of accident proneness: a case-control study in railway workers. Occup Med (Lond) 2006;56(3):187–190. 16452131.ArticlePubMed
- 29. Lavie P, Kremerman S, Wiel M. Sleep disorders and safety at work in industry workers. Accid Anal Prev 1982;14(4):311–314.Article
- 30. Pérez-Chada D, Videla AJ, O'Flaherty ME, Palermo P, Meoni J, Sarchi MI, et al. Sleep habits and accident risk among truck drivers: a cross-sectional study in Argentina. Sleep 2005;28(9):1103–1108. 16268379.ArticlePubMed
- 31. Hägg SA, Torén K, Lindberg E. Role of sleep disturbances in occupational accidents among women. Scand J Work Environ Health 2015;41(4):368–376. 25830787.ArticlePubMed
- 32. AlGhanim N, Comondore VR, Fleetham J, Marra CA, Ayas NT. The economic impact of obstructive sleep apnea. Lung 2008;186(1):7–12. 18066623.ArticlePubMedPDF
- 33. Hirsch Allen AJ, Peres B, Ayas NT. Obstructive sleep apnea severity and the risk of occupational injury: a prospective observational cohort. Lung 2020;198(2):283–287. 31965242.ArticlePubMedPDF
- 34. Robb G, Sultana S, Ameratunga S, Jackson R. A systematic review of epidemiological studies investigating risk factors for work-related road traffic crashes and injuries. Inj Prev 2008;14(1):51–58. 18245316.ArticlePubMed
- 35. Connor J, Whitlock G, Norton R, Jackson R. The role of driver sleepiness in car crashes: a systematic review of epidemiological studies. Accid Anal Prev 2001;33(1):31–41. 11189120.ArticlePubMed
- 36. Bayon V, Léger D, Philip P. Socio-professional handicap and accidental risk in patients with hypersomnias of central origin. Sleep Med Rev 2009;13(6):421–426. 19493688.ArticlePubMed
- 37. Stevenson MR, Elkington J, Sharwood L, Meuleners L, Ivers R, Boufous S, et al. The role of sleepiness, sleep disorders, and the work environment on heavy-vehicle crashes in 2 Australian states. Am J Epidemiol 2014;179(5):594–601. 24352592.ArticlePubMed
- 38. Chen GX, Fang Y, Guo F, Hanowski RJ. The influence of daily sleep patterns of commercial truck drivers on driving performance. Accid Anal Prev 2016;91:55–63. 26954762.ArticlePubMedPMC
- 39. Ward KL, Hillman DR, James A, Bremner AP, Simpson L, Cooper MN, et al. Excessive daytime sleepiness increases the risk of motor vehicle crash in obstructive sleep apnea. J Clin Sleep Med 2013;9(10):1013–1021. 24127145.ArticlePubMedPMCPDF
- 40. Anund A, Fors C, Kecklund G, van Leeuwen W, Åkerstedt T. Countermeasures for Fatigue in Transportation: a Review of Existing Methods for Drivers on Road, Rail, Sea and in Aviation. Linköping, Sweden: Swedish National Road and Transport Research Institute; 2015.
- 41. European Aviation Safety Agency. Notice of Proposed Amendment (NPA) No 2009-02d. Implementing rules for air operations of community operators. Updated 2009]. Accessed May 28, 2021]. http://easa.europa.eu/rulemaking/docs/npa/2009/NPA%202009-02D.pdf .
- 42. Hersman DA, Whitcomb EA. Fatigue risk management in high-risk environments: a call to action. Prehosp Emerg Care 2018;22(sup1):1–2.Article
- 43. Sullivan JP, O'Brien CS, Barger LK, Rajaratnam SM, Czeisler CA, Lockley SW. Randomized, prospective study of the impact of a sleep health program on firefighter injury and disability. Sleep 2017;40(1):zsw001.ArticlePubMedPMC
REFERENCES
REFERENCES
Figure & Data
REFERENCES
Citations
Citations to this article as recorded by 
- Exploring β-caryophyllene: a non-psychotropic cannabinoid's potential in mitigating cognitive impairment induced by sleep deprivation
Cher Ryn Lim, Satoshi Ogawa, Yatinesh Kumari
Archives of Pharmacal Research.2025; 48(1): 1. CrossRef - Do work stress and sleep problems mediate the link between occupational injury and psychological distress? Evidence from a cross-sectional study of Ghanaian small-scale miners
Emmanuel Nyaaba, Pius W. Kudeto, Vanessa F. Epis, Patrick Azong
Geopsychiatry.2025; 2: 100023. CrossRef - Sleep Disturbance Among Workers: Interaction and Mediation of Job Satisfaction and Social Support
Jian Lee, Jongmin Lee, Juyeon Oh, Hyejin Kim, Subin Kim, Heejoo Park, Juho Sim, Byungyoon Yun, Jin-Ha Yoon
Journal of Korean Medical Science.2025;[Epub] CrossRef - The role of sleep disorder and disturbance in the occurrence of occupational injuries among industry workers in Ethiopia: A systematic review and meta-analysis
Anmut Endalkachew Bezie, Asmare Asrat Yirdaw, Eyob Tilahun Abeje, Lamrot Yohannes, Giziew Abere, Awoke Keleb
Sage Open Medicine.2025;[Epub] CrossRef - The changing dynamics of work from home and its association with sleep disturbance through work–family conflict during the COVID-19 pandemic
Jaehyuk Jung, Jiyoung Lim, Yong Hyuk Cho, Jae Bum Park, Inchul Jeong
Journal of Occupational Health.2024;[Epub] CrossRef - Sleep quality and hypertension in an indigenous African population: a cross-sectional investigation from the COMBAT-CVDs study
Oluwafemi Gbolahan Aremu, Osahon Jeffery Asowata, David Kadan Danladi, Akinkunmi Paul Okekunle, Onoja Matthew Akpa
Journal of Human Hypertension.2024;[Epub] CrossRef - Exploring Clinical Trials to Manage Firefighters’ Sleep Quality: A PRISMA Compliant Systematic Review
Sara Alves, Josiana Vaz, Adília Fernandes
International Journal of Environmental Research and Public Health.2023; 20(5): 3862. CrossRef - Economic costs and Predictors of occupation-related Injuries in Ethiopian sugar industries from the Employer’s perspective: top-down approach and friction method
Mitiku Bonsa Debela, Muluken Azage, Negussie Deyessa, Achenef Motbainor Begosaw
BMC Public Health.2022;[Epub] CrossRef - Changes in the Health Indicators of Hospital Medical Residents During the Four-Year Training Period in Korea
Ji-Sung Ahn, Seunghyeon Cho, Won-Ju Park
Journal of Korean Medical Science.2022;[Epub] CrossRef - Shiftwork Is Associated with Higher Food Insecurity in U.S. Workers: Findings from a Cross-Sectional Study (NHANES)
Maximilian Andreas Storz, Gianluca Rizzo, Mauro Lombardo
International Journal of Environmental Research and Public Health.2022; 19(5): 2847. CrossRef
 Cite
Cite- Figure
-
- Related articles
-
- Relationship between shark meat intake and blood mercury concentration in Korean adolescents
- Association between serum iron levels and low-frequency hearing loss in Korean females
- Association between multiple jobs and physical and psychological symptoms among the Korean working population
- Association between work from home and health-related productivity loss among Korean employees
Association between sleep disturbance and occupational injury among Korean employees
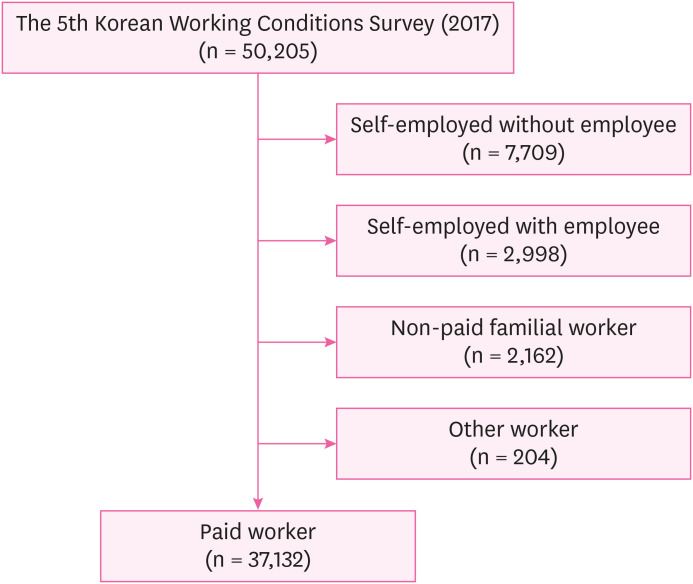
Fig. 1 Participant enrollment flowchart.
Fig. 1
Association between sleep disturbance and occupational injury among Korean employees
| Characteristics | Total | Sleep disturbance (−)a | Sleep disturbance (+)a | |
|---|---|---|---|---|
| Sex | ||||
| Male | 21,083 (56.8) | 19,747 (93.7) | 1,336 (6.3) | |
| Female | 16,037 (43.2) | 14,881 (92.8) | 1,156 (7.2) | |
| Age | ||||
| 15–39 | 16,160 (43.5) | 15,167 (93.9) | 993 (6.1) | |
| 40–49 | 9,386 (25.2) | 8,763 (93.4) | 624 (6.6) | |
| 50–59 | 7,450 (20.0) | 6,879 (92.3) | 571 (7.7) | |
| ≥ 60 | 4,124 (11.1) | 3,820 (92.6) | 304 (7.4) | |
| Education | ||||
| College or higher | 22,306 (60.1) | 20,923 (93.8) | 1,382 (6.2) | |
| High school | 11,575 (31.2) | 10,706 (92.5) | 869 (7.5) | |
| Middle school or lower | 3,209 (8.7) | 2,970 (92.6) | 239 (7.5) | |
| Income | ||||
| Lowest | 7,277 (20.9) | 6,774 (93.1) | 503 (6.9) | |
| Low middle | 8,153 (23.4) | 7,576 (92.9) | 577 (7.1) | |
| High middle | 9,463 (27.2) | 8,914 (94.2) | 549 (5.8) | |
| Highest | 9,909 (28.5) | 9,292 (93.8) | 617 (6.2) | |
| Employment status | ||||
| Regular | 30,063 (81.0) | 28,056 (93.3) | 2,007 (6.7) | |
| Temporary | 5,132 (13.8) | 4,767 (92.9) | 364 (7.1) | |
| Daily | 1,926 (5.2) | 1,805 (93.7) | 121 (6.3) | |
| Occupation | ||||
| Professional & managerial | 8,797 (23.8) | 8,249 (93.8) | 548 (6.2) | |
| Clerical | 9,061 (24.5) | 8,517 (94.0) | 544 (6.0) | |
| Sales & service | 7,479 (20.2) | 6,913 (92.4) | 566 (7.6) | |
| Manual | 11,664 (31.5) | 10,839 (92.9) | 825 (7.1) | |
| Weekly working hours | ||||
| 1–34 | 3,857 (10.4) | 3,586 (93.0) | 271 (7.0) | |
| 35–40 | 18,168 (48.9) | 17,115 (94.2) | 1,053 (5.8) | |
| 41–52 | 10,146 (27.3) | 9,419 (92.8) | 727 (7.2) | |
| 53–60 | 3,647 (9.8) | 3,355 (92.0) | 293 (8.0) | |
| ≥ 61 | 1,301 (3.5) | 1,154 (88.7) | 147 (11.3) | |
| Shift work | ||||
| No | 32,715 (88.2) | 30,616 (93.6) | 2,099 (6.4) | |
| Yes | 4,394 (11.8) | 4,002 (91.1) | 391 (8.9) | |
| Perceived risk at work | ||||
| Risk (−) | 33,050 (89.1) | 30,906 (93.5) | 2,144 (6.5) | |
| Risk (+) | 4,028 (10.9) | 3,681 (91.4) | 346 (8.6) | |
| Factors | Occupational injury (−) | Occupational injury (+) | |
|---|---|---|---|
| Sleep disturbancea | |||
| (−) | 34,298 (99.1) | 322 (0.9) | |
| (+) | 2,433 (97.7) | 56 (2.3) | |
| MISS scoreb | |||
| 1Q | 18,264 (99.4) | 103 (0.6) | |
| 2Q | 4,399 (99.3) | 32 (0.7) | |
| 3Q | 8,288 (98.4) | 137 (1.6) | |
| 4Q | 5,781 (98.2) | 106 (1.8) | |
| Difficulty falling asleep | |||
| (−) | 35,053 (99.0) | 362 (1.0) | |
| (+) | 1,687 (99.1) | 16 (0.9) | |
| Waking up repeatedly during the sleep | |||
| (−) | 35,345 (99.0) | 341 (1.0) | |
| (+) | 1,393 (97.4) | 38 (2.6) | |
| Waking up with a feeling of exhaustion and fatigue | |||
| (−) | 35,306 (99.1) | 336 (0.9) | |
| (+) | 1,428 (97.1) | 42 (2.9) | |
| Sex | |||
| Female | 20,784 (98.6) | 297 (1.4) | |
| Male | 15,959 (99.5) | 81 (5.0) | |
| Age | |||
| 15–39 | 16,044 (92.3) | 118 (7.3) | |
| 40–49 | 9,268 (98.7) | 121 (1.3) | |
| 50–59 | 7,362 (98.8) | 87 (1.2) | |
| ≥ 60 | 4,069 (98.7) | 52 (1.3) | |
| Education | |||
| College or higher | 22,151 (99.3) | 163 (0.7) | |
| High school | 11,410 (98.6) | 160 (1.4) | |
| Middle school or lower | 3,151 (98.3) | 54 (1.7) | |
| Income | |||
| Lowest | 7,227 (99.3) | 48 (6.6) | |
| Low middle | 8,082 (99.2) | 68 (8.4) | |
| High middle | 9,357 (98.9) | 107 (1.1) | |
| Highest | 9,781 (98.7) | 128 (1.3) | |
| Employment status | |||
| Regular | 29,787 (99.1) | 279 (0.9) | |
| Temporary | 5,087 (99.1) | 45 (0.9) | |
| Daily | 1,869 (97.2) | 54 (2.8) | |
| Occupation | |||
| Professional & managerial | 8,744 (99.4) | 57 (0.6) | |
| Clerical | 9,041 (99.8) | 22 (0.2) | |
| Sales & service | 7,417 (99.2) | 60 (0.8) | |
| Manual | 11,423 (98.0) | 239 (2.0) | |
| Weekly working hours | |||
| 1–34 | 3,836 (99.5) | 21 (5.4) | |
| 35–40 | 18,048 (99.3) | 127 (0.7) | |
| 41–52 | 10,029 (98.9) | 111 (1.1) | |
| 53–60 | 3,571 (97.9) | 77 (2.1) | |
| ≥ 60 | 1,259 (96.7) | 42 (3.3) | |
| Shift work | |||
| No | 32,390 (99.0) | 325 (1.0) | |
| Yes | 4,345 (98.9) | 49 (1.1) | |
| Company size | |||
| 1–4 | 7,220 (99.2) | 57 (0.8) | |
| 5–49 | 17,133 (98.9) | 197 (1.1) | |
| 50–499 | 7,323 (99.1) | 67 (0.9) | |
| ≥ 500 | 4,803 (99.0) | 48 (1.0) | |
| Working hours type | |||
| Full-time | 32,523 (98.9) | 346 (1.1) | |
| Part-time | 4,197 (99.2) | 32 (0.8) | |
| Sleep disturbancea | Total | Occupational injury (−) | Occupational injury (+) | OR (95% CI) | ||
|---|---|---|---|---|---|---|
| Sex | ||||||
| Male | (−) | 19,743 (93.7) | 19,486 (98.7) | 256 (1.3) | 1 | |
| (+) | 1,334 (6.3) | 1,293 (96.9) | 41 (3.1) | 2.40 (1.47–3.92) | ||
| Female | (−) | 14,877 (92.8) | 14,812 (99.6) | 65 (0.4) | 1 | |
| (+) | 1,156 (7.2) | 1,140 (98.7) | 16 (1.4) | 3.10 (1.60–6.01) | ||
| Age | ||||||
| 15–39 | (−) | 15,165 (93.9) | 15,077 (99.4) | 88 (0.6) | 1 | |
| (+) | 991 (6.1) | 961 (97.0) | 30 (3.0) | 5.30 (2.84–9.87) | ||
| 40–49 | (−) | 8,760 (93.4) | 8,645 (98.7) | 115 (1.3) | 1 | |
| (+) | 624 (6.6) | 617 (99.0) | 7 (1.0) | 0.79 (0.27–2.35) | ||
| 50–59 | (−) | 6,878 (92.3) | 6,800 (98.9) | 78 (1.1) | 1 | |
| (+) | 571 (7.7) | 562 (98.4) | 9 (1.6) | 1.43 (0.33–3.08) | ||
| ≥ 60 | (−) | 3,817 (92.6) | 3,777 (98.9) | 41 (1.1) | 1 | |
| (+) | 304 (7.3) | 293 (96.4) | 11 (3.6) | 3.50 (1.33–9.25) | ||
| Employment status | ||||||
| Regular | (−) | 28,052 (93.3) | 27,814 (99.2) | 238 (0.8) | 1 | |
| (+) | 2,004 (6.7) | 1,963 (98.0) | 41 (2.0) | 2.43 (1.49–3.96) | ||
| Temporary | (−) | 4,765 (92.9) | 4,729 (99.2) | 36 (0.8) | 1 | |
| (+) | 364 (7.1) | 355 (97.5) | 9 (2.5) | 3.32 (1.25–8.86) | ||
| Daily | (−) | 1,802 (93.7) | 1,755 (97.4) | 48 (2.6) | 1 | |
| (+) | 121 (6.3) | 114 (94.6) | 7 (5.4) | 2.12 (0.83–5.43) | ||
| Occupation | ||||||
| Professional & managerial | (−) | 8,249 (93.8) | 8,206 (99.5) | 43 (0.5) | 1 | |
| (+) | 545 (6.2) | 532 (97.5) | 13 (2.5) | 4.75 (1.83–12.40) | ||
| Clerical | (−) | 8,515 (94.0) | 8,495 (99.8) | 20 (0.2) | 1 | |
| (+) | 544 (6.0) | 541 (99.5) | 3 (0.5) | 2.18 (0.45–10.68) | ||
| Sales & service | (−) | 7,416 (99.2) | 6,854 (99.2) | 562 (99.2) | 1 | |
| (+) | 60 (0.8) | 56 (0.8) | 4 (0.8) | 0.96 (0.33–2.83) | ||
| Manual | (−) | 10,835 (92.9) | 10,632 (98.1) | 203 (1.9) | 1 | |
| (+) | 825 (7.1) | 789 (95.6) | 36 (4.4) | 2.39 (1.44–3.94) | ||
| Weekly working hours | ||||||
| 1–34 | (−) | 3,583 (92.9) | 3,569 (99.6) | 14 (0.4) | 1 | |
| (+) | 271 (7.0) | 265 (97.6) | 7 (2.4) | 6.18 (2.08–18.35) | ||
| 35–40 | (−) | 17,113 (94.2) | 16,999 (99.3) | 114 (0.7) | 1 | |
| (+) | 1,053 (5.8) | 1,040 (98.8) | 12 (1.2) | 1.77 (0.85–3.70) | ||
| 41–52 | (−) | 9,414 (92.8) | 9,323 (99.0) | 92 (1.0) | 1 | |
| (+) | 725 (7.2) | 706 (97.4) | 19 (2.6) | 2.71 (1.27–5.77) | ||
| 53–60 | (−) | 3,355 (92.0) | 3,288 (98.0) | 67 (2.0) | 1 | |
| (+) | 293 (8.0) | 283 (96.5) | 10 (3.5) | 1.77 (0.71–4.40) | ||
| ≥ 61 | (−) | 1,154 (88.7) | 1,120 (97.1) | 34 (2.9) | 1 | |
| (+) | 147 (11.3) | 139 (94.3) | 8 (5.7) | 2.01 (0.66–6.13) | ||
| Shift work | ||||||
| No | (−) | 30,608 (93.6) | 30,324 (99.1) | 284 (0.9) | 1 | |
| (+) | 2,096 (6.4) | 2,055 (98.0) | 41 (2.0) | 2.15 (1.36–3.39) | ||
| Yes | (−) | 4,002 (91.0) | 3,967 (99.1) | 35 (0.9) | 1 | |
| (+) | 391 (8.9) | 378 (96.6) | 13 (3.4) | 3.96 (1.61–9.75) | ||
| Company size | ||||||
| 1–4 | (−) | 6,732 (92.5) | 6,681 (99.2) | 51 (0.8) | 1 | |
| (+) | 542 (7.5) | 536 (98.9) | 6 (1.1) | 1.48 (0.45–4.84) | ||
| 5–49 | (−) | 16,150 (93.2) | 15,985 (99.0) | 165 (1.0) | 1 | |
| (+) | 1,175 (6.8) | 1,143 (97.2) | 33 (2.8) | 2.76 (1.64–4.65) | ||
| 50–499 | (−) | 6,927 (93.7) | 6,868 (99.1) | 59 (0.9) | 1 | |
| (+) | 462 (6.3) | 455 (98.4) | 8 (1.6) | 1.92 (0.67–5.51) | ||
| ≥ 500 | (−) | 4,575 (94.4) | 4,537 (99.2) | 39 (0.8) | 1 | |
| (+) | 271 (5.6) | 262 (96.7) | 9 (33.0) | 4.01 (1.28–12.53) | ||
| Variables | Total | Occupational injury (−) | Occupational injury (+) | Unadjusted | Model 1a | Model 2b | Model 3c | |
|---|---|---|---|---|---|---|---|---|
| No. (%: column percent) | No. (%: row percent) | No. (%: row percent) | OR (95% CI) | OR (95% CI) | OR (95% CI) | OR (95% CI) | ||
| Sleep disturbanced | ||||||||
| (−) | 34,620 (93.3) | 34,298 (99.1) | 322 (0.9) | 1 | 1 | 1 | 1 | |
| (+) | 2,489 (6.7) | 2,433 (97.7) | 56 (2.3) | 2.47 (1.66–3.69) | 2.91 (1.93–4.39) | 2.72 (1.79–4.12) | 2.57 (1.68–3.93) | |
| MISS scoree | ||||||||
| 1Q | 18,367 (49.5) | 18,264 (99.4) | 103 (0.6) | 1 | 1 | 1 | 1 | |
| 2Q | 4,430 (11.9) | 4,399 (99.3) | 32 (0.7) | 1.28 (0.72–2.28) | 1.27 (1.81–2.29) | 1.23 (0.68–2.23) | 1.10 (0.60–2.01) | |
| 3Q | 8,425 (22.7) | 8,288 (98.4) | 137 (1.6) | 2.93 (2.00–4.28) | 2.68 (1.81–3.97) | 2.61 (1.76–3.87) | 2.27 (1.53–3.38) | |
| 4Q | 5,887 (15.9) | 5,781 (98.2) | 106 (1.8) | 3.26 (2.19–4.86) | 3.39 (2.24–5.12) | 3.14 (2.07–4.77) | 2.80 (1.84–4.26) | |
| Sleep-related symptoms | Total | Occupational injury (−) | Occupational injury (+) | Unadjusted | Model 1a | Model 2b | Model 3c | |
|---|---|---|---|---|---|---|---|---|
| No. (%: column percent) | No. (%: row percent) | No. (%: row percent) | OR (95% CI) | OR (95% CI) | OR (95% CI) | OR (95% CI) | ||
| Difficulty falling asleep | ||||||||
| (−) | 35,415 (95.4) | 35,053 (99.0) | 362 (1.0) | 1 | 1 | 1 | 1 | |
| (+) | 1,702 (4.6) | 1,687 (99.1) | 16 (0.9) | 0.91 (0.45–1.82) | 1.09 (0.54–2.22) | 1.09 (0.54–2.21) | 1.15 (0.57–2.35) | |
| Waking up repeatedly during sleep | ||||||||
| (−) | 35,685 (96.1) | 35,345 (99.0) | 341 (1.0) | 1 | 1 | 1 | 1 | |
| (+) | 1,430 (3.9) | 1,393 (97.4) | 38 (2.6) | 2.80 (1.68–4.67) | 3.41 (2.01–5.77) | 3.33 (1.96–5.67) | 3.28 (1.92–5.62) | |
| Waking up with a feeling of exhaustion and fatigue | ||||||||
| (−) | 35,641 (96.0) | 35,306 (99.1) | 336 (0.9) | 1 | 1 | 1 | 1 | |
| (+) | 1,470 (4.0) | 1,428 (97.1) | 42 (2.9) | 3.13 (2.04–4.79) | 3.19 (2.06–4.94) | 3.03 (1.96–4.68) | 2.64 (1.69–4.11) | |
Table 1 Characteristics of the study population by sleep disturbance
Values are presented as number (%: row percent).
aPatients with ≥ 6 points were considered to have sleep disturbance and those with < 6 points were considered to have normal sleep using the Minimal Insomnia Symptoms Scale (MISS).
Table 2 Occupational injury and related factors
Values are presented as number (%).
aPatients with ≥ 6 points were considered to have sleep disturbance and those with < 6 points were considered to have normal sleep using the Minimal Insomnia Symptoms Scale (MISS).
bMISS score was categorized into quartiles as follows (1st quartile:1 point; 2nd quartile: 2 points; 3rd quartile: 3–4 points; and 4th quartile: > 4 points).
MISS: Minimal Insomnia Symptoms Scale.
Table 3 Association between sleep disturbance and occupational injury by subgroups
ORs are estimated by univariable logistic regression analysis.
OR: odds ratio; CI: confidence interval.
aPatients with ≥ 6 points were considered to have sleep disturbance and those with < 6 points were considered to have normal sleep using the Minimal Insomnia Symptoms Scale (MISS).
Table 4 Association between sleep disturbance and occupational injury by logistic regression analysis
OR: odds ratio; CI: confidence interval; MISS: Minimal Insomnia Symptoms Scale.
aModel 1: adjusted for age, sex, education, income, occupation, and employment status. bModel 2: adjusted for age, sex, education, income, occupation, employment status, shift work, and working hours. cModel 3: adjusted for age, sex, education, income, occupation, employment status, shift work, working hours, and perceived risk at work. dPatients with ≥ 6 points were considered to have sleep disturbance and those with < 6 points were considered to have normal sleep using the Minimal Insomnia Symptoms Scale (MISS). eMISS score was categorized into quartiles as follows (1st quartile:1 point; 2nd quartile: 2 points; 3rd quartile: 3–4 points; and 4th quartile: > 4 points).
Table 5 Association between sleep-related symptoms and occupational injury by logistic regression analysis
OR: odds ratio; CI: confidence interval.
aModel 1: adjusted for age, sex, education, income, occupation, and employment status. bModel 2: adjusted for age, sex, education, income, occupation, employment status, shift work, and working hours. cModel 3: adjusted for age, sex, education, income, occupation, employment status, shift work, working hours, and perceived risk at work.

