
Articles
- Page Path
- HOME > Ann Occup Environ Med > Volume 37; 2025 > Article
- Original Article Association between urinary polycyclic aromatic hydrocarbon metabolites and the prevalence of respiratory disease in residents living near Pohang Industrial Complex
-
Minji Kim1
 , Sangwoo Lim1, Seongrok Kim1, Jea Chul Ha1,2, Hyunjoo Kim3, Insung Chung1,2,*
 -
Annals of Occupational and Environmental Medicine 2025;37:e27.
DOI: https://doi.org/10.35371/aoem.2025.37.e27
Published online: September 22, 2025
1Department of Occupational and Environmental Medicine, Keimyung University Dongsan Medical Center, Daegu, Korea
2Department of Occupational and Environmental Medicine, Keimyung University School of Medicine, Daegu, Korea
3Department of Occupational and Environmental Medicine, Ewha Womans University Mokdong Hospital, Seoul, Korea
- *Corresponding author: Insung Chung Department of Occupational and Environmental Medicine, Keimyung University School of Medicine, 1035 Dalgubeol-daero, Dalseo-gu, Daegu 42601, Korea E-mail: ichungs70@gmail.com
• Received: March 24, 2024 • Revised: June 1, 2024 • Accepted: September 14, 2024
© 2025 Korean Society of Occupational & Environmental Medicine
This is an Open Access article distributed under the terms of the Creative Commons Attribution Non-Commercial License (https://creativecommons.org/licenses/by-nc/4.0/) which permits unrestricted non-commercial use, distribution, and reproduction in any medium, provided the original work is properly cited.
- 2,391 Views
- 169 Download
Abstract
-
Background Polycyclic aromatic hydrocarbons are generated from the incomplete combustion of organic materials such as fossil fuels and wood. These compounds, often inhaled, cause respiratory issues like asthma and chronic obstructive pulmonary disease due to oxidative stress and inflammation. Pohang, South Korea’s iron and steel hub, experiences significant polycyclic aromatic hydrocarbons emissions from extensive industrial activities and heavy truck movements. This study investigates the link between urinary polycyclic aromatic hydrocarbons metabolites and respiratory diseases among Pohang residents, considering their cumulative exposure and duration of residency.
-
Methods Utilizing data from the National Environmental Research Institute’s health impact assessment conducted between 2012 and 2015, this study included 1,189 participants from Pohang. Urinary concentrations of polycyclic aromatic hydrocarbons metabolites served as exposure indicators. The study assessed the correlation between these metabolite levels and self-reported respiratory diseases, considering variables such as duration of residence, smoking status, and occupational exposures. Statistical analyses involved logistic regression and fixed-effect meta-analysis.
-
Results The findings indicate a significant association between elevated levels of polycyclic aromatic hydrocarbons metabolites and an increased risk of respiratory diseases, particularly among those in the highest exposure quartile. The study also found a notable dose-response relationship, emphasizing the heightened risk with longer residency durations near the industrial complex. Despite yearly fluctuations, the trend suggests a persistent risk associated with high polycyclic aromatic hydrocarbons exposure.
-
Conclusions Elevated exposure to polycyclic aromatic hydrocarbons near industrial areas such as the Pohang Industrial Complex is significantly associated with an increased prevalence of respiratory diseases. The study underscores the importance of implementing public health strategies to reduce polycyclic aromatic hydrocarbons exposure, especially in industrial regions. Future research should broaden the scope of polycyclic aromatic hydrocarbons metabolites analyzed and consider comprehensive exposure histories to better understand the relationship between polycyclic aromatic hydrocarbons exposure and respiratory health outcomes.
BACKGROUND
Polycyclic aromatic hydrocarbons (PAHs) comprise over 100 distinct compounds characterized by their lack of heteroatoms, fused aromatic rings, and substituents. These compounds are primarily generated during incomplete combustion processes involving organic materials, such as wood, fossil fuels, tobacco smoke, automobile exhaust emissions, and thermal power generation.1-5 In addition, PAHs can enter the environment through discharge and subsequently be deposited into soil through wet precipitation or adsorbed onto airborne dust, where they can then be introduced to the surface in a gaseous state.6 PAHs with high molecular weights consisting of five or more aromatic rings are predominantly attached to particulate matter, whereas smaller PAHs with four or fewer aromatic rings are more commonly present in the gaseous phase.7,8 The concentrations of metabolites from low-molecular-weight PAHs, such as pyrene, phenanthrene, and naphthalene, in blood and urine are frequently utilized as proxies to evaluate exposure to airborne PAHs, as these smaller PAHs are comparatively less present in food.9,10 Larger PAHs are primarily sourced from food and undergo initial metabolism in the liver via first-pass elimination. Consequently, inhalation exposure is regarded as the primary contributor to the respiratory effects of PAHs.8,11
Several factors are involved in the mechanisms by which PAHs cause respiratory damage. Exposure to PAHs induces oxidative stress through the generation of reactive oxygen species, leading to chronic inflammation in the respiratory tract. This inflammation is a key factor in diseases such as asthma and chronic obstructive pulmonary disease (COPD), exacerbating existing respiratory conditions and increasing susceptibility to respiratory infections. PAH exposure can also result in lasting epigenetic modifications, such as DNA methylation. For example, prenatal exposure to PAHs has been linked to methylation of the ACSL3 gene in umbilical cord blood, which correlates with a heightened risk of asthma in children. These epigenetic changes can persist over time, affecting gene expression and contributing to long-term health issues. PAHs can modulate immune responses by interacting with the aryl hydrocarbon receptor, which regulates immune and inflammatory processes. This interaction can lead to immune system dysregulation, further promoting respiratory diseases like asthma and increasing susceptibility to infections.12-14
South Korea is the fifth-largest producer of iron and steel globally.15 Pohang, situated along the eastern coast of the Korean Peninsula, serves as the hub for South Korea’s iron and steel industry.16 This city, with a population of approximately 500,000, hosts over 300 companies, including POSCO, which is the country’s largest steel producer. These businesses are distributed across four dedicated steel industrial zones and six general complexes.16 In addition, the movement of heavy-duty trucks required to transport steel goods can contribute significantly to the presence of hazardous air pollutants in the Pohang region.16 Hence, the vicinity of the Pohang Industrial Complex remains susceptible to extensive steel-production operations and continuous PAH emissions from numerous interconnected industries, which potentially pose health hazards to nearby residents.5 In a 2012 research report, PAH concentrations in other regions and Pohang were compared and evaluated. Particulate PAH concentrations in Gwangyang and Pohang, both home to steel industrial complexes, were generally higher compared to Yeosu, Ulsan, and Daesan which include petrochemical complexes, and Gumi, which is dominated by electronics industrial complexes. The average concentration of particulate PAHs measured across four seasons from 2012 to 2013 in Pohang as follows: 20.37 ng/m3 in Cheongnim-dong, 8.36 ng/m3 in Haedo-dong, 7.12 ng/m3 in Heunghae-eup, and 6.61 ng/m3 in Yeonil-eup.17
This study examined the association between urinary PAH metabolites and prevalence of respiratory diseases among residents living near the Pohang Industrial Complex. Given the rapid metabolism and elimination of PAHs, this study investigated the relationship between cumulative exposure to PAHs and the incidence of respiratory diseases by considering the duration of residency.
METHODS
Over the span of 8 years, spanning from 2006 to 2009 and then from 2012 to 2015, the National Environmental Research Institute conducted a two-stage health impact assessment on the inhabitants of the Pohang Industrial Complex.17-20 This study focuses on addressing the health risks posed to residents in major industrial complex areas due to environmental pollution. It aims to establish a systematic framework for continuous monitoring and evaluation of pollutant exposure and its health effects. In the first phase, various opinions and data were collected to understand the exposure levels and health indicators. In the second phase, the study has transitioned to a cross-sectional approach, aiming to monitor the current exposure conditions and assess the health impacts on residents living near the industrial complex. We conducted our research using data from the second phase (2012–2015) of the study because urinary PAH metabolite monitoring was not performed in the first phase. This phase of the health impact assessment focused on residents of the Pohang who were aged 20 years or older and the sampling approach employed was a two-stage process. Initially, purposive quota sampling was utilized, followed by proportionate quota sampling based on sex and age.17
Of the 4,602 participants in the second phase, a subset of 1,189 individuals wrote consent forms and underwent analysis of PAH metabolite concentrations in their urine. Hence, this study included 1,189 participants in the study (Fig. 1).
Four specific substances, 1-hydroxypyrene (1-OHP), 1-hydroxyphenanthrene (1-OHPHE), 2-hydroxyfluorene (2-OHFLU), and 2-naphthol (2-NAP) were selected as urinary markers to assess PAH exposure, which accurately reflect human exposure to PAHs.21-23 The aforementioned substances, which indirectly reflect PAH exposure, were used to investigate their association with respiratory diseases. Urine samples (approximately 100 mL in total) were collected and stored in two separate 50 mL containers. The outer surfaces of these containers were promptly covered with foil and protected, after which they were frozen at –20℃. Once an adequate number of stored samples was collected, they were sent to a specialized analysis facility and the National Institute of Environmental Research for examination. Gas chromatography–mass spectrometry (GC-MS) was used for the simultaneous analysis.
For sample preparation, each test material, standard substance used for calibration, quality control materials, and analysis samples were divided into 5 mL portions and placed in a pretreatment container. To this, 20 µL of an internal standard substance, 20 µL of β-glucuronidase/aryl sulfatase enzyme, and 1 mL of 0.5 M sodium acetate buffer were added. The mixture was incubated for 16 hours with constant shaking at 180 rpm at 37℃, with the cap sealed. Subsequently, 0.7 g of magnesium sulfate was introduced and mixed thoroughly. To this solution, 4 mL of n-hexane was added, and the container was capped, shaken for 30 minutes, and centrifuged at 3,000 rpm for 20 minutes. The resulting supernatant was transferred to a test tube. This liquid-liquid extraction process was repeated twice, and the transferred solution was dried using a nitrogen concentrator.
Subsequently, 100 µL of the BSTFA derivatization reagent was added, the container was sealed with a stopper, and the mixture was allowed to react at 90℃ for 45 minutes. Once the reaction was complete, the sample was transferred to an amber vial after cooling and subjected to GC-MS analysis (Clarus 600T, PerkinElmer, Waltham, MA, USA).17
The survey primarily took the form of self-reports, and an automatic questionnaire coding machine was used to efficiently implement the questionnaire input. Resident briefing sessions were conducted to facilitate participants’ understanding and cooperation. The survey utilized the Comprehensive Environmental Health Assessment Questionnaire, with the initial survey conducted concurrently with the sample collection in 2012. Subsequent studies (from 2013 to 2015) were integrated with the initial survey, and a second sample collection was performed for those who provided biological samples during the survey.17-20 Individuals who responded that they were being treated, cured, or untreated were classified as having experience in diagnosing respiratory diseases (COPD, asthma, acute bronchitis, and pneumonia).
Various demographic and lifestyle factors were considered as potential confounding variables in this study, including age, sex, smoking habits, educational attainment, physical activity, and hazardous occupational exposure. Smoking status was categorized into two groups: current smokers and a combined group of ex-smokers and never-smokers. Educational level was grouped into three categories: middle school graduation or lower, high school graduation or technical school completion, and college graduation or higher. Individuals who engaged in regular physical activity sufficient to induce sweating were categorized as nonsedentary. Hazardous occupational exposure includes working in professions, such as mining, paint manufacturing, painting, battery manufacturing, welding, smelting, alloying, wire cable manufacturing, plating, printing, gas station employment, and fluorescent lamp manufacturing.
In this study, the concentrations of PAH-related metabolites were determined by summing the urinary levels of 1-OHP, 2-NAP, 1-OHPHE, and 2-OHFLU. These concentrations were categorized into four stages, with values equal to or below the median serving as the reference group. We used the PAH metabolite levels of the general population as a benchmark and further divided the data into groups exceeding the median but less than the 75th percentile, exceeding the 75th percentile but less than the 90th percentile, and exceeding the 90th percentile. The PAH metabolite concentration data for the general population were based on the second period (2012–2014) of the Korean National Environmental Health Survey conducted by the National Institute of Environmental Research.
Additionally, we multiplied the PAH metabolite levels by the duration of residence in the current house and classified the data into four groups: <50th percentile, 50th–75th percentile, 75th–90th percentile, and >90th percentile. Unlike the PAH metabolite-level groups, the reference value was based on quartiles.
The statistical model considered the PAH metabolite concentration as the independent variable, whereas the diagnosis of respiratory diseases based on the survey results served as the dependent variable. Logistic regression was used to calculate the results for each year, and a pooled odds ratio was obtained using a fixed-effect meta-analysis. Statistical analysis was conducted using STATA version 15.0 (Stata Corp., College Station, TX, USA), and statistical significance was assessed at a 95% confidence level.
This study was approved by the Institutional Review Board of Ewha Womans University Mokdong Hospital (IRB File No. 2021-08-047). Owing to the retrospective nature of this study, the requirement for written informed consent was waived by the Institutional Review Board.
RESULTS
Table 1 presents an overview of the demographic characteristics of the study participants, categorized by their respective study years. The study included 1,189 participants, with an average age of 56.1 years. The male population accounted for 41.0% of the total population. Of these, 218 (18.3%) were current smokers. Furthermore, 44.6% of the respondents indicated that they engaged in regular physical exercise and 48.0% had a high school diploma or higher educational qualification. A subset of 99 (8.3% of the total sample) participants reported exposure to occupational hazards.
Examining the annual distribution of eligible individuals, there were 359, 259, 290, and 281 participants in 2012, 2013, 2014, and 2015, respectively. Notably, the year 2012 had the highest number of participants. The average age within each cohort was 55.0, 55.9, 56.3, and 57.6, respectively. The smoking prevalence varied by year, with rates of 27.0%, 16.2%, 12.8%, and 15.0%, respectively. Additionally, individuals exposed to hazardous occupational conditions accounted for 41, 14, 17, and 27 in the respective conditions, accounting for 11.4%, 5.4%, 5.9%, and 9.6%, respectively. The average duration of residence at the current address was 14.7 years for all participants, with specific averages of 15.2, 15.3, 10.1, and 18.3 years in 2012, 2013, 2014, and 2015, respectively. According to the distribution of participants by region, Haedo-dong has the largest number of participants with 178, followed by Heunghae-eup with 129 (Table 2).
Analysis of urinary PAH metabolites revealed significant variations in estimated geometric means (GM) between 2012 and 2015. The overall estimated GM for 1-OHP was 0.181 µg/g Cr (95% confidence interval [CI]: 0.168–0.195). The highest level was observed in 2012 (0.300 µg/g Cr; 95% CI: 0.275–0.327), while the lowest was in 2014 (0.108 µg/g Cr; 95% CI: 0.089–0.132). Levels in 2013 and 2015 were 0.164 µg/g Cr and 0.176 µg/g Cr, respectively. The differences across the years were statistically significant (p < 0.001). The estimated GM for 2-NAP was 3.624 µg/g Cr (95% CI: 3.330–3.944). The year 2012 again showed the highest level (6.328 µg/g Cr; 95% CI: 5.601–7.150). The lowest level was in 2013 (2.025 µg/g Cr; 95% CI: 1.575–2.604). The values in 2014 and 2015 were 3.138 and 3.527 µg/g Cr, respectively. These variations were statistically significant (p < 0.001). The estimated GM for 2-OHFLU was 0.246 µg/g Cr (95% CI: 0.226–0.269), peaking in 2012 (0.511 µg/g Cr; 95% CI: 0.448–0.582). The lowest level was in 2014 (0.092 µg/g Cr; 95% CI: 0.075–0.113), while 2013 and 2015 showed levels of 0.309 µg/g Cr and 0.218 µg/g Cr, respectively. These differences were statistically significant (p < 0.001). The overall GM for total PAH metabolites was 4.840 µg/g Cr (95% CI: 4.504–5.202), with the highest level in 2012 (8.041 µg/g Cr; 95% CI: 7.210–8.967). The lowest level was recorded in 2013 (3.532 µg/g Cr; 95% CI: 2.924–4.267). The years 2014 and 2015 had levels of 3.777 µg/g Cr and 4.371 µg/g Cr, respectively. The p-value for these overall differences was less than 0.001, indicating statistical significance (Table 3).
Analysis of the lifetime prevalence of respiratory diseases among the participants revealed varied patterns from 2012 to 2015. The overall prevalence of COPD was relatively low at 1.3%, with a noticeable peak in 2012 (2.5%) and a decline to 0.4% in 2015. Asthma presented a pronounced trend, with an overall prevalence of 3.2%, notably high in 2012 (6.1%) but reduced to 1.8% by 2015, with significant year-to-year differences (p = 0.002).
In contrast, the prevalence of acute bronchitis and pneumonia was consistently low throughout the study period. Acute bronchitis had an overall prevalence of 0.7%, peaking at 1.4% in 2012, and dropping to zero by 2015. The prevalence of pneumonia remained below 1% throughout the study period, with the highest prevalence of 1.1% in 2012 and the lowest of 0.3% and 0.4% in 2014 and 2015, respectively.
When all the respiratory diseases were considered collectively, the total prevalence was 5.0%. This aggregate figure was highest in 2012 at 9.2% and steadily decreased to 2.5% by 2015. The decline in the total number of respiratory diseases over the years was statistically significant (p < 0.001), as determined using the chi-square test (Table 4).
These findings highlight notable fluctuations in the prevalence of specific respiratory diseases over the study period, with asthma and the total prevalence showing significant changes over the years.
The prevalence of respiratory diseases by region reveals that Ocheon-eup had the highest rate at 21.1% followed by Haedo-dong at 10.1%. However, this should be interpreted with caution, as the number of participants from Ocheon-eup was limited to only 19 individuals (Table 2).
This meta-analysis explored the association between urinary PAH metabolite levels and respiratory disease diagnosis. Logistic regression models provided yearly odds ratios, which were then pooled using a fixed-effect meta-analysis owing to negligible heterogeneity (I-squared = 0.0% for all comparisons). According to the logistic regression analysis, there were no statistically significant results from 2012 to 2015 (Table 5). However, the pooled odds ratios revealed that while the middle quartiles (50th–75th percentile and 75th–90th percentile) did not exhibit a significant association with respiratory disease diagnosis, with odds ratios (ORs) of 1.02 (95% CI: 0.44–2.40) and 1.66 (95% CI: 0.59–4.68), respectively, there was a marked increase in risk for those in the highest quartile. Participants with metabolite levels above the 90th percentile showed a significantly elevated risk of respiratory diseases (OR: 2.34; 95% CI: 1.06–5.19) compared to those at or below the median level (Fig. 2).
The logistic regression analysis from 2012 to 2015 did not yield statistically significant results when examining the relationship between PAH metabolite levels, multiplied by residence duration, and respiratory disease prevalence. However, in a meta-analysis, significant findings emerged despite controlling for age, sex, smoking habits, educational level, exercise, and hazardous occupational exposure (Table 6). The data indicated that PAH metabolite levels in the 50th–75th percentile range were not significantly associated with respiratory disease prevalence, with a pooled OR of 1.69 (95% CI: 0.76–3.78). Similarly, metabolite levels in the 75th–90th percentile did not show a significant association (OR: 1.49; 95% CI: 0.56–3.95). However, individuals with metabolite levels above the 90th percentile had a significantly high prevalence of respiratory diseases (OR: 2.72; 95% CI: 1.04–7.14). With no observed heterogeneity (I-squared = 0.0%), these results highlight a dose-response relationship, particularly at the highest exposure levels, indicating the health implications of long-term PAH exposure (Fig. 3).
DISCUSSION
Our findings indicate a significant correlation, particularly at higher exposure levels, which is consistent with existing literature that associates PAHs with adverse respiratory outcomes.1,24,25 The intricate relationship between PAH exposure and health outcomes has long been a topic of interest in environmental medicine. Our study, centered on the region surrounding the Pohang Industrial Complex, an area burdened with elevated PAH levels, provides notable insights into the potential health effects of PAH exposure.5
Within the Wuhan-Zuhai cohort study conducted in China, multiple PAH metabolite concentrations, as well as cumulative urinary PAH metabolite levels, demonstrated a correlation with decreased forced expiratory volume in 1 second (FEV1) and forced vital capacity (FVC) measurements.1 Research focusing on workers exposed to diesel engine exhaust emissions has documented a correlational decline in PAH metabolite levels and forced expiratory flow at 75% (FEF75%).24 In a study conducted in North India, kitchen workers exhibited elevated urinary PAH metabolite concentrations compared to the control cohort, even after adjusting for smoking behaviors. Furthermore, a pronounced decrease in lung function has been observed in these workers.25
Previous research has shown that PAHs are linked to decreased lung function, COPD, and asthma.26-28 Burstyn et al.26 revealed a correlation between mortality and obstructive pulmonary disease and assessed the cumulative and average exposure levels to PAHs and coal tar. A study conducted in Canada found that significant decreases in FEV1 and FVC were linked to interquartile changes in urinary PAH metabolites for eight specific PAHs: 2-hydroxynaphthalene; 1- and 2-hydroxyphenanthrene; 2-, 3-, and 9-hydroxyfluorene; and 3- and 4-hydroxyphenanthrene.27
The primary strength of this study lies in its location-specific analysis. Most studies have focused on occupational populations, such as roofers, coke oven workers, driving and transportation workers, construction workers, and mining.29-31 However, by focusing on populations proximal to industrial complexes renowned for considerable PAH emissions, our study supports the argument that regions typified by pronounced industrial activities, especially those linked to steel production, can serve as potential hotspots for the prevalence of respiratory diseases owing to PAH exposure. This geographical specificity offers a robust platform for advocating targeted prevention and mitigation strategies. The Pohang region, with its dense concentration of steel-production facilities and heavy vehicular traffic related to the transport of industrial goods, presents a unique environment for studying the impact of industrial emissions on human health. High levels of PAHs and other air pollutants emanating from these sources have long been a concern for the health of local residents. Our meta-analysis strengthens the argument that prolonged exposure to elevated PAHs, especially when coupled with long-term residence in industrial areas, significantly increases the risk of developing respiratory diseases.
Another notable aspect of our investigation was the incorporation of cumulative PAH exposure and factoring in duration of residence. This multidimensional approach, which merges short-term PAH measurements with residency duration, provides a more nuanced understanding of the temporal dimensions of PAH exposure. Statistically, our study differs from those of many of its contemporaries. Instead of a mere cross-sectional perspective, our research merged data across four years. This longitudinal dimension imparts temporal depth, affording a clearer and more extended view of the potential health outcomes associated with PAH exposure.
Nevertheless, although our study has numerous strengths, areas for potential improvement remain. A salient limitation pertains to our reliance on surveys to diagnose respiratory conditions. Diagnoses based on medical records offer a more accurate and logistically challenging picture of disease prevalence. Although practical, our approach may not capture the true extent of respiratory diseases among the participants. In the case of self-report questionnaire, there is a possibility that the subjects might confuse the exact diagnosis names. Therefore, the four respiratory diseases were grouped together and evaluated to assess the effect of the urinary PAH metabolites on respiratory diseases. In addition, our criteria for assessing PAH exposure may benefit from an expanded scope. Limiting our analysis to only four metabolites potentially excluded other significant PAHs. Future studies should seek a more inclusive analysis that incorporates a diverse range of PAH metabolites to provide a rich and comprehensive depiction of PAH exposure. Furthermore, although our emphasis on cumulative PAH exposure considering residency duration was innovative, it may not encapsulate the entirety of an individual’s exposure history. Residents may have had significant PAH exposure outside their current abode, which could not be captured in our study. A more exhaustive account of a participant’s life, capturing all potential sources of PAH exposure, albeit challenging, is ideal for future research. Lastly, 48% of the participants’ addresses were not clearly stated, preventing the assessment of prevalence rates and regional distribution of participants in Pohang in this study.
Public health strategies should be directed towards reducing PAH exposure, particularly in industrial regions, such as Pohang. This could involve enhancing air filtration in homes, improving industrial emission standards, and promoting policies to reduce the overall production of PAHs. Additionally, our study reinforces the importance of incorporating environmental health considerations into future urban development to mitigate the potential health risks associated with industrial activities. Following this study, it is necessary to expand the step-by-step research linked to the process of risk assessment based on environmental exposure, considering various exposure pathways and levels of PAH.
Our study highlights the significant health risks associated with urinary PAH metabolites in industrial areas, such as the Pohang Industrial Complex. We observed a strong correlation between high urinary PAH metabolites levels and adverse respiratory outcomes, including asthma and COPD. Our meta-analysis confirmed these findings, even after adjusting for various confounding factors.
The geographic focus of our research underscores the heightened vulnerability of residents near industrial complexes, emphasizing the need for targeted public health interventions. Strategies such as improved air filtration, stricter emission standards, and environmentally conscious urban planning are essential.
CONCLUSIONS
Our study highlights the significant health risks associated with urinary PAH metabolites in industrial areas, such as the Pohang Industrial Complex. We observed a strong correlation between high urinary PAH metabolites levels and adverse respiratory outcomes, including asthma and COPD. Our meta-analysis confirmed these findings, even after adjusting for various confounding factors.
The geographic focus of our research underscores the heightened vulnerability of residents near industrial complexes, emphasizing the need for targeted public health interventions. Strategies such as improved air filtration, stricter emission standards, and environmentally conscious urban planning are essential.
Abbreviations
CI
confidence interval
COPD
chronic obstructive pulmonary disease
FEF75%
forced expiratory flow at 75%
FEV1
forced expiratory volume in 1 second
FVC
forced vital capacity
GC-MS
gas chromatography–mass spectrometry
GM
geometric means
OR
odds ratio
PAH
polycyclic aromatic hydrocarbon
1-OHP
1-hydroxypyrene
1-OHPHE
1-hydroxyphenanthrene
2-OHFLU
2-hydroxyfluorene
2-NAP
2-naphthol
-
Competing interests
The authors declare that they have no competing interest.
-
Author contributions
Conceptualization: Kim M, Lim S, Kim S, Ha JC, Kim H, Chung I. Data curation: Kim M, Lim S, Kim S, Chung I. Investigation: Kim M, Lim S, Kim S, Chung I. Supervision: Chung I. Writing - original draft: Kim M, Chung I. Writing - review & editing: Kim M, Kim H, Chung I.
-
Acknowledgments
This study used data from the Second Korean National Environmental Health Survey (2012–2014) conducted by the National Institute of Environmental Research and Monitoring of Exposure to Environmental Pollutants and Health Effects of Inhabitants in Industrial Complexes in Pohang. The Authors gratefully acknowledge efforts made in this regard.
NOTES

Fig. 2.

Odds ratio of prevalence of respiratory diseases (chronic obstructive pulmonary disease, asthma, acute bronchitis, pneumonia) according to urinary polycyclic aromatic hydrocarbon metabolite level. Horizontal lines represent 95% confidence intervals (CIs). (A) 50-75th percentile vs. ≤50th percentile. (B) 75–90th percentile vs. ≤50th percentile. (C) >90th percentile vs. ≤50th percentile. Adjusted for age, sex, smoking habits, educational attainment, physical activity, and hazardous occupational exposure
Fig. 3.
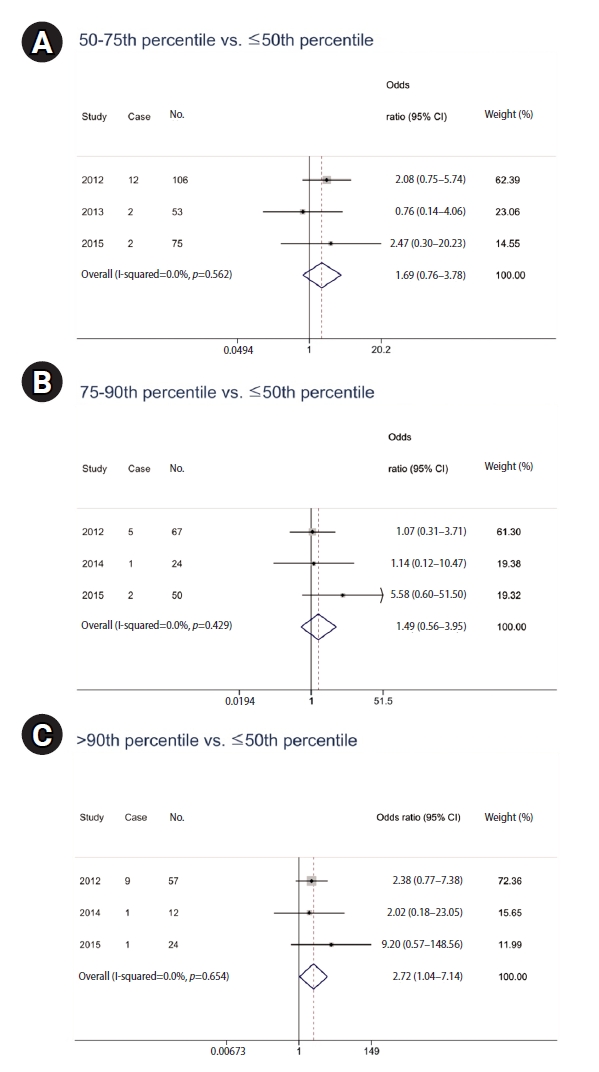
Odds ratio of prevalence for respiratory diseases (chronic obstructive pulmonary disease, asthma, acute bronchitis, pneumonia) according to urinary polycyclic aromatic hydrocarbon metabolite level multiplied by residence duration. Horizontal lines represent 95% confidence intervals (CIs). (A) 50–75th percentile vs. ≤50th percentile. (B) 75–90th percentile vs. ≤50th percentile. (C) >90th percentile vs. ≤50th percentile. Adjusted for age, sex, smoking habits, educational attainment, physical activity, and hazardous occupational exposure.
Table 1.
General characteristics among years
Table 2.
Participants’ regional distribution and prevalence of respiratory diseases by region
Table 3.
Estimated geometric means of urinary polycyclic aromatic hydrocarbon metabolites
Table 4.
Lifetime prevalence of respiratory disease
Table 5.
Analysis of the correlation between urinary PAH metabolite level and lifetime prevalence of diagnosing respiratory diseases by year
| Year |
50-75th percentile |
75–90th percentile |
>90th percentile |
||||||
|---|---|---|---|---|---|---|---|---|---|
| No.a | ORb | 95% CI | No.a | ORb | 95% CI | No.a | ORb | 95% CI | |
| 2012 | 117 | 1.0 | 0.3–3.0 | 50 | 1.1 | 0.3–4.6 | 111 | 2.1 | 0.7–6.4 |
| 2013 | 37 | NA | NA | 28 | NA | NA | 53 | 1.9 | 0.4–8.6 |
| 2014 | 83 | 0.7 | 0.1–4.4 | 40 | 1.0 | 0.1–10.5 | 30 | 4.0 | 0.7–22.9 |
| 2015 | 74 | 1.8 | 0.2–12.6 | 44 | 5.9 | 0.7–49.3 | 33 | NA | NA |
Table 6.
Analysis of the correlation between the urinary PAH metabolite level multiplied by residence duration and lifetime prevalence of diagnosing respiratory diseases by year
| Year |
50-75th percentile |
75–90th percentile |
>90th percentile |
||||||
|---|---|---|---|---|---|---|---|---|---|
| No.a | ORb | 95% CI | No.a | ORb | 95% CI | No.a | ORb | 95% CI | |
| 2012 | 106 | 2.1 | 0.8–5.7 | 67 | 1.1 | 0.3–3.7 | 57 | 2.4 | 0.8–7.4 |
| 2013 | 53 | 0.8 | 0.1–4.1 | 35 | NA | NA | 25 | NA | NA |
| 2014 | 60 | NA | NA | 24 | 1.1 | 0.1–10.5 | 12 | 2.0 | 0.2–23.1 |
| 2015 | 75 | 2.5 | 0.3–20.2 | 50 | 5.6 | 0.6–51.5 | 24 | 9.2 | 0.6–148.6 |
- 1. Zhou Y, Sun H, Xie J, Song Y, Liu Y, Huang X, et al. Urinary polycyclic aromatic hydrocarbon metabolites and altered lung function in Wuhan, China. Am J Respir Crit Care Med 2016;193(8):835–46.ArticlePubMedPDF
- 2. Menzie CA, Potocki BB, Santodonato J. Exposure to carcinogenic PAHs in the environment. Environ Sci Technol 1992;26(7):1278–84.Article
- 3. Dunbar JC, Lin CI, Vergucht I, Wong J, Duran JL. Estimating the contributions of mobile sources of PAH to urban air using real-time PAH monitoring. Sci Total Environ 2001;279(1-3):1–19.ArticlePubMed
- 4. Benner BA Jr, Gordon GE, Wise SA. Mobile sources of atmospheric polycyclic aromatic hydrocarbons: a roadway tunnel study. Environ Sci Technol 1989;23(10):1269–78.Article
- 5. Kang TS, Kim GB, Yang KC, Cho YS, Baek SO, Seo YK, et al. Polycyclic aromatic hydrocarbons and human exposure in the atmosphere around Pohang Industrial Complex. In: Proceedings of the Korea Society of Environmental Toocicology Conference. Seoul, Korea: Korean Society of Environmental Health and Toxicology; 2013, 307-8.
- 6. Hussain K, Rahman M, Prakash A, Hoque RR. Street dust bound PAHs, carbon and heavy metals in Guwahati City: seasonality, toxicity and sources. Sustain Cities Soc 2015;19:17–25.Article
- 7. Bostrom CE, Gerde P, Hanberg A, Jernstrom B, Johansson C, Kyrklund T, et al. Cancer risk assessment, indicators, and guidelines for polycyclic aromatic hydrocarbons in the ambient air. Environ Health Perspect 2002;110 Suppl 3(Suppl 3):451–88.PubMed
- 8. Srogi K. Monitoring of environmental exposure to polycyclic aromatic hydrocarbons: a review. Environ Chem Lett 2007;5(4):169–95.ArticlePubMedPMCPDF
- 9. Sobus JR, Waidyanatha S, McClean MD, Herrick RF, Smith TJ, Garshick E, et al. Urinary naphthalene and phenanthrene as biomarkers of occupational exposure to polycyclic aromatic hydrocarbons. Occup Environ Med 2009;66(2):99–104.ArticlePubMedPMC
- 10. Rodriguez-Aguilar M, Diaz de Leon-Martinez L, Garcia-Luna S, Gomez-Gomez A, Gonzalez-Palomo AK, Perez-Vazquez FJ, et al. Respiratory health assessment and exposure to polycyclic aromatic hydrocarbons in Mexican indigenous population. Environ Sci Pollut Res Int 2019;26(25):25825–33.ArticlePubMedPDF
- 11. Choi EH, Cho JH, Lee TW, Ha NY, Ryu JY, Kim DH. The relationship between concentration of polycyclic aromatic hydrocarbons and oxidative stress: the 2nd National Basic Survey on Environmental Health (2012-2014). In: Proceedings of the Korean Society of Occupational and Environmental Medicine. Seoul, Korea: Korean Society of Occupational and Environmental Medicine; 2020, 104-5.
- 12. Lag M, Ovrevik J, Refsnes M, Holme JA. Potential role of polycyclic aromatic hydrocarbons in air pollution-induced non-malignant respiratory diseases. Respir Res 2020;21(1):299.PubMedPMC
- 13. Fu PP, Xia Q, Sun X, Yu H. Phototoxicity and environmental transformation of polycyclic aromatic hydrocarbons (PAHs)-light-induced reactive oxygen species, lipid peroxidation, and DNA damage. J Environ Sci Health C Environ Carcinog Ecotoxicol Rev 2012;30(1):1–41.ArticlePubMed
- 14. Gerde P, Muggenburg BA, Hoover MD, Henderson RF. Disposition of polycyclic aromatic hydrocarbons in the respiratory tract of the beagle dog. I. The alveolar region. Toxicol Appl Pharmacol 1993;121(2):313–8.PubMed
- 15. World Steel Association. Steel Statistical Yearbook 2019. Brussels, Belgium: World Steel Association; 2019.
- 16. Baek KM, Kim MJ, Kim JY, Seo YK, Baek SO. Characterization and health impact assessment of hazardous air pollutants in residential areas near a large iron-steel industrial complex in Korea. Atmos Pollut Res 2020;11(10):1754–66.Article
- 17. Lim HS, An YS, Jung JH, Park BC, Lee K, Yun JH, et al. Monitoring of Exposure to Environmental Pollutants and Health Effects of Inhabitants in Industrial Complexes in Pohang Area. Incheon, Korea: National Institute of Environmental Research; 2012.
- 18. Lim HS, An YS, Jung JH, Park BC, Lee K, Yun JH, et al. Monitoring of Exposure to Environmental Pollutants and Health Effects of Inhabitants in Industrial Complexes in Pohang Area. Incheon, Korea: National Institute of Environmental Research; 2013.
- 19. Lim HS, Jung JH, Pi YG, Lee K, Yun JH, Yu SJ, et al. Monitoring of Exposure to Environmental Pollutants and Health Effects of Inhabitants in Industrial Complexes in Pohang Area. Incheon, Korea: National Institute of Environmental Research; 2014.
- 20. Lim HS, Jung JH, Pi YG, Lee K, Yu SJ, Park SJ, et al. Monitoring of Exposure to Environmental Pollutants and Health Effects of Inhabitants in Industrial Complexes in Pohang Area. Incheon, Korea: National Institute of Environmental Research; 2015
- 21. Franco SS, Nardocci AC, Gunther WM. PAH biomarkers for human health risk assessment: a review of the state-of-the-art. Cad Saude Publica 2008;24 Suppl 4:s569–80.ArticlePubMed
- 22. Yang M, Koga M, Katoh T, Kawamoto T. A study for the proper application of urinary naphthols, new biomarkers for airborne polycyclic aromatic hydrocarbons. Arch Environ Contam Toxicol 1999;36(1):99–108.ArticlePubMedPDF
- 23. Strickland P, Kang D. Urinary 1-hydroxypyrene and other PAH metabolites as biomarkers of exposure to environmental PAH in air particulate matter. Toxicol Lett 1999;108(2-3):191–9.ArticlePubMed
- 24. Zhang LP, Zhang X, Duan HW, Meng T, Niu Y, Huang CF, et al. Long-term exposure to diesel engine exhaust induced lung function decline in a cross sectional study. Ind Health 2017;55(1):13–26.ArticlePubMedPMC
- 25. Singh A, Chandrasekharan Nair K, Kamal R, Bihari V, Gupta MK, Mudiam MK, et al. Assessing hazardous risks of indoor airborne polycyclic aromatic hydrocarbons in the kitchen and its association with lung functions and urinary PAH metabolites in kitchen workers. Clin Chim Acta 2016;452:204–13.ArticlePubMed
- 26. Burstyn I, Boffetta P, Heederik D, Partanen T, Kromhout H, Svane O, et al. Mortality from obstructive lung diseases and exposure to polycyclic aromatic hydrocarbons among asphalt workers. Am J Epidemiol 2003;158(5):468–78.ArticlePubMed
- 27. Cakmak S, Hebbern C, Cakmak JD, Dales RE. The influence of polycyclic aromatic hydrocarbons on lung function in a representative sample of the Canadian population. Environ Pollut 2017;228:1–7.ArticlePubMed
- 28. Karimi P, Peters KO, Bidad K, Strickland PT. Polycyclic aromatic hydrocarbons and childhood asthma. Eur J Epidemiol 2015;30(2):91–101.ArticlePubMedPDF
- 29. Hong DH, Jung J, Jo JH, Kim DH, Ryu JY. Occupational exposure to polycyclic aromatic hydrocarbons in Korean adults: evaluation of urinary 1-hydroxypyrene, 2-naphthol, 1-hydroxyphenanthrene, and 2-hydroxyfluorene using Second Korean National Environmental Health Survey data. Ann Occup Environ Med 2023;35:e6.ArticlePubMedPMCPDF
- 30. Serdar B, Lee D, Dou Z. Biomarkers of exposure to polycyclic aromatic hydrocarbons (PAHs) and DNA damage: a cross-sectional pilot study among roofers in South Florida. BMJ Open 2012;2(4):e001318.ArticlePubMedPMC
- 31. Kuang D, Zhang W, Deng Q, Zhang X, Huang K, Guan L, et al. Dose-response relationships of polycyclic aromatic hydrocarbons exposure and oxidative damage to DNA and lipid in coke oven workers. Environ Sci Technol 2013;47(13):7446–56.ArticlePubMed
REFERENCES
Figure & Data
REFERENCES
Citations
Citations to this article as recorded by 
 Cite
CiteAssociation between urinary polycyclic aromatic hydrocarbon metabolites and the prevalence of respiratory disease in residents living near Pohang Industrial Complex
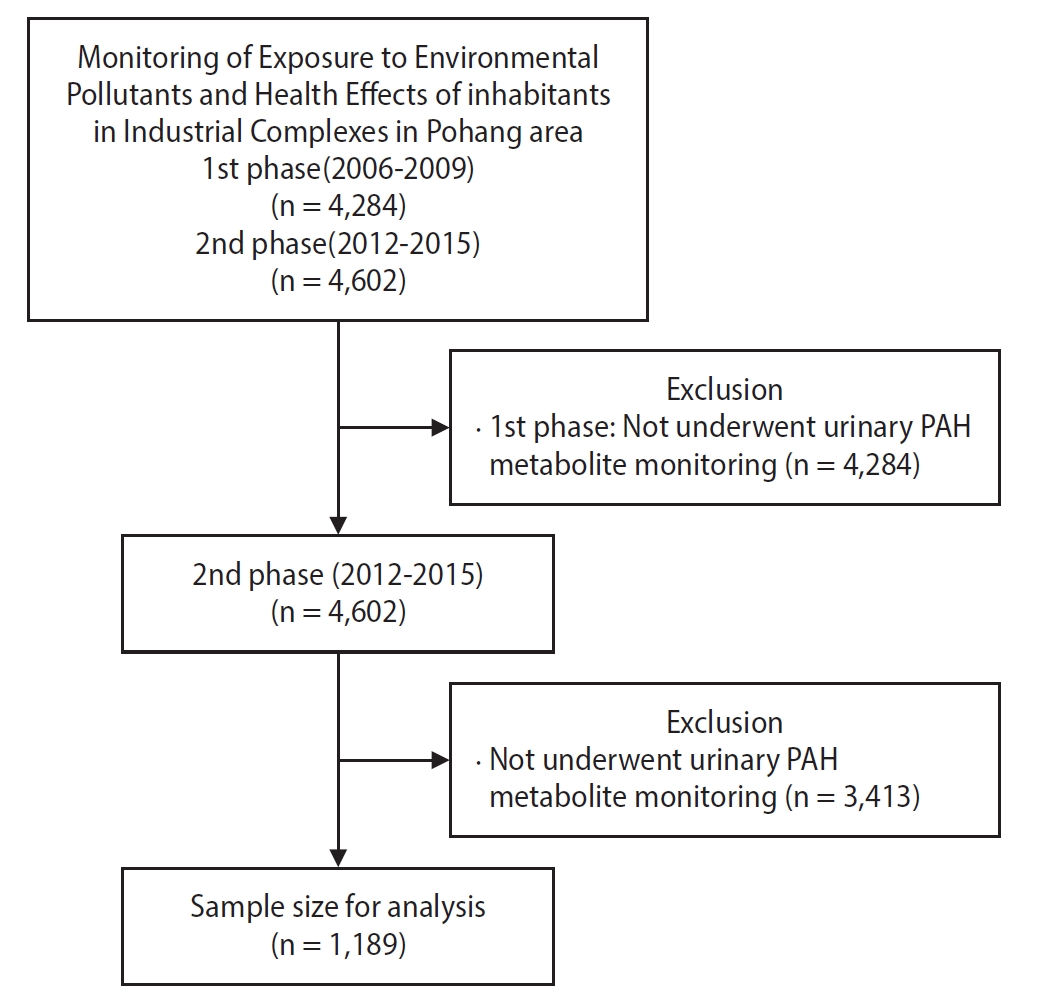
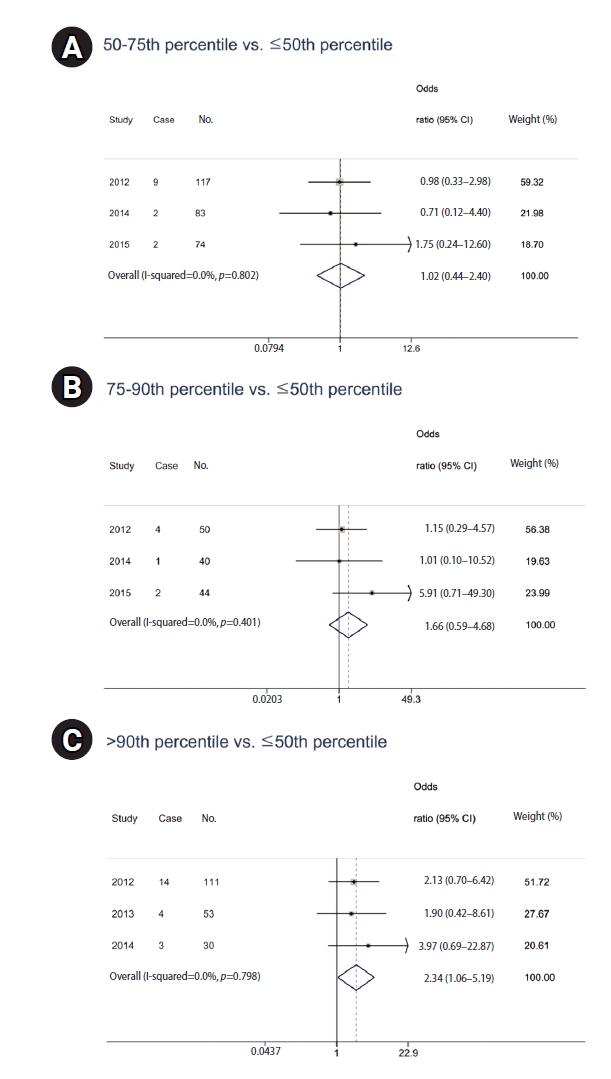

Fig. 1. Flow chart of study participants. PAH: polycyclic aromatic hydrocarbon.
Fig. 2. Odds ratio of prevalence of respiratory diseases (chronic obstructive pulmonary disease, asthma, acute bronchitis, pneumonia) according to urinary polycyclic aromatic hydrocarbon metabolite level. Horizontal lines represent 95% confidence intervals (CIs). (A) 50-75th percentile vs. ≤50th percentile. (B) 75–90th percentile vs. ≤50th percentile. (C) >90th percentile vs. ≤50th percentile. Adjusted for age, sex, smoking habits, educational attainment, physical activity, and hazardous occupational exposure
Fig. 3. Odds ratio of prevalence for respiratory diseases (chronic obstructive pulmonary disease, asthma, acute bronchitis, pneumonia) according to urinary polycyclic aromatic hydrocarbon metabolite level multiplied by residence duration. Horizontal lines represent 95% confidence intervals (CIs). (A) 50–75th percentile vs. ≤50th percentile. (B) 75–90th percentile vs. ≤50th percentile. (C) >90th percentile vs. ≤50th percentile. Adjusted for age, sex, smoking habits, educational attainment, physical activity, and hazardous occupational exposure.
Fig. 1.
Fig. 2.
Fig. 3.
Association between urinary polycyclic aromatic hydrocarbon metabolites and the prevalence of respiratory disease in residents living near Pohang Industrial Complex
| Characteristic | Year |
||||
|---|---|---|---|---|---|
| Total | 2012 | 2013 | 2014 | 2015 | |
| No. of participants | 1,189 | 359 | 259 | 290 | 281 |
| Age (years) | 56.1±13.5 | 55.0±14.3 | 55.9±14.5 | 56.3±11.8 | 57.6±12.9 |
| Male sex | 488 (41.0) | 176 (49.0) | 91 (35.1) | 97 (33.5) | 124 (44.1) |
| Smoking (current smoker) | 218 (18.3) | 97 (27.0) | 42 (16.2) | 37 (12.8) | 42 (15.0) |
| Exercise | 530 (44.6) | 170 (47.4) | 99 (38.2) | 147 (50.7) | 114 (40.6) |
| Education (≥high school) | 571 (48.0) | 152 (42.3) | 123 (47.5) | 155 (53.5) | 141 (50.2) |
| Hazardous occupational exposure | 99 (8.3) | 41 (11.4) | 14 (5.4) | 17 (5.9) | 27 (9.6) |
| Living duration (years) | 14.7±11.9 | 15.2±11.0 | 15.3±12.3 | 10.1±10.4 | 18.3±12.6 |
| Region | Participants | Respiratory diseases |
|---|---|---|
| Heunghae-eup | 129 (10.9) | 8 (6.2) |
| Songdo-dong | 104 (8.8) | 5 (4.8) |
| Haedo-dong | 178 (15.0) | 18 (10.1) |
| Jecheol-dong | 35 (2.9) | 2 (5.7) |
| Cheongnim-dong | 94 (7.9) | 3 (3.2) |
| Yeonil-eup | 41 (3.5) | 2 (4.9) |
| Ocheon-eup | 19 (1.6) | 4 (21.1) |
| Daesong-myeon | 18 (1.5) | 0 (0) |
| No address | 571 (48.0) | 17 (3.0) |
| Total | 1,189 (100) | 59 (5.0) |
| Metabolite (µg/g Cr) | Total | Year |
p-value | |||
|---|---|---|---|---|---|---|
| 2012 | 2013 | 2014 | 2015 | |||
| 1-OHP | 0.181 (0.168–0.195) | 0.300 (0.275–0.327) | 0.164 (0.151–0.178) | 0.108 (0.089–0.132) | 0.176 (0.148–0.208) | <0.001 |
| 2-NAP | 3.624 (3.330–3.944) | 6.328 (5.601–7.150) | 2.025 (1.575–2.604) | 3.138 (2.706–3.639) | 3.527 (3.087–4.030) | <0.001 |
| 1-OHPHE | 0.084 (0.078–0.090) | 0.171 (0.158–0.185) | 0.055 (0.047–0.064) | 0.054 (0.046–0.064) | 0.077 (0.066–0.090) | <0.001 |
| 2-OHFLU | 0.246 (0.226–0.269) | 0.511 (0.448–0.582) | 0.309 (0.273–0.350) | 0.092 (0.075–0.113) | 0.218 (0.186–0.256) | <0.001 |
| Total | 4.840 (4.504–5.202) | 8.041 (7.210–8.967) | 3.532 (2.924–4.267) | 3.777 (3.275–4.356) | 4.371 (3.858–4.953) | <0.001 |
| Respiratory disease | Total | Year |
|||
|---|---|---|---|---|---|
| 2012 | 2013 | 2014 | 2015 | ||
| COPD | 15 (1.3) | 9 (2.5) | 3 (1.2) | 2 (0.7) | 1 (0.4) |
| Asthma | 38 (3.2) | 22 (6.1) | 4 (1.5) | 7 (2.4) | 5 (1.8) |
| Acute bronchitis | 8 (0.7) | 5 (1.4) | 1 (0.4) | 2 (0.7) | 0 (0) |
| Pneumonia | 8 (0.7) | 4 (1.1) | 2 (0.8) | 1 (0.3) | 1 (0.4) |
| Total | 59 (5.0) | 33 (9.2) | 9 (3.5) | 10 (3.5) | 7 (2.5) |
| Year | 50-75th percentile |
75–90th percentile |
>90th percentile |
||||||
|---|---|---|---|---|---|---|---|---|---|
| No. |
OR |
95% CI | No. |
OR |
95% CI | No. |
OR |
95% CI | |
| 2012 | 117 | 1.0 | 0.3–3.0 | 50 | 1.1 | 0.3–4.6 | 111 | 2.1 | 0.7–6.4 |
| 2013 | 37 | NA | NA | 28 | NA | NA | 53 | 1.9 | 0.4–8.6 |
| 2014 | 83 | 0.7 | 0.1–4.4 | 40 | 1.0 | 0.1–10.5 | 30 | 4.0 | 0.7–22.9 |
| 2015 | 74 | 1.8 | 0.2–12.6 | 44 | 5.9 | 0.7–49.3 | 33 | NA | NA |
| Year | 50-75th percentile |
75–90th percentile |
>90th percentile |
||||||
|---|---|---|---|---|---|---|---|---|---|
| No. |
OR |
95% CI | No. |
OR |
95% CI | No. |
OR |
95% CI | |
| 2012 | 106 | 2.1 | 0.8–5.7 | 67 | 1.1 | 0.3–3.7 | 57 | 2.4 | 0.8–7.4 |
| 2013 | 53 | 0.8 | 0.1–4.1 | 35 | NA | NA | 25 | NA | NA |
| 2014 | 60 | NA | NA | 24 | 1.1 | 0.1–10.5 | 12 | 2.0 | 0.2–23.1 |
| 2015 | 75 | 2.5 | 0.3–20.2 | 50 | 5.6 | 0.6–51.5 | 24 | 9.2 | 0.6–148.6 |
Table 1. General characteristics among years
Values are presented as mean±standard deviation or number (%).
Table 2. Participants’ regional distribution and prevalence of respiratory diseases by region
Values are presented as number (%).
Table 3. Estimated geometric means of urinary polycyclic aromatic hydrocarbon metabolites
Values are presented as estimated geometric means (95% confidence interval). 1-OHP: 1-hydroxypyrene; 2-NAP: 2-naphthol; 1-OHPHE: 1-hydroxyphenanthrene; 2-OHFLU: 2-hydroxyfluorene.
Table 4. Lifetime prevalence of respiratory disease
Values are presented as number (%). COPD: chronic obstructive pulmonary disease.
Table 5. Analysis of the correlation between urinary PAH metabolite level and lifetime prevalence of diagnosing respiratory diseases by year
PAH: polycyclic aromatic hydrocarbon; OR: odds ratio; CI: confidence interval; NA: not available. Unweighted sample size; Adjusted for age, sex, smoking habits, educational attainment, physical activity, and hazardous occupational exposure.
Table 6. Analysis of the correlation between the urinary PAH metabolite level multiplied by residence duration and lifetime prevalence of diagnosing respiratory diseases by year
PAH: polycyclic aromatic hydrocarbon; OR: odds ratio; CI: confidence interval; NA: not available. Unweighted sample size; Adjusted for age, sex, smoking habits, educational attainment, physical activity, and hazardous occupational exposure.

