
Articles
- Page Path
- HOME > Ann Occup Environ Med > Volume 36; 2024 > Article
- Original Article Occupation classification model based on DistilKoBERT: using the 5th and 6th Korean Working Condition Surveys
-
Tae-Yeon Kim1,2,3
 , Seong-Uk Baek1,2,4, Myeong-Hun Lim1,2,3, Byungyoon Yun5, Domyung Paek6, Kyung Ehi Zoh6, Kanwoo Youn7, Yun Keun Lee7, Yangho Kim8, Jungwon Kim9, Eunsuk Choi10, Mo-Yeol Kang11, YoonHo Cho12, Kyung-Eun Lee12, Juho Sim5, Juyeon Oh3, Heejoo Park3, Jian Lee3, Jong-Uk Won1,2, Yu-Min Lee1,2, Jin-Ha Yoon2,5
 -
Annals of Occupational and Environmental Medicine 2024;36:e19.
DOI: https://doi.org/10.35371/aoem.2024.36.e19
Published online: August 6, 2024
1Department of Occupational and Environmental Medicine, Severance Hospital, Yonsei University College of Medicine, Seoul, Korea.
2The Institute for Occupational Health, Yonsei University College of Medicine, Seoul, Korea.
3Department of Public Health, Graduate School, Yonsei University, Seoul, Korea.
4Graduate School, Yonsei University College of Medicine, Seoul, Korea.
5Department of Preventive Medicine, Yonsei University College of Medicine, Seoul, Korea.
6Department of Environmental Health Sciences, Graduate School of Public Health, Seoul National University, Seoul, Korea.
7Wonjin Green Hospital Occupational Environmental Medicine, Seoul, Korea.
8Department of Occupational and Environmental Medicine, Ulsan University Hospital, University of Ulsan College of Medicine, Ulsan, Korea.
9Department of Occupational and Environmental Medicine, Kosin University College of Medicine, Busan, Korea.
10College of Nursing, Research Institute of Nursing Innovation, Kyungpook National University, Daegu, Korea.
11Department of Occupational and Environmental Medicine, Seoul St. Mary’s Hospital, College of Medicine, The Catholic University of Korea, Seoul, Korea.
12Occupational Safety and Health Research Institute, Korea Occupational Safety and Health Agency, Ulsan, Korea.
- Correspondence: Jin-Ha Yoon. Department of Preventive Medicine, Severance Hospital, Yonsei University Health System, 50-1 Yonsei-ro, Seodaemun-gu, Seoul 03722, Korea. flyinyou@gmail.com
• Received: February 13, 2024 • Revised: July 10, 2024 • Accepted: July 11, 2024
Copyright © 2024 Korean Society of Occupational & Environmental Medicine
This is an Open Access article distributed under the terms of the Creative Commons Attribution Non-Commercial License (https://creativecommons.org/licenses/by-nc/4.0/) which permits unrestricted non-commercial use, distribution, and reproduction in any medium, provided the original work is properly cited.
Abstract
-
Background Accurate occupation classification is essential in various fields, including policy development and epidemiological studies. This study aims to develop an occupation classification model based on DistilKoBERT.
-
Methods This study used data from the 5th and 6th Korean Working Conditions Surveys conducted in 2017 and 2020, respectively. A total of 99,665 survey participants, who were nationally representative of Korean workers, were included. We used natural language responses regarding their job responsibilities and occupational codes based on the Korean Standard Classification of Occupations (7th version, 3-digit codes). The dataset was randomly split into training and test datasets in a ratio of 7:3. The occupation classification model based on DistilKoBERT was fine-tuned using the training dataset, and the model was evaluated using the test dataset. The accuracy, precision, recall, and F1 score were calculated as evaluation metrics.
-
Results The final model, which classified 28,996 survey participants in the test dataset into 142 occupational codes, exhibited an accuracy of 84.44%. For the evaluation metrics, the precision, recall, and F1 score of the model, calculated by weighting based on the sample size, were 0.83, 0.84, and 0.83, respectively. The model demonstrated high precision in the classification of service and sales workers yet exhibited low precision in the classification of managers. In addition, it displayed high precision in classifying occupations prominently represented in the training dataset.
-
Conclusions This study developed an occupation classification system based on DistilKoBERT, which demonstrated reasonable performance. Despite further efforts to enhance the classification accuracy, this automated occupation classification model holds promise for advancing epidemiological studies in the fields of occupational safety and health.
BACKGROUND
Accurate job classification is crucial in various fields, such as labor health and safety, workforce management, policymaking, and research.1,2 Occupational safety regulations and health information are often organized based on workers’ job classifications. Inaccurate job classification can impede workers from receiving appropriate safety education or information related to their occupations, thereby increasing the risk of accidents or occupational illnesses.1,3 Additionally, precise job classification aids businesses and governments in effectively planning labor demand and making informed labor policies by understanding the distribution and types of specific occupations.3 In research, accurate job classification supports occupational epidemiological studies by confirming correlations between specific occupations and diseases, providing information for studies on occupation-related illnesses.2
The current method of job classification used in most epidemiological studies relies on investigators manually classifying tasks based on workers’ responses to questions such as “What tasks do you undertake in your workplace?” This manual classification approach has several limitations. First, different investigators may interpret the same job description differently, leading to inconsistent classifications influenced by subjectivity. Second, if individuals responsible for the classification lack comprehensive knowledge of all occupations, inaccuracies may arise owing to a lack of knowledge or understanding of specific job roles. Finally, manual job classification can be time-consuming, particularly when dealing with large datasets,4 and may not be applicable in small-sized studies, such as those conducted in hospital-based settings, where skilled investigators are scarce. These challenges necessitate the development of a new methodology to standardize and automate the classification of occupations.5,6,7 The automated job classification model will facilitate research utilizing big data, such as medical records or employment insurance records. Furthermore, by integrating technologies like speech-to-text AI, it will be possible to automatically classify occupations without specialized personnel, enabling additional functionalities such as providing tailored occupational health and safety information to workers.
The Bidirectional Encoder Representations from Transformers (BERT)8 is a state-of-the-art technique for natural language processing (NLP) that is actively utilized in various multi-classification tasks such as sentiment analysis and category classification.9,10 For instance, there is a task involving the sentiment analysis of tweets posted by individuals on a social networking service called Twitter, which is related to a specific topic, categorizing them into positive, negative, or neutral sentiments.10 The BERT processes a given sentence not only in the forward or backward direction but also bidirectionally, enabling it to understand the entire context of the sentence. DistilKoBERT,11 which has a structure similar to that of the BERT model, is a lightweight model based on the Korean pretrained model KoBERT,12 achieved through distillation techniques. It maintains accuracy compared to KoBERT, while enhancing classification efficiency.
The objective of this study is to automate job classification and validate the effectiveness of the model. Therefore, we aim to develop a job classification model using DistilKoBERT trained on job information data from the Korea Working Condition Survey (KWCS).
METHODS
The study sample was drawn from the 5th and 6th wave of the KWCS, a nationwide cross-sectional survey conducted by the Korea Occupational and Safety & Health Agency (KOSHA)13 The KWCS includes a nationally representative sample of workers in Korea and aims to investigate various factors in employment and working environments that influence occupational safety and health, collecting foundational data for injury prevention policies. The survey utilized multi-staged clustered probability sampling wherein enumeration districts serve as the primary sampling units and households serve as the secondary sampling units. Over 130 survey questions assessed a wide range of work conditions, covering topics such as working hours, labor intensity, work-life balance, exposure to risk factors, and subjective health status. Face-to-face interviews were conducted with each household and its members.
The flowchart of the study process is shown in Fig. 1. Initially, 100,743 workers from either the 5th or 6th KWCS were included in this study. To standardize the data, the 6th Korean Standard Classification of Occupation (KSCO) code of the 5th KWCS was converted into the corresponding codes of the 7th KSCO, which were utilized in the 6th KWCS.14 The data from the 5th KWCS with codes that could not be matched one-to-one were manually converted by reviewing natural language data and selecting the appropriate 7th KSCO code. During this process, 1,026 observations (1.02%) were removed when the natural language data did not provide sufficient information to assign a single code. Additionally, to achieve model convergence and ensure the minimum number of samples per class for model evaluation, job classes with 10 or fewer samples (n = 52, 0.05%) were excluded from the analysis. Consequently, 99,665 observations were included in the analysis.
Fig. 1

The flowchart of the study. K-JCM were fine-tuned model based on DistilKoBERT with dataset of KWCS.
K-JCM: KWCS-Job Classification Model; KWCS: Korea Working Condition Survey.
The KWCS requires workers to provide detailed explanations of their job duties, including descriptions of their workplaces, positions, and tasks, in order to facilitate occupational classification.13 Based on the natural language data, trained researchers at KOSHA assigned the closest occupational classification code from the KSCO to each worker. In the 5th KWCS, the 6th KSCO was used, and in the 6th KWCS, the 7th KSCO was used. Workers’ natural language responses about their occupations were encouraged to be as detailed as possible to enable accurate coding by the KOSHA researchers. The natural language data used in this study were subsequently reorganized by linking Korean responses representing the workplaces, positions, and tasks. Publicly available KWCS data do not include natural language responses to prevent re-identification. Instead, they are disclosed using KSCO codes (4-digit occupational codes). In this study, we used the KSCO codes (3-digit occupational codes) consisting of 156 job classes. Natural language responses from survey participants that were not included in the public dataset were acquired from KOSHA upon request from the corresponding authors. Table 1 lists examples of the datasets used to train the job classification model.
Table 1
Examples of the dataset
Data pre-processing
For standardization purposes, the codes of the 6th KSCO were converted into the corresponding codes of the 7th KSCO. Codes that did not have a one-to-one match were manually converted by researchers who reviewed the natural language data and selected the appropriate code of 7th KSCO. In the 7th KSCO, there were 156 subcategories (3-digit codes). However, only 152 subcategories were included in the KWCS data, excluding the following job classes (KSCO codes): Senior Corporate Officers (112), Other Sales and Customer Service Managers (159), Freight Train Related Workers (872), and Other Armed Forces (A09). Additionally, to expedite the convergence of the model and ensure a minimum number of samples per job class for model evaluation, the following 10 job classes (KSCO codes) with 10 or fewer samples were excluded from the analysis: Legislators, Senior Government Officials and Senior Officials of Public Organization (111), Marketing, Advertising and Public Relations Managers (122), Culture and Art Related Managers (134), Information and Communications Related Managers (135), Other Construction, Electricity and Production Related Managers (149), Environmental, Cleaning, and Protective Service Related Managers (153), Telecommunication and Broadcast Transmissions Equipment Technicians (225), Culinary Arts Related Professionals (287), Cultural Art Planners and Agents (288), and Ship Workers and Related Workers (876). This study includes 99,665 observations from 142 job classes. To generate training and test sets, the dataset was randomly split in a 70:30 ratio, with 70% allocated to the training dataset (n = 69,766) and 30% to the test dataset (n = 29,899).
Model architecture
In this study, we developed a job classification model using the open-source DistilKoBERT model available on Hugging Face. DistilKoBERT is a lighter version of KoBERT created by applying knowledge distillation techniques to reduce computational and memory requirements.11 It maintains advantages such as fast training speed and low resource demands, while exhibiting substantial performance similarities to the original KoBERT model. The DistilKoBERT model retains the same architecture as the original KoBERT model and is pretrained on approximately 10 GB of Korean data from sources such as Korean Wikipedia, Namuwiki, and news.
Fine-tuning DistilKoBERT
We developed the fine-tuned model based on DistilKoBERT with dataset of KWCS (K-JCM). We trained the pretrained DistilKoBERT model based on a fine-tuning approach using the Adam optimizer. To achieve the most accurate model, hyperparameters, including batch size, learning rate, and epochs, were adjusted to optimize the training process. The final hyperparameters for the optimized model configuration included a batch size of 64 and learning rate of 0.00002 with eight epochs.
After receiving natural language data from the test dataset as input, the final model calculated the probability that the description belongs to each class. It then adopted the class with the highest probability of outputting a model-predicted class. For a single natural language response, the sum of probabilities for all 142 classes added up to 100%. Accuracy, precision, recall, and F1 score were calculated as evaluation metrics.15 Accuracy means the level of agreement between the KSCO codes predicted by the model with highest probability when natural language responses from the test dataset were inputted and the KSCO codes manually classified by humans. Precision and recall represent the positive prediction rate and sensitivity of the model for binary classification in each class, respectively. The F1 score was calculated as the harmonic mean of precision and recall, which balances the trade-off relationship between these two metrics. As the classification performed in this study was multiclass, the precision, recall, and F1 score were individually derived for each class. The precision, recall, and F1 score for all the classes were calculated by weighting them based on the number of samples in each class. Additionally, the model can output the top several job classes with the highest probabilities according to the requirements. In this case, Top2-5 accuracy was calculated by checking whether the top 2, 3, 4, and 5 predicted job codes with the highest probabilities included the actual job class in KWCS.
Post-hoc analysis
Post-hoc analyses were conducted to determine the distribution of precision values for each occupational class. First, the correlation between the sample size included in the training dataset and the precision value for each occupational class was explored using a scatter plot. Second, we categorized job classes according to the major groups of KSCO (1-digit-codes) and investigated the distribution of precision for each job class within each group. For each major group, the minimum, maximum, median, and first and third quartiles of precision values were calculated.
To determine whether the low precision of certain classes is due to small sample sizes, we divided the classes into two groups: those with precision below 0.5 and those with precision above 0.5 in the K-JCM model, and examined the sample size distribution in the training dataset for these groups. Furthermore, we compared this distribution with the K-JCM-half model, which was trained with the training dataset’s proportion reduced from 70% to 35%.
We conducted additional analyses to improve the performance of K-JCM. First, we evaluated the performance of Model 2, which includes only job classes with a sample size of more than 100, while keeping other settings the same as K-JCM. Additionally, we evaluated the performance of Model 3, which includes KSCO description data in the training, and Model 4, which includes KSCO description data in the training and only job classes with a sample size of more than 100, while keeping other settings the same as K-JCM.
All analyses conducted using DistilKoBERT were performed using Python 3.10.12. Visualization was conducted using the R software (version 4.2.3; R Foundation for Statistical Computing, Vienna, Austria).
The study protocol was reviewed and approved by Institutional Review Board (IRB) of authors’ institution (IRB No.4-2023-1457).
RESULTS
Table 2 provides an example of our model’s input and output, displaying the model-predicted code with the highest probability, along with the top five codes and their corresponding probabilities.
Table 2
Example of the model's input and output showing TOP five codes and their probabilities
The main results of the metrics used to evaluate the proposed model are listed in Table 3. The final model demonstrated an accuracy of 84.44%, indicating that the model classified 84.44% of the test dataset in accordance with the manual classifications performed by humans. The precision, recall, and F1 score of the model, calculated by weighting based on the sample size, were 0.83, 0.84, and 0.83, respectively. The performance of the model was reasonable for practical application in job classification. The precision values of each job class are shown in Supplementary Table 1. The Top2-5 accuracy, which indicates whether the top 2, 3, 4, and 5 predicted job codes with the highest probabilities include the actual job class in KWCS, is presented in Supplementary Table 2.
Table 3
Evaluation metrics of the job classification model
| Evaluation metrics | ||||
|---|---|---|---|---|
| Accuracy | Precision | Recall | F1-score | |
| K-JCM | 84.44% | 0.83 | 0.84 | 0.83 |
Fig. 2 presents scatter plots with sample size and precision as the x- and y-axes, respectively, showing the correlation between the sample size in the training dataset for each job class and precision. The ‘precision’ indicates how accurately the model’s predicted job class matches the actual job class, essentially serving as a measure of positive predictive value. There was a statistically significant positive correlation between the log-transformed values of sample size and precision, with an R-squared value of 0.48. a level of p < 0.001. With one exception, all job classes with a precision value of 0 had a sample size of fewer than 100 in the training dataset.

To analyze the differences in precision values, indicating how well the model performs in classes, the KSCO codes were grouped into major groups (1-digit-code) according to the first string of the code. The distribution of precision for each job class, excluding major group A (Armed forces), is presented in Table 4. For the classes belonging to major group 1 (Managers), which showed the lowest average sample size among the classes, both the median precision and third quartile exhibited a value of 0. This indicates a very low probability of making correct predictions. By contrast, the model tended to demonstrate high precision in the classes belonging to major groups 4 (Service Workers) and 5 (Sales Workers). The distribution of sample sizes from two groups divided by the precision value of K-JCM and K-JCM-half, where the ratio of K-JCM to the training dataset was halved, based on a threshold of 0.5, are shown in Supplementary Fig. 1. Additionally, to improve the performance of K-JCM, we modified the sample size cutoff for the job classes included in the classification and/or included KSCO description data in the training. The performance of these models is presented in Supplementary Table 3.
Table 4
Distribution of precision for each job class, grouped by KSCO major groups (1-digit-code)
After reviewing the cases in which discrepancies between the codes predicted by K-JCM and those manually classified by researchers were observed, the following two types of errors were identified: data and model prediction errors. Data errors occurred when the code classified by humans was incorrect, and the code predicted by the model was correct. Examples of these cases are presented in Supplementary Table 4. However, model prediction errors occurred when the code predicted by the model was incorrect; examples of such cases are presented in Supplementary Table 5.
DISCUSSION
The main results demonstrated the reasonable performance of our model, with an overall accuracy of 84.44%. This indicates that the model successfully classified 84.44% of the test dataset according to the manual classifications performed by human researchers. This study holds significance for its potential to develop a model using NLP technology to reduce the time and economic costs associated with job classification, ensuring consistent and efficient results that can be applied across various fields, including occupational epidemiology.
Prior studies have aimed to develop an automated job-coding system. For instance, a rule-based approach utilizes predefined rules to perform specific tasks.16 These rules are established by domain experts or designed to encapsulate knowledge about a particular task. Bao et al. developed an automated coding algorithm that, when given job and industry titles as input, outputs the corresponding Canadian National Occupational Classification code, using a rule-based approach.17 However, utilizing a coding system with a rule-based method could pose challenges, as it may necessitate rewriting the rule entirely each time the occupational classification system undergoes revision to reflect evolving circumstances.16 In a recent study in South Korea, an attempt was made to develop an automated coding system based on KoBERT. Lim et. al. utilized data from the Population and Housing Census and trained the model for the classification of 496 job classes, using KSCO 4-digit codes.18 However, the accuracy of occupation code predictions on the test dataset was 51.06% that is lower than that observed in this study. This may be attributed to the higher number of classes, as they used the 4-digit codes of KSCO for classification. In contrast to our study, Lim et al. used data that listed business names, business activities, departments, positions within the business, and job responsibilities. However, by including business activities in the data, there is a possibility that information from businesses unrelated to an individual's actual occupation may have been input, potentially affecting the classification accuracy. In contrast, our study employed data that did not include business activities, focusing on individualized information related to the workplaces, positions, and tasks. This approach is likely to contribute to the development of a more effective job classification model.
In our post-hoc analysis, we examined the distribution of precision values to understand the effectiveness of classification across different occupations. As shown in Fig. 2, Occupations that were well-classified tended to have a larger sample size in the training dataset than those that were not well-classified. More specifically, there was a positive correlation between the sample size and precision values, suggesting that models perform better when trained on larger sample sizes. In Table 4, when comparing the precision distributions among the major groups according to the KSCO, major group 1 (Managers) exhibited notably lower precision values than the other groups. This observation can be plausibly ascribed to the class imbalance in the dataset used for this study, where the number of observations for different classes in the training dataset is not evenly distributed.19 In our study, the total and average sample sizes in major group 1 (Managers) in our training dataset were significantly lower than those in other groups. Addressing highly class-imbalanced data introduces an extra layer of complexity, given that predictive models commonly manifest a bias towards the prevalent class. In extreme scenarios, it is possible for the models to neglect the minority class entirely. Therefore, additional efforts are required to improve the accuracy of job classes for major group 1 (Managers).
By examining the distribution of sample sizes according to precision groups in K-JCM and K-JCM-half, we could estimate the necessary training dataset sample size cutoff for the model to function appropriately. As shown in Supplementary Fig. 1, in K-JCM and K-JCM-half, the Q3 values of the training dataset sample sizes for groups with precision > 0.5 were 114 and 76.5, respectively. Based on this, we inferred that for the model to classify jobs effectively, the training dataset sample size for each job class should be at least 114 (or at least 76.5). Therefore, in major group 1 (Managers), the influence of sample size seems to have significantly affected the lower precision. For in major group 8 (Plant and Machine Operators and Assemblers), stratified analysis revealed that precision values were 0 only for were observed only in job classes with sample less than 100, suggesting that low precision observed in major group 8 may be influenced by small sample sizes. However, even for classes with sample sizes exceeding 100, lower precision values were observed compared to other major groups, indicating potential issues in the model's training logic.
There were several methods identified through further analysis to enhance the performance of the job classification model. Firstly, adjusting the cutoff for sample size to include only job classes with sufficient samples in training. Another approach involves incorporating the KSCO classification manual into the training data. As shown in Supplementary Table 3, these methods led to overall improvements in the evaluation metrics of the model.
Despite showing an accuracy of 84.44% with predictions failing for approximately 15% of the data, several measures must be considered for the practical application of our model. As shown in Table 2, our model displays the top five codes in descending order of probability, accompanied by their respective probability values. The top5 accuracy, which represents the agreement between the five predicted job codes by K-JCM with the highest probability and the actual job code, reached 96.36%, as shown in Supplementary Table 2. By utilizing these capabilities, a viable approach involves using the model-predicted code with the highest probability when it exceeds a specified probability threshold (e.g., 80%). Conversely, in cases where it fell below the threshold, an alternative method entailed manual selection from the top five codes. By transforming more than 100 multiple-choice questions into sets of five options each, this practical adjustment can facilitate the assignment of the appropriate code more easily. Additionally, considering the overall low precision in major group 1 (Managers) in the post-hoc analysis, enhancing the occupational classification system through a partially applied rule-based approach may be beneficial. For example, workers holding managerial positions typically know whether they are managers or not. Therefore, by restricting code assignment to major group 1 (Managers) only when the response indicates a managerial role, precision within major group 1 can be improved. This approach can potentially contribute to the advancement of job classification systems.
Our study serves as a preliminary analysis for the classification of workers’ occupations. From a policy perspective, facilitating easy classification of workers’ occupations can aid in developing insights into the relationships between the demographic and sociological factors of workers and occupational classifications.20 This, in turn, can contribute to the development of policies. The classification of occupational codes also plays an important role in conducting epidemiological research.1,21,22 Automating the classification of occupations based on natural language data collected from small-scale epidemiological studies where trained researchers are not available or from large-scale epidemiological studies requiring significant time and cost can help identify associations between specific occupations and the incidence, prevalence, or mortality of diseases.23 Moreover, matching occupational codes with job exposure matrices can enable a more straightforward understanding of the health impacts of specific occupational exposures.24,25 However, for the practical utilization of these applications, improvements in the limitations of the model would be a necessary prerequisite.
This study had several limitations. First, 14 job classes were excluded from the classification task because of their absence from the KWCS or insufficient sample size, making it impractical to construct suitable training and test datasets. To apply this model to real-world scenarios, it is essential to include all occupations in the classification task. Second, the final model revealed occupations with low precision values, indicating a low classification accuracy. Given the tendency of smaller sample-sized occupations in the training dataset to exhibit lower precision values, future improvements to the model may involve incorporating natural language information from the 7th KWCS conducted in 2023, or adding supplementary materials on occupational codes as part of data augmentation to secure more extensive training data. Third, despite efforts by researchers to carefully review and select the best codes during the conversion process from the 6th and 7th KSCO codes using natural language data, the potential for misclassification remains a limitation. Additionally, as shown in Supplementary Table 4, there were instances in which the model predicted more accurate codes than the actual classified KSCO codes. This can pose challenges during the fine-tuning process for the development of a more accurate model. Lastly, it should be noted that our study did not involve training models based on BERT models other than DistilKoBERT. Further study is needed to train models based on different BERT models and compare the results to develop the best possible model.
The strength of this study lies in its pioneering efforts to create an automatic classification system using natural language data on the work activities of Korean workers with the aim of representing a sample that is representative of Korean workers. Additionally, the provision of insights into the model’s future development and practical application directions through post-hoc analysis adds value to the research.
CONCLUSIONS
This paper proposes an automated job classification method that utilizes the DistilKoBERT model trained on natural language data from the 5th and 6th KWCS. With an accuracy of 84.44%, the model streamlined and standardized the classification process, offering greater efficiency than manual methods. This automated system holds promise for facilitating policy insights and advancing occupational epidemiological studies with the potential for further enhancements to meet practical utilization standards. For future studies, it is necessary to conduct follow-up research by increasing the sample size and developing a classification model that includes all job classes.
Acknowledgements
The authors express their gratitude to KOSHA for providing the raw data on the KWCS and survey participants. The contents of this paper are the sole responsibility of the authors and do not necessarily reflect the official views of KOSHA.
Abbreviations
BERT
Bidirectional Encoder Representations from Transformers
IRB
Institutional Review Board
KOSHA
Korea Occupational and Safety & Health Agency
KSCO
Korean Standard Classification of Occupation
KWCS
Korea Working Condition Survey
KWCS
Korea Working Condition Survey
NLP
natural language processing
-
Funding: This study was supported by the funding from the Research of Occupational/Environmental Cancer Surveillance System (2310730-2) and Cancer Survivors Healthcare Research Project (HA23C049900) in the National Cancer Center.
-
Competing interests: The authors declare that they have no competing interests.
-
Authors contributions:
Conceptualization: Kim TY, Paek DM, Zoh KE, Youn KW, Lee YK, Kim YH, Kim JW, Choi ES, Kang MY, Yoon JH.
Data curation: Kim TY, Cho YH, Lee KE, Yoon JH.
Formal analysis: Kim TY, Yun BY, Sim JH, Oh JY, Park HJ, Lee JA, Yoon JH.
Investigation: Kim TY, Baek SU.
Methodology: Kim TY, Baek SU, Yoon JH.
Validation: Won JU, Yoon JH, Lee YM, Baek SU, Lim MH.
Visualization: Kim TY, Baek SU.
Writing - original draft: Kim TY.
Writing - review & editing: Won JU, Yoon JH, Lee YM, Baek SU, Lim MH, Yun BY, Paek DM, Zoh KE, Youn KW, Lee YK, Kim YH, Kim JW, Choi ES, Kang MY, Cho YH, Lee KE, Sim JH, Oh JY, Park HJ, Lee JA.
NOTES
SUPPLEMENTARY MATERIALS
Supplementary Table 1
Precision value of K-JCM (Korea Working Condition Survey-Job Classification Model) for all KSCO codes
Supplementary Table 2
Top1-5 accuracy of K-JCM meaning the agreement between the 1, 2, 3, 4, and 5 predicted job codes by the model with the highest probability and the actual job code
Supplementary Table 3
Evaluation metrics of the additional trained job classification models to enhance model performance
Supplementary Fig. 1
The distribution of sample sizes in training dataset, divided into two groups using a precision cut-off of 0.5, in K-JCM and K-JCM-half.
- 1. Eyles E, Manley D, Jones K. Occupied with classification: Which occupational classification scheme better predicts health outcomes? Soc Sci Med 2019;227:56–62. 30268347.ArticlePubMed
- 2. Choi SB, Yoon JH, Lee W. The Modified International Standard Classification of Occupations defined by the clustering of occupational characteristics in the Korean Working Conditions Survey. Ind Health 2020;58(2):132–141. 31527354.ArticlePubMed
- 3. Krasna H, Venkataraman M, Robins M, Patino I, Leider JP. Standard occupational classification codes: gaps in federal data on the public health workforce. Am J Public Health 2024;114(1):48–56. 38091570.ArticlePubMed
- 4. Burstyn I, Slutsky A, Lee DG, Singer AB, An Y, Michael YL. Beyond crosswalks: reliability of exposure assessment following automated coding of free-text job descriptions for occupational epidemiology. Ann Occup Hyg 2014;58(4):482–492. 24504175.PubMed
- 5. Langezaal MA, van den Broek EL, Peters S, Goldberg M, Rey G, Friesen MC, et al. Artificial intelligence exceeds humans in epidemiological job coding. Commun Med (Lond) 2023;3(1):160. 37925519.ArticlePubMedPMCPDF
- 6. Wan W, Ge CB, Friesen MC, Locke SJ, Russ DE, Burstyn I, et al. Automated coding of job descriptions from a general population study: overview of existing tools, their application and comparison. Ann Work Expo Health 2023;67(5):663–672. 36734402.ArticlePubMedPMCPDF
- 7. Russ DE, Ho KY, Colt JS, Armenti KR, Baris D, Chow WH, et al. Computer-based coding of free-text job descriptions to efficiently identify occupations in epidemiological studies. Occup Environ Med 2016;73(6):417–424. 27102331.ArticlePubMed
- 8. Devlin J, Chang MW, Lee K, Toutanova K. Bert: pre-training of deep bidirectional transformers for language understanding. Proceedings of the 2019 Conference of the North American Chapter of the Association for Computational Linguistics: Human Language Technologies, Volume 1 (Long and Short Papers). Minneapolis, MN, USA: Association for Computational Linguistics; 2019.
- 9. Benítez-Andrades JA, Alija-Pérez JM, Vidal ME, Pastor-Vargas R, García-Ordás MT. Traditional machine learning models and Bidirectional Encoder Representations from Transformer (BERT)-based automatic classification of tweets about eating disorders: algorithm development and validation study. JMIR Med Inform 2022;10(2):e34492. 35200156.ArticlePubMedPMC
- 10. Eom G, Yun S, Byeon H. Predicting the sentiment of South Korean Twitter users toward vaccination after the emergence of COVID-19 Omicron variant using deep learning-based natural language processing. Front Med (Lausanne) 2022;9:948917. 36186808.ArticlePubMedPMC
- 11. Park J. DistilKoBERT: Distillation of KoBERT. Updated 2021]. Accessed January 5, 2024]. https://github.com/monologg/DistilKoBERT .
- 12. SKT-Brain. Korean BERT Pre-Trained Cased (KoBERT). Updated 2022]. Accessed January 5, 2024]. https://github.com/SKTBrain/KoBERT .
- 13. Cho Y. Data resource profile: the Korean Working Conditions Survey (KWCS). Ann Occup Environ Med 2023;35(1):e49. 38148917.ArticlePubMedPMCPDF
- 14. Statistics Korea. Korean Standard Classification of Occupations. Updated 2024]. Accessed January 5, 2024]. http://kssc.kostat.go.kr/ksscNew_web/kssc/main/main.do?gubun=1# .
- 15. Grandini M, Bagli E, Visani G. Metrics for multi-class classification: an overview. arXiv August 13, 2020.
- 16. Uzuner O, Zhang X, Sibanda T. Machine learning and rule-based approaches to assertion classification. J Am Med Inform Assoc 2009;16(1):109–115. 18952931.ArticlePubMedPMC
- 17. Bao H, Baker CJ, Adisesh A. Occupation coding of job titles: iterative development of an automated coding algorithm for the Canadian National Occupation Classification (ACA-NOC). JMIR Form Res 2020;4(8):e16422. 32755893.ArticlePubMedPMC
- 18. Lim J, Moon H, Lee C, Woo C, Lim H. An automated industry and occupation coding system using deep learning. J Korea Converg Soc 2021;12(4):23–30.
- 19. Johnson JM, Khoshgoftaar TM. Survey on deep learning with class imbalance. J Big Data 2019;6(1):27.ArticlePDF
- 20. Watson AL. Implementing the 2010 standard occupational classification in the occupational employment statistics program. Mon Labor Rev 2013;136:36.
- 21. Deyaert J, Harms T, Weenas D, Gershuny J, Glorieux I. Attaching metabolic expenditures to standard occupational classification systems: perspectives from time-use research. BMC Public Health 2017;17(1):620. 28673271.ArticlePubMedPMCPDF
- 22. Davis J, Peek-Asa C, Dale AM, Zhang L, Casteel C, Hamann C, et al. Determining occupation for National Violent Death Reporting System records: An evaluation of autocoding programs. Am J Ind Med 2021;64(12):1018–1027. 34490655.ArticlePubMedPMCPDF
- 23. Buckner-Petty S, Dale AM, Evanoff BA. Efficiency of autocoding programs for converting job descriptors into standard occupational classification (SOC) codes. Am J Ind Med 2019;62(1):59–68. 30520070.ArticlePubMedPDF
- 24. Descatha A, Fadel M, Sembajwe G, Peters S, Evanoff BA. Job-Exposure matrix: a useful tool for incorporating workplace exposure data into population health research and practice. Front Epidemiol 2022;2:857316. 38455292.ArticlePubMedPMC
- 25. Park JH, Choi S, Koh DH, Lim DS, Park D, Kim HC, et al. a pilot establishment of the job-exposure matrix of lead using the standard process code of nationwide exposure databases in Korea. Saf Health Work 2022;13(4):493–499. 36579012.ArticlePubMedPMC
REFERENCES
REFERENCES
Figure & Data
REFERENCES
Citations
Citations to this article as recorded by 
- New Trends in the Use of Artificial Intelligence and Natural Language Processing for Occupational Risks Prevention
Natalia Orviz-Martínez, Efrén Pérez-Santín, José Ignacio López-Sánchez
Safety.2026; 12(1): 7. CrossRef
 Cite
CiteOccupation classification model based on DistilKoBERT: using the 5th and 6th Korean Working Condition Surveys
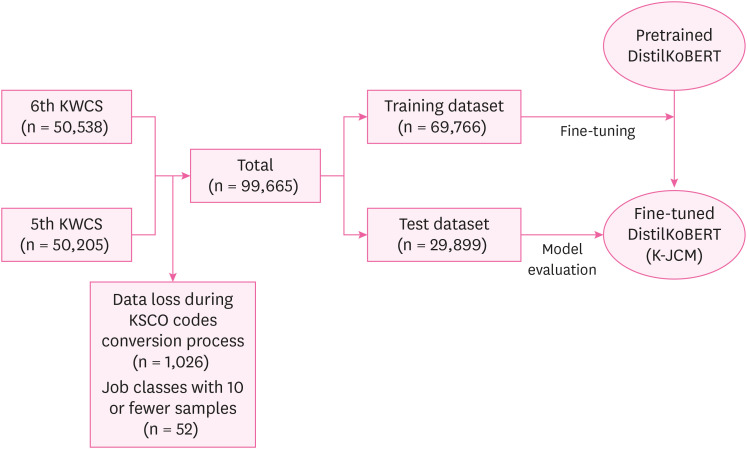
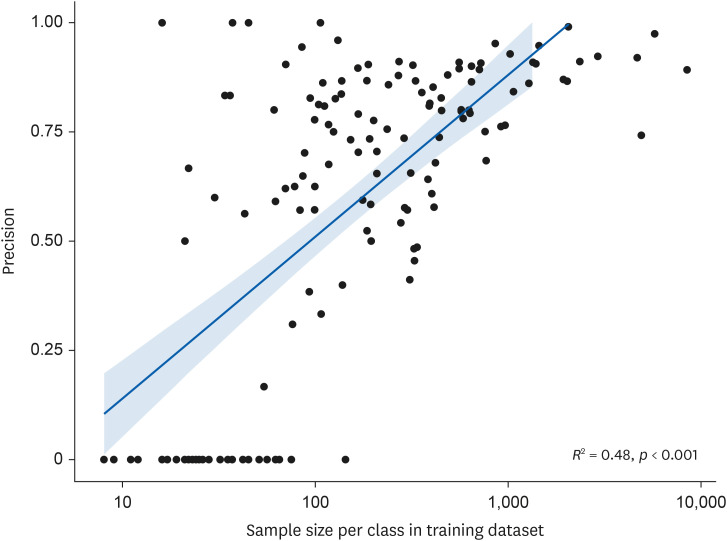
Fig. 1 The flowchart of the study. K-JCM were fine-tuned model based on DistilKoBERT with dataset of KWCS.K-JCM: KWCS-Job Classification Model; KWCS: Korea Working Condition Survey.
Fig. 2 Scatter plot of sample size per class in training dataset and precision value.
Fig. 1
Fig. 2
Occupation classification model based on DistilKoBERT: using the 5th and 6th Korean Working Condition Surveys
| Natural language response – English translation (Korean natural language response) | 3-digit KSCO code | Job title (Korean translation) |
|---|---|---|
| Producing and designing print materials at the ○○ Culture Company office | 285 | Designers |
| (○○문화사 사무실(에서) 인쇄물 제조, 인쇄물 디자인) | (디자이너) | |
| Managing and consulting customers' savings, fixed deposits, and other deposits in the △△ Bank's deposit team | 320 | Finance Clerks |
| (△△은행 예금팀(에서) 고객들의 예금적금예탁 관리 및 상담) | (금융 사무 종사자) | |
| Raising yellowfin tuna in a tuna farming facility | 630 | Fishery Related Workers |
| (참치양식장(에서) 어부(로) 참다랑어 키우는 일) | (어업 관련 종사자) | |
| Transporting and attaching various equipment at construction sites | 910 | Construction and Mining Laborers |
| (건축현장(에서) 여러가지 장비를 가지고 들어 나르고 붙임) | (건설 및 광업 단순 종사자) |
| Input-English translation (Korean natural language response) | Operating machinery as a machine operator in the operations department of the @@ nuclear power plant (@@원자력발전소 운전부(에서) 기계조작원(으로) 기계조작) | |||
|---|---|---|---|---|
| Order (in descending order of probability value) | 3-digit KSCO code | Job title (Korean translation) | Probability value | |
| Output | 1 (Model-predicted code) | 861 | Power Generation and Distribution Equipment Operators | 45.62% |
| (발전 및 배전장치 조작원) | ||||
| 2 | 874 | Freight-handling Equipment Operators | 18.48% | |
| (물품 이동 장비 조작원) | ||||
| 3 | 851 | Metal Work Machinery Operators | 15.21% | |
| (금속 공작 기계 조작원) | ||||
| 4 | 235 | Mechanical and Robot Engineers and Technicians | 6.60% | |
| (기계·로봇공학 기술자 및 시험원) | ||||
| 5 | 875 | Construction and Mining Machines Operators | 5.96% | |
| (건설 및 채굴기계 운전원) | ||||
| ··· | ··· | ··· | ··· | |
| Evaluation metrics | ||||
|---|---|---|---|---|
| Accuracy | Precision | Recall | F1-score | |
| K-JCM | 84.44% | 0.83 | 0.84 | 0.83 |
| Major group | No. of classes (A) | Sample size in training dataset (B) | Average sample size per class (B/A) | Distribution of precision for each class | |
|---|---|---|---|---|---|
| Min–Max | Median (Q1–Q3) | ||||
| 1. Managers | 8 | 313 | 39 | 0.00–0.83 | 0.00 (0.00–0.00) |
| 2. Professionals and related workers | 41 | 10,998 | 268 | 0.00–1.00 | 0.78 (0.57–0.89) |
| 3. Clerks | 9 | 10,150 | 1,128 | 0.50–0.91 | 0.66 (0.64–0.77) |
| 4. Service workers | 10 | 10,908 | 1,091 | 0.78–1.00 | 0.87 (0.83–0.92) |
| 5. Sales workers | 5 | 12,050 | 2,410 | 0.87–0.93 | 0.89 (0.88–0.90) |
| 6. Skilled agricultural, forestry and fishery workers | 5 | 6,260 | 1,252 | 0.00–0.97 | 0.87 (0.73–0.90) |
| 7. Craft and related trades workers | 21 | 5,969 | 284 | 0.00–0.90 | 0.75 (0.57–0.81) |
| 8. Plant, machine operators and assemblers | 29 | 6,021 | 208 | 0.00–1.00 | 0.38 (0.00–0.67) |
| 9. Elementary workers | 12 | 7,024 | 585 | 0.49–0.92 | 0.79 (0.69–0.87) |
Table 1 Examples of the dataset
KSCO: Korean Standard Classification of Occupation.
Table 2 Example of the model's input and output showing TOP five codes and their probabilities
KSCO: Korean Standard Classification of Occupation.
Table 3 Evaluation metrics of the job classification model
K-JCM was fine-tuned model based on DistilKoBERT with dataset of KWCS.
K-JCM: KWCS-Job Classification Model; KWCS: Korea Working Condition Survey.
Table 4 Distribution of precision for each job class, grouped by KSCO major groups (1-digit-code)
Major group A (Armed Forces) was excepted in this table.
KSCO: Korean Standard Classification of Occupation.

