
Articles
- Page Path
- HOME > Ann Occup Environ Med > Volume 27; 2015 > Article
- Research Article Association of cadmium with diabetes in middle-aged residents of abandoned metal mines: the first health effect surveillance for residents in abandoned metal mines
- Hee-seung Son, Soo-geun Kim, Byung-seong Suh, Dong-uk Park, Dae-seon Kim, Seung-do Yu, Yeong-seoub Hong, Jung-duck Park, Byung-kook Lee, Jai-dong Moon, Joon Sakong
-
Annals of Occupational and Environmental Medicine 2015;27:20.
DOI: https://doi.org/10.1186/s40557-015-0071-2
Published online: August 24, 2015
Department of 1Occupational and Environmental Medicine, Kangbuk Samsung Hospital, Medical Center of Sungkyunkwan University School of Medicine, Seoul, Republic of Korea
Department of Environmental Health, Korea National Open University, Seoul, Republic of Korea
Environmental Health Research Department, Environmental Health Research Division, Incheon, Republic of Korea
Department of Preventive Medicine, School of Medicine, Dong-A University, Busan, Republic of Korea
Department of Preventive Medicine, College of Medicine, Chung-Ang University, Seoul, Republic of Korea
Korean Industrial Health Association, Hyesan Bldg., Seoul, Republic of Korea
Department of Preventive Medicine and Public Health, College of Medicine, Chonnam National University Hwasun Hospital, Hwasun, Republic of Korea
Department of Preventive Medicine and Public Health, College of Medicine, Yeungnam University, Daegu, Republic of Korea
• Received: January 14, 2015 • Accepted: July 29, 2015
© Son et al. 2015
Open Access This article is distributed under the terms of the Creative Commons Attribution 4.0 International License (http://creativecommons.org/licenses/by/4.0/), which permits unrestricted use, distribution, and reproduction in any medium, provided you give appropriate credit to the original author(s) and the source, provide a link to the Creative Commons license, and indicate if changes were made. The Creative Commons Public Domain Dedication waiver (http://creativecommons.org/publicdomain/zero/1.0/) applies to the data made available in this article, unless otherwise stated.
Abstract
-
Objective The aim of this study was to determine the association between urinary cadmium (U-cd) concentration and diabetes in middle-aged Korean residents of abandoned mines using the first Health Effect Surveillance for Residents in Abandoned Metal mines (HESRAM).
-
Methods This study was cross-sectional study conducted on 719 residents between 40–70 years in 38 abandoned metal mines in Korea. Data was collected by HESRAM from 2008 to 2011. The correlation coefficient of U-cd and fasting blood glucose, odds ratio in urinary cadmium tertiles and diabetes prevalence was analyzed according to the sex category.
-
Results The correlation coefficient U-cd concentration and fasting blood glucose was 0.182 in male. Logistic regression analysis in male revealed a third tertile odds ratio of U-cd (2 μg/g creatinine < U-cd) while diabetes prevalence was 1.81 (95 % CI 1.05-3.12) with adjusted age, BMI, smoking and alcohol consumption, region, family income. On the other hand, the odds ratio for third tertile of U-cd (3 μg/g creatinine < U-cd) between diabetes prevalence in female was 1.39 (95 % CI 0.52-3.72) in addition to adjusted menopausal status.
-
Conclusions Environmental exposure to cadmium in abandoned mine residents was associated with diabetes in male. Closed monitoring and periodic evaluation of the health effects of chronic environmental exposure on abandoned mines residents will be needed.
Introduction
Health problems associated with heavy metal exposure have received worldwide concern in the recent past. People living around abandoned metal mines face health risk, as a result of water and soil contamination [1]. Heavy metal pollutants act as endocrine disruptors, when ingested in the body leading to hormonal imbalance [2]. Among heavy metal pollutants, cadmium is the most harmful because it influences several human organs, such as kidney and liver [3, 4].
While diabetic mellitus has become a world-wide health issue [5], its prevalence has been increasing especially in Korea. In 2011, the prevalence of diabetes in the Korean population was 12.4 % among people above 30 years [6, 7].
Pancreatic beta cells dysfunction in releasing insulin is a cause of diabetes [8]. The insufficiency of pancreatic beta cells can be caused by various reasons including genetic vulnerability, ageing, lifestyle, insulin resistance, and environmental factors among others [8]. Some experimental studies on animals showed that cadmium was quickly absorbed bythe pancreatic beta cells in competition with zinc [9, 10].
In this context, it is necessary to consider the association of cadmium with diabetes. A study of hemoglobinA1c (HbA1c) in non-smokers, had positive correlation with cadmium levels in Type II diabetes, impaired fasting glucose (IFG), and impaired glucose tolerance (IGT) patients, however the study had a small sample size [11]. For now, the association of cadmium with diabetes is controversial due to different results [12, 13].
The aim of this study is to determine the association between urinary cadmium (U-cd) concentration and diabetes in middle-aged Korean residents of abandoned mines using the first Health Effect Surveillance for Residents in Abandoned Metal mines (HESRAM). It goes ahead to identify diabetic risk factor linked to cadmium and suggests the basis to control the levels of U-cd.
Methods
HESRAM was performed from 2008 to 2011 in bid to evaluate health effects for residents in 38 abandoned metal mines. The sample size of 2,324 was selected from a population between the ages of 40 and 70 years. Groupsexcluded include: those who did not respond to the questionnaire (n = 843), those who did not measure U-cd or blood cadmium (B-cd) concentrations (n = 324), and those who did not respond to the period of residence question (n = 121).
Out of the remaining 1,036 subjects, exclusion comprised of those who had lived in abandoned mines less than 10 years (n = 201), those who did not measure fasting blood glucose (n = 3), those who did not measure anthropometry (n = 12), those who did not measure blood pressure (n = 5), those who had been treated for tuberculosis (n = 3), those who had been treated for thyroid disease (n = 25), those who had past history of chronic kidney disease and epilepsy (n = 4), and those who had been diagnosed with cancer or were undergoing treatment for cancer (n = 64). Finally, a total of 719 subjects participated in this study (Fig. 1).

U-cd and B-cd samples were collected in six universities. B-cd was analyzed quantitatively using flameless atomic adsorption spectrometry (AAS). On the other hand, U-cd was analyzed quantitatively using flameless AAS, and graphite furnace attached to atomic absorption spectrophotometer. Both B-cd and U-cd were assayed at Dong-A University. U-cd concentrations were corrected using urinary creatinine concentration. Limit of detection (LOD) of blood cadmium was 0.213 μg/Lin 2010, 0.294 μg/L in2011. For urine cadmium, LOD was 0.0307 μg/L in 2010, 0.0310 μg/L in 2011. Limit of quantification (LOQ) in 2011 was 0.0931 μg/L for blood cadmium, 0.0960 μg/L for urine cadmium.
The criteria for diabetes was defined as the existence of past diabetes history, for cases in which treatment of diabetes resulted in measurement of more than 126 mg/dL in fasting blood glucose according to diabetes diagnostic criteria in American Diabetes Association (ADA) [7].
Blood pressure was measured twice and the average mean was recorded. Fasting blood glucose was measured after fasting at least 8 hours. Height and weight was measured using standardized methods and body mass index (BMI) was calculated using formula. High exposure regions were clustered according to the presence of lead (Pb), zinc (Zn), and copper (Cu) mines and the rest were classified as low exposure regions.
The questionnaire collected information on smoking habits, alcohol consumption, social economic status, and menopausal status. Smoking habits based on the questionnaire was divided into the following categories including: non-smokers, ex-smokers, and current smokers. “Are you smoking a cigarette more than 20 packs so far?“. Alcohol consumption based on the questionnaire was divided into non-drinker, ex-drinker, and current drinker. “ Do you drink? ”Social economic status was categorized into 4 groups according to the family income such as; less than 500,000 won, 500,000-1,000,000 won, 1,000,000-1,500,000 won, above 1,500,000 won. The menopausal status in female was clustered in two groups.
The U-cd and B-cd concentrations, was used to analyze the correlation coefficient between fasting blood glucose and diabetic risk factor in male and female. Since diabetic drugs lower serum glucose concentration, (avoid using first person tense always use third person) the correlation coefficient analysis was executed in everyone except those eligible for treatment diabetes and serum glucose concentration is less than 126 mg/dL. The chi-square test was performed on the tertile with prevalence diabetes by dividing the U-cd level into third quartile in male and female. Diabetes prevalence odds ratio for the three tertiles of U-cd, was analyzed using multiple logistic regression at 95 % confidence interval. Odds ratio was analyzed in non-adjusted and adjusted models. Statistical analyses were performed using IBM SPSS version 19 (IBM Co., NY, USA).This study was approved by Kangbuk Samsung Hospital Institutional Review Board.
Result
A total of 719 subjects were used in the study. About 489 (68 %) out of 719 subjects, were male whereas the remaining 230 (32 %) respondents were female with a mean age of 59.1 years for both genders. While, there were no significant age differences between male and female, the BMI was higher for female than male. Blood pressure measurements showed no significant difference between male and female.
B-cd concentration was 1.7 μg/L with no significant differences between male and female, however, the U-cd concentration in female was 2.63 μg/g creatinine, and 2.13 μg/g creatinine in male. It becomes evident that U-cd concentration in female was higher than male. With respect to geometric mean, there was no significant difference in B-cd concentration between male and female.
In the study, the high and low exposure groups were 37.1 % and 62.9 % respectively. Approximately, 34.4 % of the study subjects were non-smokers, 23.6 % ex-smokers, and 42.0 % current smokers. Male were more than female when it comes to current smokers. About 52 % of respondents were current drinkers with male registering a higher percentage than female (Table 1).
Table 1
Baseline characteristics of study participants
Region was divided by kind of mines; high exposure region was Pb, Zn, Cu mines and low exposure region was otherwise mines
p-value was calculated by student t test or chi-square test
BMI, body mass index; BP, blood pressure; Cr, creatinine; AM, arithmetical mean; GM, geometric mean; CI, confidence interval
Table 2 shows the U-cd and B-cd concentrations of study participants, where increase in age, led to the increase in U-cd and B-cd concentrations. Diabetes group had higher U-cd and B-cd concentration than non-diabetic group. B-cd concentration was higher in current smokers and current drinker groups were high.
Table 2
Discriptive statistics for urine and blood cadmium levels in study participants
Region was divided by kind of mines; high exposure region was Pb, Zn, Cu mines and low exposure region was otherwise mines
p-value was calculated by student t-test or ANOVA
BMI, body mass index; Cr, creatinine; AM, arithmetical mean; SD, standard deviation; GM, geometric mean; CI, confidence interval
Urine cadmium concentration in Diabetes was 2.72 μg/g creatinine and 2.16 μg/g creatinine in non-diabetes. Urine cadmium concentration was higher for diabetic than non-diabetic (p = 0.049). There was no significance difference between blood cadmium concentrations in diabetic and non-diabetic (1.70 vs 1.70, p = 0.926) (Table 2).
Table 3 shows the correlation between U-cd and fasting blood glucose, and the correlation between U-cd and diabetic risk factors in male and female. The correlation for B-cd was analyzed as well. Out of the 719 subjects, about 684 studied for diabetes treatment had serum glucose level which was less than 126 mg/dL. Nonetheless, 35 subjects were omitted.
Table 3
Correlation coefficients between cadmium and clinical variables
While the U-cd concentration was correlated between BMI and fasting blood glucose in male and female, the B-cd concentration in male was correlated between age and BMI. Cadmium concentration was negatively correlated with BMI in male, however, the U-cd concentration in male was positive correlated with fasting blood glucose (Table 3).
According to the mean comparison of age, BMI, and fasting blood glucose in male and female was analyzed not only using ANOVA but also based on the three tertiles of U-cd concentration. The prevalence of diabetes was analyzed with chi-square test (Table 4).
Table 4
Comparison of age, glucose, BMI, diabetes prevalence according to the three tertiles of urine cadmium
U-cd concentration in the study was not correctly divided into three tertile because many cases represented the same U-cd concentration. In male, the first tertile was ≤1 μg/g creatinine in U-cd, while the second tertile was 1 μg/g creatinine < U-cd ≤ 2 μg/g creatinine. The third tertile was >2 μg/g creatinine in U-cd. In female, the first tertile was ≤ 1 μg/g creatinine in U-cd, while the second tertile was 1 μg/g creatinine < U-cd ≤ 3 μg/g creatinine, and the third tertile was > 3 μg/g creatinine in U-cd.
Age, glucose, BMI showed differences in each tertile in male with no difference in female. According to the increase in tertile, the prevalence of diabetes increased significantly in male but there was no statistically significant increase in female.
Based on the first tertile, Table 5 showed odds ratio and 95 % confidence interval for the prevalence of diabetes to the second and third tertile of U-cd concentration in male and female. Three models used for analysis include, Model 1 was not adjusted for confounding factor, Model 2 was adjusted for age And Model 3 was adjusted for age, sex, BMI, smoking habits, alcohol consumption, region, family income in male. Model 3was additionally adjusted for menopausal status in female.
Table 5
Non–adjusted and adjusted odds ratio and 95 % CI of prevalent diabetes according to the three tertiles of urine cadmium
The odds ratio in male was 1.52 in the second tertile, however, it was not statistically significant at model 1. The odds ratio was 1.96 in third tertile and statistically significant. Similar to model 1, model 2, like was not statistically significant in the second tertile. However, the odds ratio in the third tertile was 1.89 and statistically significant. Similarly model 3 showed no statistical significance in second tertile. Nonetheless, the odds ratio in the third tertilewas 1.81 and statistically significant. In females, there was no statistically significant in all models.
Discussion
Chronic exposure to cadmium resulted from smoking and environmental exposure [14, 15]. Cadmium does not exist solely by mining activities. It is produced as a by-product in the process of mining and melting zinc, copper, and lead [16].
B-cd concentration was 1.70 μg/L in this study, nevertheless if compared to the study based on the Korea National Health and Nutrition Examination Survey (KNHANES), the Korea population’s blood cadmium concentration was 1.16 μg/L in diabetes and 1.10 μg/L in non-diabetes [13]. The B-cd level of residents in abandoned mines was higher than Korean population. U-cd concentration was 2.29 μg/g creatinine in the study, this was less than biologic exposure indices (BEI), 5 μg/g creatinine. Moreover, in the Korean lead worker study, urine cadmium concentration was 0.98 μg/g creatinine [17], while 1.93 μg/g creatinine was evident in a Japenese population study [18]. We found that B-cd level and U-cd level of residents in abandoned mines was relatively higher than other population.
B-cd level reflects recent exposure, U-cd level reflects a relatively past exposure. If low exposure of cadmium continues, U-cd reflects the accumulation in body amounts [19, 20]. For this reason, in order to determine the effect on chronic cadmium exposure, U-cd level was used in the study.
Diabetes prevalence in residents of abandoned mines was 22 %, this was higher than the prevalence of diabetes for Koreans over 30 years, 12.4 % [7]. Prevalence of diabetes in the Urban area was at 14.5 % [21]. The study population was more than 40 years because diabetes is prevalent in this demographics. Moreover, the prevalence of diabetes in urban areas was higher than in rural areas in developing countries with urbanization trends, however, rural areas showed higher prevalence of diabetes than urban areas in developed countries [22, 23]. Finally, the study was limited to residents in abandoned mines, and its results are difficult to generalize the entire Korean population.
Previous studies that related cadmium with diabetes showed no cadmium concentration [13]. Nevertheless previous studies had disadvantage in using B-cd level. In a foreign study, U-cd level in diabetic group was higher than non-diabetic group [24]. In other studies, increased U-cd level, corresponded with increased fasting blood glucose and prevalence of type II diabetes [12]. In this study, as chronic exposure marker, U-cd concentration was increased; the prevalence of diabetes was higher.
There was no statistically significant relationship between cadmium and diabetes in female. In a Swedenish female prospective study, there were no associations between B-cd or U-cd concentrations and the prevalence or incidence of type II diabetes or impaired glucose tolerance [25]. A study conducted on the northwestern Thailand population revealed no significant association between U-cd and diabetes [26]. These inconsistent findings might be due to different study subjects and methodological limitations such as small study group size, suboptimal subject selection, and lack of adjustment for other potential risk factors. Further study may be useful to infer association cadmium exposure and diabetes in female.
Effects of cadmium are as follows in the development of diabetes. Cadmium is absorbed directly to pancreatic beta cells involved in insulin secretion. In animal experimental study, cadmium was rapidly accumulated in the pancreatic beta cell in mice with hyperglycemia and obese [27]. Cadmium accumulation induced degeneration, necrosis, and weak degranulation in the pancreatic β-cell [28, 29]. Cadmium activates gluconeogenesis on the liver cell and impaires insulin receptor [30]. Furthermore, cadmium Adipocyte in past exposure to cadmium decreased glucose transporter expression and glucose transport activity in cell study, induce a dose-dependent reduction in GLUT4 protein and mRNA expressions [31].
The present study revealed an association of Cadmium with Diabetes in the middle aged residents of Abandoned Metal Mines in male. Prevalence of diabetes was increased in >2 μg/g creatinine in U-cd concentration in male. Moreover, there was a significant association between environmental exposure and disease in residents of abandoned mines. Other studies had associated low concentration cadmium with health effect [12, 32]. Thus, even if there is low-concentration exposure under biological exposure standards, chronic exposure is significant in that it may affect the development of the disease.
While the study had limitations, it utilized type II diabetes to identify association of cadmium with diabetes. On the other hand, HESRAM did not distinguish between type I and type II diabetes in the questionnaire. Thus, the prevalence of diabetes was higher, which may have affected the association of cadmium with diabetes. The study was an attempt to mitigate the impact of the prevalence of typeIdiabetes using the age of 40 years or older. Information on the effect of exposure of other heavy metals is insufficient. In future studies, it will be necessary to study other heavy metals that can affect diabetes together.
Hip/waist ratio has been used to reflect obesity rather than BMI [33]. Because the present study had no data to hip and waist circumference, hip/waist ratio was replaced with BMI. Thus, future studies, should tackle the BMI issue. One of the problems with the questionnaire was the failure to quantify about smoking and alcohol consumption. There was no association between U-cd and diabetes in female. The reason for inconsistence with other studies may be due to a small sample size, selection bias and inadequate information. It will be necessary for further studies to modify the methodology. In male, the association between U-cd and diabetes was observed.
Finally, as a cross-sectional study, it had limits. Additional study design on the topic of whether exposure to chronic cadmium in the development of diabetes is influential would be necessary. However, in spite of these limitations, the biological relation of cadmium and diabetes was confirmed via conventional animal experiments and epidemiological studies. Conclusively there is association U-cd concentration and diabetes.
Conclusion
Even though heavy metal mines have been closed, residents in abandoned mines run the risk of chronic exposure particulalry when exposed to chronic cadmium, not exceeding biological exposure limits. Results of the present study confirm that low concentration of U-cd is associated with diabetes, and may be act as a risk factor for development of diabetes in male. Therefore, it is necessary to observe regular health impact assessment of chronic environmental exposure of residents in abandoned mines. Further studies would be necessary to female.
-
Competing interests
The authors declare that they have no competing interests.
-
Authors’ contributions
HSS: Study concept and design, Drafting of the manuscript. SGK: Analysis of data. Critical revision of the manuscript. BSS: Technical support and analysis of data. DUP, SDY, TSH, JDP, BKL, JDM, JS: Collecting of data. All authors read and approved the final manuscript.
NOTES
- 1. Coelho P, Silva S, Roma-Torres J, Costa C, Henriques A, Teixeira J, et al. Health impact of living near an abandoned mine--case study: Jales mines. Int J Hyg Environ Health 2007;210(3–4):399–402. 10.1016/j.ijheh.2007.01.004. 17321206.ArticlePubMed
- 2. Henson MC, Chedrese PJ. Endocrine disruption by cadmium, a common environmental toxicant with paradoxical effects on reproduction. Exp Biol Med 2004;229(5):383–92.ArticlePDF
- 3. Hwangbo Y, Weaver VM, Tellez-Plaza M, Guallar E, Lee BK, Navas-Acien A. Blood cadmium and estimated glomerular filtration rate in Korean adults. Environ Health Perspect 2011;119(12):1800–5. 10.1289/ehp.1003054. 21835726.ArticlePubMedPMC
- 4. Liu J, Qu W, Kadiiska MB. Role of oxidative stress in cadmium toxicity and carcinogenesis. Toxicol Appl Pharmacol 2009;238(3):209–14. 10.1016/j.taap.2009.01.029. 19236887.ArticlePubMedPMC
- 5. Rathmann W, Giani G. Global prevalence of diabetes: estimates for the year 2000 and projections for 2030. Diabetes Care 2004;27(10):2568–9. 10.2337/diacare.27.10.2568. 15451946.ArticlePubMedPDF
- 6. Cho NH. The epidemiology of diabetes in Korea: from the economics to genetics. Korean Diabetes J 2010;34(1):10–5. 10.4093/kdj.2010.34.1.10. 20532014.ArticlePubMedPMC
- 7. American Diabetes A. Standards of medical care in diabetes--2010. Diabetes Care 2010;33(Suppl 1):S11–61. 10.2337/dc10-S011. 20042772.ArticlePubMedPMCPDF
- 8. El Muayed M, Raja MR, Zhang X, MacRenaris KW, Bhatt S, Chen X, et al. Accumulation of cadmium in insulin-producing beta cells. Islets 2012;4(6):405–16. 10.4161/isl.23101. 23466887.ArticlePubMedPMC
- 9. Gerson RJ, Shaikh ZA. Uptake and binding of cadmium and mercury to metallothionein in rat hepatocyte primary cultures. Biochem. J. 1982;208(2):465–72. 10.1042/bj2080465. 7159412.ArticlePubMedPMCPDF
- 10. Liuzzi JP, Bobo JA, Lichten LA, Samuelson DA, Cousins RJ. Responsive transporter genes within the murine intestinal-pancreatic axis form a basis of zinc homeostasis. Proc Natl Acad Sci U S A 2004;101(40):14355–60. 10.1073/pnas.0406216101. 15381762.ArticlePubMedPMC
- 11. Serdar MA, Bakir F, Hasimi A, Celik T, Akin O, Kenar L, et al. Trace and toxic element patterns in nonsmoker patients with noninsulin-dependent diabetes mellitus, impaired glucose tolerance, and fasting glucose. Int J Diabetes Dev Ctries 2009;29(1):35–40. 10.4103/0973-3930.50713. 20062562.ArticlePubMedPMC
- 12. Schwartz GG, Il’yasova D, Ivanova A. Urinary cadmium, impaired fasting glucose, and diabetes in the NHANES III. Diabetes Care 2003;26(2):468–70. 10.2337/diacare.26.2.468. 12547882.ArticlePubMedPDF
- 13. Moon SS. Association of lead, mercury and cadmium with diabetes in the Korean population: the Korea National Health and Nutrition Examination Survey (KNHANES) 2009–2010. Diabetic Med 2013;30(4):e143–8. 10.1111/dme.12103. 23278294.PubMed
- 14. Elinder CG, Lind B, Kjellstrom T, Linnman L, Friberg L. Cadmium in kidney cortex, liver, and pancreas from Swedish autopsies. Estimation of biological half time in kidney cortex, considering calorie intake and smoking habits. Arch Environ Health 1976;31(6):292–302. 10.1080/00039896.1976.10667239. 999342.PubMed
- 15. Park DU, Kim DS, Yu SD, Lee KM, Ryu SH, Kim SG, et al. Blood levels of cadmium and lead in residents near abandoned metal mine areas in Korea. Environ Monit Assess 2014;186(8):5209–20. 10.1007/s10661-014-3770-1. 24744211.ArticlePubMedPDF
- 16. Godt J, Scheidig F, Grosse-Siestrup C, Esche V, Brandenburg P, Reich A, et al. The toxicity of cadmium and resulting hazards for human health. J Occup Med Toxicol 2006;1:22. 10.1186/1745-6673-1-22. 16961932.ArticlePubMedPMCPDF
- 17. Weaver VM, Kim NS, Jaar BG, Schwartz BS, Parsons PJ, Steuerwald AJ, et al. Associations of low-level urine cadmium with kidney function in lead workers. Occup Environ Med 2011;68(4):250–6. 10.1136/oem.2010.056077. 20974743.ArticlePubMedPMC
- 18. Osada M, Izuno T, Kobayashi M, Sugita M. Relationship between environmental exposure to cadmium and bone metabolism in a non-polluted area of Japan. Environ Health Prev Med 2011;16(6):341–9. 10.1007/s12199-010-0204-8. 21431812.ArticlePubMedPMCPDF
- 19. Chaumont A, Voisin C, Deumer G, Haufroid V, Annesi-Maesano I, Roels H, et al. Associations of urinary cadmium with age and urinary proteins: further evidence of physiological variations unrelated to metal accumulation and toxicity. Environ Health Perspect 2013;121(9):1047–53. 23774576.ArticlePubMedPMC
- 20. Olsson IM, Bensryd I, Lundh T, Ottosson H, Skerfving S, Oskarsson A. Cadmium in blood and urine--impact of sex, age, dietary intake, iron status, and former smoking--association of renal effects. Environ Health Perspect 2002;110(12):1185–90. 10.1289/ehp.021101185. 12460796.ArticlePubMedPMC
- 21. Lee HY, Won JC, Kang YJ, Yoon SH, Choi EO, Bae JY, et al. Type 2 diabetes in urban and rural districts in Korea: factors associated with prevalence difference. J Korean Med Sci 2010;25(12):1777–83. 10.3346/jkms.2010.25.12.1777. 21165294.ArticlePubMedPMC
- 22. Dunstan DW, Zimmet PZ, Welborn TA, De Courten MP, Cameron AJ, Sicree RA, et al. The rising prevalence of diabetes and impaired glucose tolerance: the Australian Diabetes Obesity and Lifestyle Study. Diabetes Care 2002;25(5):829–34. 10.2337/diacare.25.5.829. 11978676.PubMed
- 23. McDermott R, Rowley KG, Lee AJ, Knight S, O’Dea K. Increase in prevalence of obesity and diabetes and decrease in plasma cholesterol in a central Australian aboriginal community. Med J Aust 2000;172(10):480–4. 10901770.ArticlePubMedPDF
- 24. Afridi HI, Kazi TG, Kazi N, Jamali MK, Arain MB, Jalbani N, et al. Evaluation of status of toxic metals in biological samples of diabetes mellitus patients. Diabetes Res Clin Pract 2008;80(2):280–8. 10.1016/j.diabres.2007.12.021. 18276029.ArticlePubMed
- 25. Barregard L, Bergstrom G, Fagerberg B. Cadmium exposure in relation to insulin production, insulin sensitivity and type 2 diabetes: a cross-sectional and prospective study in women. Environ Res 2013;121:104–9. 10.1016/j.envres.2012.11.005. 23261793.ArticlePubMed
- 26. Swaddiwudhipong W, Mahasakpan P, Limpatanachote P, Krintratun S. Correlations of urinary cadmium with hypertension and diabetes in persons living in cadmium-contaminated villages in northwestern Thailand: A population study. Environ Res 2010;110(6):612–6. 10.1016/j.envres.2010.06.002. 20561611.ArticlePubMed
- 27. Nilsson T, Rorsman F, Berggren PO, Hellman B. Accumulation of cadmium in pancreatic beta cells is similar to that of calcium in being stimulated by both glucose and high potassium. Biochim Biophys Acta 1986;888(3):270–7. 10.1016/0167-4889(86)90225-9. 3530337.PubMed
- 28. Demir H, Kanter M, Coskun O, Uz YH, Koc A, Yildiz A. Effect of black cumin (Nigella sativa) on heart rate, some hematological values, and pancreatic beta-cell damage in cadmium-treated rats. Biol Trace Elem Res 2006;110(2):151–62. 10.1385/BTER:110:2:151. 16757843.PubMed
- 29. Kurata Y, Katsuta O, Doi T, Kawasuso T, Hiratsuka H, Tsuchitani M, et al. Chronic cadmium treatment induces islet B cell injury in ovariectomized cynomolgus monkeys. Jpn J Vet Res 2003;50(4):175–83. 12675553.PubMed
- 30. Chapatwala KD, Boykin M, Butts A, Rajanna B. Effect of intraperitoneally injected cadmium on renal and hepatic gluconeogenic enzymes in rats. Drug Chem Toxicol 1982;5(3):305–17. 10.3109/01480548209041060. 7151723.ArticlePubMed
- 31. Han JC, Park SY, Hah BG, Choi GH, Kim YK, Kwon TH, et al. Cadmium induces impaired glucose tolerance in rat by down-regulating GLUT4 expression in adipocytes. Arch Biochem Biophys 2003;413(2):213–20. 10.1016/S0003-9861(03)00120-6. 12729619.ArticlePubMed
- 32. Navas-Acien A, Tellez-Plaza M, Guallar E, Muntner P, Silbergeld E, Jaar B, et al. Blood cadmium and lead and chronic kidney disease in US adults: a joint analysis. Am J Epidemiol 2009;170(9):1156–64. 10.1093/aje/kwp248. 19700501.ArticlePubMedPMC
- 33. Mi SQ, Yin P, Hu N, Li JH, Chen XR, Chen B, et al. BMI, WC, WHtR, VFI and BFI: which indictor is the most efficient screening index on type 2 diabetes in Chinese community population. BES 2013;26(6):485–91. 23816582.PubMed
REFERENCES
Figure & Data
REFERENCES
Citations
Citations to this article as recorded by 
- Co-exposure to environmental cadmium and arsenic leads to kidney damage even at lower concentrations
Jung-Eum Lee, Ju-Young Baek, Jung-Duck Park, Jun Young Chang, Byung-Sun Choi
Journal of Exposure Science & Environmental Epidemiology.2026; 36(3): 603. CrossRef - Diabetic Kidney Disease Associated with Chronic Exposure to Low Doses of Environmental Cadmium
Soisungwan Satarug, Tanaporn Khamphaya, Donrawee Waeyeng, David A. Vesey, Supabhorn Yimthiang
Stresses.2026; 6(1): 4. CrossRef - Environmental exposures to lead, mercury, cadmium, manganese, and arsenic and obesity in Korean adults: Korean National Environmental Health Survey 2009–2017
Jeongwon Ock, Choong-Hee Park, Yoon-Hyeong Choi
Journal of Trace Elements in Medicine and Biology.2025; 92: 127771. CrossRef - Environmental Exposure to Cadmium and Lead Exacerbates Kidney Function in People with Diabetes
Soisungwan Satarug, David A. Vesey, Tanaporn Khamphaya, Donrawee Waeyeng, Supabhorn Yimthiang
Journal of Xenobiotics.2025; 15(6): 199. CrossRef - Associations of metals and metal mixtures with glucose homeostasis: A combined bibliometric and epidemiological study
Kai Li, Yisen Yang, Jiaxin Zhao, Quan Zhou, Yanbing Li, Ming Yang, Yaoyu Hu, Jing Xu, Meiduo Zhao, Qun Xu
Journal of Hazardous Materials.2024; 470: 134224. CrossRef - Is Environmental Cadmium Exposure Causally Related to Diabetes and Obesity?
Soisungwan Satarug
Cells.2023; 13(1): 83. CrossRef - Environmental Cadmium Exposure and Type 2 Diabetes Mellitus Risk: An Overview of Systematic Reviews
Julia Hildebrand, Swarni Thakar, Tonya-Leah Watts, Laura Banfield, Lehana Thabane, Joseph Macri, Stephen Hill, M. Constantine Samaan
Exposure and Health.2022; 14(3): 743. CrossRef - Effects of Environmental Exposure to Cadmium and Lead on the Risks of Diabetes and Kidney Dysfunction
Supabhorn Yimthiang, Phisit Pouyfung, Tanaporn Khamphaya, Saruda Kuraeiad, Paleeratana Wongrith, David A. Vesey, Glenda C. Gobe, Soisungwan Satarug
International Journal of Environmental Research and Public Health.2022; 19(4): 2259. CrossRef - Cadmium exposure and risk of diabetes and prediabetes: A systematic review and dose-response meta-analysis
Tommaso Filippini, Lauren A. Wise, Marco Vinceti
Environment International.2022; 158: 106920. CrossRef - Mitigation of Cadmium Toxicity through Modulation of the Frontline Cellular Stress Response
Soisungwan Satarug, David A. Vesey, Glenda C. Gobe
Stresses.2022; 2(3): 355. CrossRef - A benchmark dose analysis for urinary cadmium and type 2 diabetes mellitus
Peng Shi, Huanchang Yan, Xingjun Fan, Shuhua Xi
Environmental Pollution.2021; 273: 116519. CrossRef - Environmental pollution and diabetes mellitus
Amany El-Sikaily, Mohamed Helal
World Journal of Meta-Analysis.2021; 9(3): 234. CrossRef - Cadmium exposure, fasting blood glucose changes, and type 2 diabetes mellitus: A longitudinal prospective study in China
Lili Xiao, Wei Li, Chunmei Zhu, Shijie Yang, Min Zhou, Bin Wang, Xing Wang, Dongming Wang, Jixuan Ma, Yun Zhou, Weihong Chen
Environmental Research.2021; 192: 110259. CrossRef - Associations between metabolic syndrome and four heavy metals: A systematic review and meta-analysis
Ping Xu, Aiping Liu, Fengna Li, Alexey A. Tinkov, Longjian Liu, Ji-Chang Zhou
Environmental Pollution.2021; 273: 116480. CrossRef - Adipose tissue cadmium concentrations as a potential risk factor for insulin resistance and future type 2 diabetes mellitus in GraMo adult cohort
Inmaculada Salcedo-Bellido, Celia Gómez-Peña, Francisco M. Pérez-Carrascosa, Petra Vrhovnik, Vicente Mustieles, Ruth Echeverría, Željka Fiket, Celia Pérez-Díaz, Rocío Barrios-Rodríguez, José Juan Jiménez-Moleón, Juan Pedro Arrebola
Science of The Total Environment.2021; 780: 146359. CrossRef - Cadmium Is Associated with Type 2 Diabetes in a Superfund Site Lead Smelter Community in Dallas, Texas
Bert B. Little, Robert Reilly, Brad Walsh, Giang T. Vu
International Journal of Environmental Research and Public Health.2020; 17(12): 4558. CrossRef - Advancing Global Health through Environmental and Public Health Tracking
Paolo Lauriola, Helen Crabbe, Behrooz Behbod, Fuyuen Yip, Sylvia Medina, Jan C. Semenza, Sotiris Vardoulakis, Dan Kass, Ariana Zeka, Irma Khonelidze, Matthew Ashworth, Kees de Hoogh, Xiaoming Shi, Brigit Staatsen, Lisbeth E. Knudsen, Tony Fletcher, Danny
International Journal of Environmental Research and Public Health.2020; 17(6): 1976. CrossRef - Assessment of heavy metals by ICP‐OES and their impact on insulin stimulating hormone and carbohydrate metabolizing enzymes
Shakil Saba, Muhammad Sajid Hamid Akash, Kanwal Rehman, Uzma Saleem, Fareeha Fiayyaz, Tanvir Ahmad
Clinical and Experimental Pharmacology and Physiology.2020; 47(10): 1682. CrossRef - Evaluation of the association between urinary cadmium levels below threshold limits and the risk of diabetes mellitus: a dose-response meta-analysis
Fei-Fei Guo, Zhi-Yong Hu, Bing-Yan Li, Li-Qiang Qin, Chunling Fu, Huifang Yu, Zeng-Li Zhang
Environmental Science and Pollution Research.2019; 26(19): 19272. CrossRef - Cadmium exposure induces pancreatic β-cell death via a Ca2+-triggered JNK/CHOP-related apoptotic signaling pathway
Cheng-Chin Huang, Chun-Ying Kuo, Ching-Yao Yang, Jui-Ming Liu, Ren-Jun Hsu, Kuan-I Lee, Chin-Chuan Su, Chin-Ching Wu, Ching-Ting Lin, Shing-Hwa Liu, Chun-Fa Huang
Toxicology.2019; 425: 152252. CrossRef - Roles of C-reactive protein on the association between urinary cadmium and type 2 diabetes
Lili Xiao, Yun Zhou, Jixuan Ma, Limin Cao, Chunmei Zhu, Wei Li, Dongming Wang, Lieyang Fan, Zi Ye, Weihong Chen
Environmental Pollution.2019; 255: 113341. CrossRef - Cadmium Body Burden and Gestational Diabetes Mellitus: A Prospective Study
Wenyu Liu, Bin Zhang, Zheng Huang, Xinyun Pan, Xiaomei Chen, Chen Hu, Hongxiu Liu, Yangqian Jiang, Xiaojie Sun, Yang Peng, Wei Xia, Shunqing Xu, Yuanyuan Li
Environmental Health Perspectives.2018;[Epub] CrossRef - Heavy Metal Exposure and Metabolic Syndrome: Evidence from Human and Model System Studies
Antonio Planchart, Adrian Green, Cathrine Hoyo, Carolyn J. Mattingly
Current Environmental Health Reports.2018; 5(1): 110. CrossRef - Cadmium affects blood pressure and negatively interacts with obesity: Findings from NHANES 1999–2014
Qi Wang, Sheng Wei
Science of The Total Environment.2018; 643: 270. CrossRef - Dietary Cadmium Intake and Its Effects on Kidneys
Soisungwan Satarug
Toxics.2018; 6(1): 15. CrossRef - Gender-specific differences of interaction between cadmium exposure and obesity on prediabetes in the NHANES 2007–2012 population
Fei Jiang, Xueyuan Zhi, Miao Xu, Bingyan Li, Zengli Zhang
Endocrine.2018; 61(2): 258. CrossRef - Association of urinary cadmium with risk of diabetes: a meta-analysis
Yujie Li, Yun Zhang, Weijing Wang, Yili Wu
Environmental Science and Pollution Research.2017; 24(11): 10083. CrossRef - Kidney Cadmium Toxicity, Diabetes and High Blood Pressure: The Perfect Storm
Soisungwan Satarug, David A. Vesey, Glenda C. Gobe
The Tohoku Journal of Experimental Medicine.2017; 241(1): 65. CrossRef - Current health risk assessment practice for dietary cadmium: Data from different countries
Soisungwan Satarug, David A. Vesey, Glenda C. Gobe
Food and Chemical Toxicology.2017; 106: 430. CrossRef - The role of cadmium in obesity and diabetes
Alexey A. Tinkov, Tommaso Filippini, Olga P. Ajsuvakova, Jan Aaseth, Yordanka G. Gluhcheva, Juliana M. Ivanova, Geir Bjørklund, Margarita G. Skalnaya, Eugenia R. Gatiatulina, Elizaveta V. Popova, Olga N. Nemereshina, Marco Vinceti, Anatoly V. Skalny
Science of The Total Environment.2017; 601-602: 741. CrossRef - Association between cadmium exposure and diabetes mellitus risk: a prisma-compliant systematic review and meta-analysis
Ming Wu, Jukun Song, Chen Zhu, Yadong Wang, Xinhai Yin, Guanglei Huang, Ke Zhao, Jianguo Zhu, Zhuhui Duan, Lingkai Su
Oncotarget.2017; 8(68): 113129. CrossRef
 Cite
CiteAssociation of cadmium with diabetes in middle-aged residents of abandoned metal mines: the first health effect surveillance for residents in abandoned metal mines
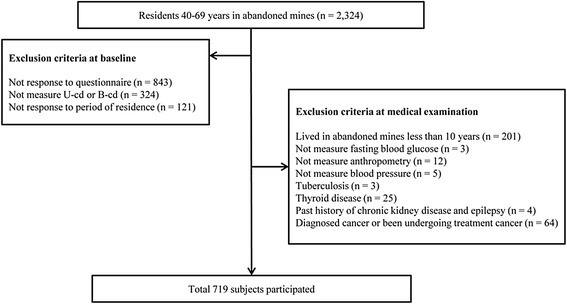
Fig. 1 Flow diagram for the selection of study subjects
Fig. 1
Association of cadmium with diabetes in middle-aged residents of abandoned metal mines: the first health effect surveillance for residents in abandoned metal mines
| Total | Male | Female | P-value | |
|---|---|---|---|---|
| (n = 719) | (n = 489, 68.0 %) | (n = 230, 32.0 %) | ||
| Age, years | 59.1 ± 7.5 | 58.8 ± 7.5 | 59.8 ± 7.5 | 0.071 |
| BMI, kg/cm2 | 24.6 ± 3.6 | 24.2 ± 3.6 | 25.5 ± 3.5 | <0.001 |
| Systolic BP, mmHg | 133.5 ± 17.4 | 133.2 ± 17.4 | 134.1 ± 17.3 | 0.514 |
| Diastolic BP, mmHg | 79.9 ± 11.0 | 80.3 ± 11.0 | 79.1 ± 11.1 | 0.172 |
| Urine Cadmium, μg/g Cr | 2.29 ± 2.20 | 2.13 ± 2.18 | 2.63 ± 2.21 | 0.005 |
| Blood Cadmium, μg/L | 1.70 ± 0.97 | 1.73 ± 0.97 | 1.64 ± 0.95 | 0.254 |
| Glucose, mg/dL | 110.4 ± 62.0 | 114.4 ± 69.2 | 101.9 ± 42.0 | 0.003 |
| Region† | ||||
| High exposure | 267 (37.1) | 211 (43.1) | 56 (24.3) | |
| Low exposure | 452 (62.9) | 278 (56.9) | 174 (75.7) | <0.001 |
| Smoking status | ||||
| Non smoker | 247 (34.4) | 47 (9.6) | 200 (87.0) | |
| Ex-smoker | 170 (23.6) | 164 (33.5) | 6 (2.6) | |
| Current smoker | 302 (42.0) | 278 (56.9) | 24 (10.4) | <0.001 |
| Alcohol consumption | ||||
| Non-drinker | 249 (34.6) | 107 (21.9) | 142 (61.7) | |
| Ex-drinker | 96 (13.4) | 65 (13.3) | 31 (13.5) | |
| Current drinker | 374 (52.0) | 317 (64.8) | 57 (24.8) | <0.001 |
| Family income | ||||
| ≤500,000 won | 342 (47.6) | 196 (40.1) | 146 (63.5) | |
| 500,000-1,000,000 won | 147 (20.4) | 105 (21.5) | 42 (18.3) | |
| 1,000,000-1,500,000 won | 105 (14.6) | 85 (17.4) | 20 (8.7) | |
| >1,500,000 won | 125 (17.4) | 103 (21.1) | 22 (9.6) | <0.001 |
| Menopausal status | ||||
| Yes | 193 (83.9) | 193 (83.9) | ||
| No | 37 (16.1) | 37 (16.1) |
| Classification | N(%) | Urine cadmium, μg/g Cr | Blood cadmium, μg/L | ||||||
|---|---|---|---|---|---|---|---|---|---|
| AM ± SD | p | GM(95 % CI) | p | AM ± SD | p | GM(95 % CI) | p | ||
| Age group | |||||||||
| 40–49 | 90(12.5) | 1.66 ± 1.23 | 1.55(1.38–1.74) | 1.46 ± 0.84 | 1.35(1.23–1.48) | ||||
| 50–59 | 237(33.0) | 2.18 ± 1.64 | 1.91(1.78–2.09) | 1.66 ± 0.85 | 1.51(1.45–1.62) | ||||
| 60–69 | 392(54.5) | 2.49 ± 2.61 | 0.004 | 2.04(1.91–2.14) | 0.003 | 1.79 ± 1.04 | 0.009 | 1.66(1.58–1.74) | 0.001 |
| Gender | |||||||||
| Male | 489(68.0) | 2.13 ± 2.18 | 1.82(1.74–1.91) | 1.73 ± 0.97 | 1.62(1.55–1.70) | ||||
| Female | 230(32.0) | 2.63 ± 2.21 | 0.005 | 2.14(2.00–2.34) | <0.001 | 1.64 ± 0.95 | 0.254 | 1.48(1.41–1.58) | 0.065 |
| Region | |||||||||
| High exposure | 267(37.1) | 2.52 ± 2.80 | 2.04(1.86–2.19) | 1.88 ± 0.90 | 1.74(1.66–1.82) | ||||
| Low exposure | 452(62.9) | 2.15 ± 1.75 | 0.049 | 1.86(1.74–1.95) | 0.039 | 1.60 ± 0.99 | <0.001 | 1.48(1.41–1.55) | <0.001 |
| BMI | |||||||||
| <25 | 412(57.3) | 2.37 ± 2.46 | 2.00(1.86–2.09) | 1.79 ± 1.05 | 1.62(1.55–1.70) | ||||
| ≥25 | 307(42.7) | 2.17 ± 1.81 | 0.226 | 1.86(1.70–2.00) | 0.076 | 1.59 ± 0.83 | 0.006 | 1.51(1.41–1.58) | 0.026 |
| Diabetes | |||||||||
| Non-diabetes | 561(78.0) | 2.16 ± 1.70 | 1.86(1.78–1.95) | 1.70 ± 0.95 | 1.58(1.51–1.62) | ||||
| Diabetes | 158(22.0) | 2.72 ± 3.41 | 0.049 | 2.14(1.95–2.40) | 0.009 | 1.70 ± 1.02 | 0.926 | 1.58(1.48–1.70) | 0.955 |
| Smoking | |||||||||
| Non smoker | 247(34.4) | 2.51 ± 2.82 | 2.09(1.91–2.29) | 1.52 ± 0.94 | 1.45(1.35–1.51) | ||||
| Ex-smoker | 170(27.3) | 2.10 ± 1.78 | 1.78(1.62–1.95) | 1.53 ± 0.69 | 1.45(1.38–1.55) | ||||
| Current smoker | 302(42.0) | 2.21 ± 1.81 | 0.138 | 1.91(1.78–2.04) | 0.083 | 1.95 ± 1.06 | <0.001 | 1.77(1.66–1.86) | <0.001 |
| Alcohol consumption | |||||||||
| Non-drinker | 248(34.6) | 2.57 ± 2.76 | 2.09(1.91–2.29) | 1.69 ± 0.90 | 1.55(1.45–1.62) | ||||
| Ex-drinker | 96(13.4) | 2.33 ± 1.79 | 2.04(1.78–2.29) | 1.42 ± 0.80 | 1.38(1.26–1.51) | ||||
| Current drinker | 374(52.0) | 2.09 ± 1.84 | 0.028 | 1.78(1.70–1.91) | 0.013 | 1.79 ± 1.03 | 0.004 | 1.66(1.55–1.74) | 0.009 |
| Family income (won) | |||||||||
| ≤500,000 | 342(47.6) | 2.40 ± 2.24 | 1.95(1.78–2.09) | 1.71 ± 1.00 | 1.58(1.51–1.66) | ||||
| 500,000–1,000,000 | 147(20.4) | 2.15 ± 1.56 | 1.95(1.78–2.14) | 1.84 ± 0.98 | 1.70(1.55–1.82) | ||||
| 1,000,000–1,500,000 | 105(14.6) | 2.12 ± 1.50 | 1.86(1.66–0.29) | 1.60 ± 1.00 | 1.51(1.38–1.66) | ||||
| >1,500,000 | 125(17.4) | 2.29 ± 3.09 | 0.569 | 1.91(1.74–2.14) | 0.939 | 1.62 ± 0.80 | 0.177 | 1.48(1.38–1.62) | 0.164 |
| Menopausal status ( only female) | |||||||||
| Yes | 193(83.9) | 2.70 ± 1.54 | 2.19(2.00–2.40) | 1.65 ± 0.96 | 1.51(1.41–1.62) | ||||
| No | 37(16.1) | 2.27 ± 2.32 | 0.285 | 2.04(1.66–2.51) | 0.534 | 1.59 ± 0.96 | 0.736 | 1.45(1.20–1.70) | 0.653 |
| Male(n = 466) | Female(n = 218) | |||
|---|---|---|---|---|
| Urine cadmium, μg/g creatinine | Blood cadmium, μg/L | Urine cadmium, μg/g creatinine | Blood cadmium, μg/L | |
| Age, year | 0.069 | 0.111* | 0.178** | 0.110 |
| Systolic BP, mmHg | −0.057 | −0.016 | −0.094 | −0.094 |
| Diastolic BP, mmHg | −0.020 | 0.040 | −0..080 | −0.066 |
| BMI, kg/cm2 | −0.113* | −0.178** | −0.070 | −0.074 |
| Glucose, mg/dL | 0.182** | 0.037 | −0.009 | −0.067 |
| Male(n = 489) | |||||
|---|---|---|---|---|---|
| 1sttertile | 2ndtertile | 3rdtertile | p- value | Post hoc comparison | |
| (n = 199) | (n = 151) | (n = 139) | |||
| (U-Cd ≤1 μg/g Cr) | (1 μg/g Cr < U-Cd ≤2 μg/g Cr) | (2 μg/g Cr < U-Cd) | |||
| Age, year | 57.4 ± 7.9 | 60.1 ± 7.1 | 59.1 ± 6.8 | 0.003a | I ≠ IIIb |
| Glucose, mg/dL | 105.3 ± 38.9 | 117.4 ± 66.2 | 124.3 ± 98.7 | 0.037a | I ≠ IIIb |
| BMI, kg/cm2 | 24.80 ± 4.00 | 24.09 ± 3.14 | 23.36 ± 3.29 | <0.001a | I ≠ IIIb |
| Diabetes prevalence | 17.1 % | 23.8 % | 28.8 % | 0.010 | |
| Female(n = 176) | |||||
| 1sttertile | 2ndtertile | 3rdtertile | p -value | Post hoc comparison | |
| (n = 79) | (n = 58) | (n = 39) | |||
| (U-Cd ≤1 μg/g Cr) | (1 μg/g Cr < U-Cd ≤3 μg/g Cr) | (3 μg/g Cr < U-Cd) | |||
| Age, year | 58.8 ± 8.4 | 58.8 ± 7.4 | 60.7 ± 7.0 | 0.408a | |
| Glucose, mg/dL | 102.7 ± 49.1 | 102.8 ± 41.8 | 106.0 ± 39.5 | 0.923a | |
| BMI, kg/cm2 | 25.86 ± 3.26 | 25.83 ± 3.38 | 24.48 ± 3.15 | 0.074a | |
| Diabetes prevalence | 20.3 % | 17.2 % | 30.8 % | 0.282 |
| Male (n = 489) | |||
|---|---|---|---|
| 1sttertile | 2ndtertile | 3rdtertile | |
| (n = 199) | (n = 151) | (n = 139) | |
| (U-Cd ≤1 μg/g Cr) | (1 μg/g Cr < U-Cd ≤2 μg/g Cr) | (2 μg/g Cr < U-Cd) | |
| Model 1 | Reference | 1.52 (0.90–2.57) | 1.96 (1.17–3.30) |
| Model 2 | Reference | 1.42 (0.83–2.42) | 1.89 (1.12–3.19) |
| Model 3 | Reference | 1.42 (0.83–2.45) | 1.81(1.05–3.12) |
| Female (n = 176) | |||
| 1sttertile | 2ndtertile | 3rdtertile | |
| (n = 79) | (n = 58) | (n = 39) | |
| (U–Cd ≤1 μg/g Cr) | (1 μg/g Cr < U–Cd ≤3 μg/g Cr) | (3 μg/g Cr < U–Cd) | |
| Model 1 | Reference | 0.82 (0.34–1.97) | 1.75 (0.73–4.19) |
| Model 2 | Reference | 0.82 (0.34–1.97) | 1.72 (0.72–4.15) |
| Model 3* | Reference | 0.66 (0.25–1.73) | 1.39 (0.52–3.72) |
Table 1 Baseline characteristics of study participants
Region was divided by kind of mines; high exposure region was Pb, Zn, Cu mines and low exposure region was otherwise mines
BMI, body mass index; BP, blood pressure; Cr, creatinine; AM, arithmetical mean; GM, geometric mean; CI, confidence interval
Table 2 Discriptive statistics for urine and blood cadmium levels in study participants
Region was divided by kind of mines; high exposure region was Pb, Zn, Cu mines and low exposure region was otherwise mines
BMI, body mass index; Cr, creatinine; AM, arithmetical mean; SD, standard deviation; GM, geometric mean; CI, confidence interval
Table 3 Correlation coefficients between cadmium and clinical variables
*
**
Table 4 Comparison of age, glucose, BMI, diabetes prevalence according to the three tertiles of urine cadmium
aStatistical significances were tested by one way analysis of variances among groups
bThe same letters indicate non-significant difference between groups based on Tukey’s multiple comparison test
Table 5 Non–adjusted and adjusted odds ratio and 95 % CI of prevalent diabetes according to the three tertiles of urine cadmium
Model 1: non–adjusted
Model 2: adjusted for age
Model 3: adjusted for age, BMI, smoking, alcohol consumption, region, family income
Model 3*: adjusted for age, BMI, smoking, alcohol consumption, region, family income, menopausal status

