
Articles
- Page Path
- HOME > Ann Occup Environ Med > Volume 35; 2023 > Article
- Original Article Association between hearing loss and high-sensitivity C-reactive protein: the Kangbuk Samsung Cohort Study
-
Jihoon Kim1
 , Yesung Lee2, Eunhye Seo1, Daehoon Kim1, Jaehong Lee1, Youshik Jeong1, Seonghyun Kwon1, Jinsook Jeong1, Woncheol Lee1
 -
Annals of Occupational and Environmental Medicine 2023;35:e38.
DOI: https://doi.org/10.35371/aoem.2023.35.e38
Published online: September 11, 2023
1Department of Occupational and Environmental Medicine, Kangbuk Samsung Hospital, Sungkyunkwan University School of Medicine, Seoul, Korea.
2Medical Support Division, Pyeongchang County Public Health Clinic, Pyeongchang, Korea.
- Correspondence: Woncheol Lee. Department of Occupational and Environmental Medicine, Kangbuk Samsung Hospital, Sungkyunkwan University School of Medicine, 29 Saemunan-ro, Jongno-gu, Seoul 03181, Korea. doctor.oem@gmail.com
• Received: June 5, 2023 • Revised: August 9, 2023 • Accepted: August 23, 2023
Copyright © 2023 Korean Society of Occupational & Environmental Medicine
This is an Open Access article distributed under the terms of the Creative Commons Attribution Non-Commercial License (https://creativecommons.org/licenses/by-nc/4.0/) which permits unrestricted non-commercial use, distribution, and reproduction in any medium, provided the original work is properly cited.
Abstract
-
Background Hearing loss (HL) is linked to an elevated risk of cardiovascular diseases (CVDs). The pathogeneses of HL and CVD commonly involve inflammatory responses. Previous studies investigated elevated levels of inflammatory biomarkers in subjects with HL, however, their findings did not demonstrate statistical significance. In our cross-sectional and longitudinal study, we investigated the correlation between HL and increased high-sensitivity C-reactive protein (hsCRP) levels to determine how HL is associated with CVDs.
-
Methods We conducted a cross-sectional study with workers aged over 18 years who underwent health check-ups at our institution between 2012 and 2018 (n = 566,507), followed by conducting a longitudinal study of workers aged > 18 who underwent health checkups at least twice at our institution between 2012 and 2018 (n = 173,794). The definition of HL was as an average threshold of ≥ 20 dB in pure-tone air conduction at 0.5, 1.0, and 2.0 kHz in both ears. The incidence of increased hsCRP levels throughout the follow-up period was defined as a level exceeding 3 mg/L. Logistic regression and generalized estimating equations were performed to estimate the risk of increased hsCRP levels according to the occurrence of HL in groups stratified by age.
-
Results In the cross-sectional study, the multivariate-adjusted odds ratio (OR) was 1.17 (95% confidence interval [CI]: 1.02–1.34); the OR was 0.99 (95% CI: 0.80–1.22) in those under 40 and 1.28 (1.08–1.53) in those over 40. In the longitudinal study, the multivariable-adjusted OR was 1.05 (95% CI: 0.92–1.19); the OR was 1.10 (95% CI: 0.90–1.35) in those under 40 and 1.20 (1.01–1.43) in those over 40.
-
Conclusions This cross-sectional and longitudinal study identified an association between HL and increased hsCRP levels in workers aged over 40 years.
BACKGROUND
Hearing loss (HL) stands as one of the prevailing chronic conditions on a global scale.1 An estimated 1.57 billion people had HL in 2019, accounting for 20.3% of the global population.2 HL can affect interpersonal communication, quality of life, and daily functioning.3 In addition, HL is linked to various health outcomes, including cognitive impairment, dementia,4 depression,5 and disability.6 It is important to follow-up patients with HL to determine whether related diseases occur.
Previous studies have confirmed that HL is linked to an increased risk of morbidity and mortality related to cardiovascular diseases (CVDs). However, the underlying mechanisms have not been fully established.7,8 It has been previously suggested that the pathogeneses of HL and CVD commonly involve inflammatory responses. Previous studies also showed that permanent damage to cochlear neurons could be involved to HL through the inflammatory response and that the initiation and progression of atherosclerosis are caused by inflammatory processes.9,10 An observational study found an correlation between HL and subclinical atherosclerosis, a known risk factor for CVD.11 Several studies have explored the connection between HL and serum inflammatory biomarkers, such as high-sensitivity C-reactive protein (hsCRP), however, their results were not statistically significant.12,13,14
hsCRP is a biochemical test which is a highly sensitive quantification of plasma C-reactive protein (CRP).15 In other words, hsCRP measures plasma CRP and the detection limit of hsCRP is lower than conventional CRP measurements.15 CRP is an acute-phase reactant produced by the liver in response to increased levels of cytokines derived from inflammatory lesion.16 Unlike other biomarkers, CRP levels are stable over long periods and display no diurnal variation.17 The plasma CRP also increases in chronic diseases such as chronic wounds, malignancy, and metabolic disorders.18 In addition, CRP is a biomarker that predicts stroke, peripheral arterial disease, and myocardial infarction.19 Considering that the CRP is a predictive factor for the risk of cardiovascular events,20 it can be inferred that CRP plays a role in the relationship between HL and CVD.
To determine how HL is associated with CVD, we examined the correlation between HL and increased hsCRP levels through both cross-sectional and longitudinal studies.
METHODS
This study was conducted in two parts: a cross-sectional and longitudinal study. We analyzed the data from Kangbuk Samsung Cohort Study. This is a cohort study of South Korean adults aged at least 18 years who underwent a comprehensive annual or biennial health examination at Kangbuk Samsung Hospital Total Healthcare Center in Seoul and Suwon, South Korea.21 Since hsCRP acts as an acute-phase inflammatory mediator, cross-sectional and longitudinal study have been conducted.
In this cross-sectional study, participants who underwent health examinations between January 1, 2012, and December 31, 2018 (n = 566,507) were included and only data corresponding to the first visit were analyzed. We excluded 362,416 participants based on the following six criteria:1) missing data on pure-tone audiometry; 2) missing hsCRP data; 3) missing data on working hours and shift work; 4) history of cerebrovascular and CVDs; 5) history of hypertension, diabetes, or dyslipidemia; and 6) history of cancer. A total of 204,091 participants were included in the final analysis of this cross-sectional study (Fig. 1).
Fig. 1
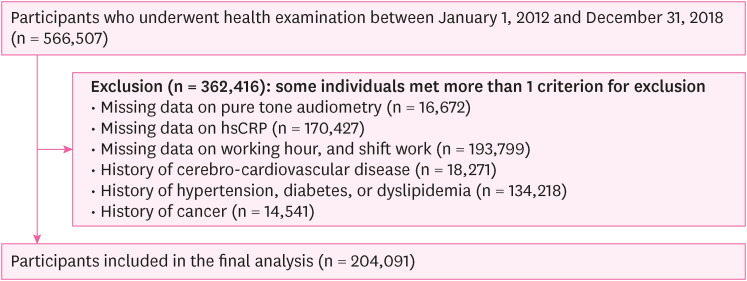
Flowchart of the study participants (cross-sectional study).
hsCRP: high-sensitivity C-reactive protein.
In this longitudinal study, participants who underwent health checkups, including serum hsCRP, at least twice between January 1, 2012, and December 31, 2018 (n = 173,794) were included. We excluded 55,144 participants based on the following five criteria:1) missing data on pure-tone audiometry, working hours, or shift work at baseline; 2) increased hsCRP level at baseline (> 3 mg/L: corresponding to the result variable of our study); 3) history of CVD at baseline; 4) history of hypertension, diabetes, or dyslipidemia at baseline; and 5) history of cancer at baseline. A total of 118,650 participants were included in the final analysis of this longitudinal study (Fig. 2). The ‘baseline’ was set as the first visit year for each participant.
Fig. 2
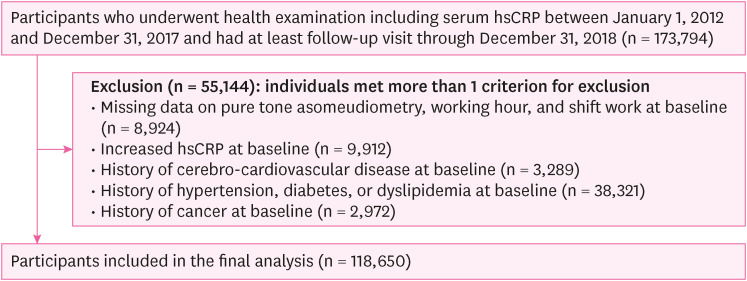
Flowchart of the study participants (longitudinal study).
hsCRP: high-sensitivity C-reactive protein.
Audiometry, blood tests (including hsCRP), and other examinations were conducted at XXX. A standardized questionnaire designed for self-administration was employed to gather data regarding demographic information, lifestyle factors, and medical history.21 Heavy alcohol intake was categorized as ≥ 30 g/day for males and ≥ 20 g/day for females. Smoking was categorized as never, ex, or current. The frequency of weekly moderate or vigorous physical activity was categorized as none, < three times, and ≥ three times. Monthly household income was categorized as two groups: less than 6 million Korean Republic won (KRW) or 6 million KRW or more per month. Educational level was categorized as less than college, college graduate, or higher. Marital status was categorized as two groups: married or unmarried. The work schedule information of the subjects was collected through the following inquiry: “In the past year, during which time of the day did you work the most?” Daytime work was defined as work primarily conducted between 6 am and 6 PM, while shift work was defined as work conducted outside of these hours. The subjects’ sitting blood pressure (BP) and anthropometric measurements were measured by skilled nurses. Hypertension was defined as BP equal to or exceeding 140/90 mmHg or receiving pharmacological treatment for reducing BP. Obesity was defined as a body mass index (BMI) equal to or greater than 25 kg/m2, which is Asian-specific diagnostic criteria for obesity.
Pure-tone audiometry was conducted by skilled audiometry technicians using a GSI 67 audiometer (Grason-Stadler, Bedford, MA, USA) fitted with TDH-39 supraaural earphones (Telephonics Co., Farmingdale, NY, USA) within a specially designed sound-attenuating booth. Pure-tone air conduction thresholds were assessed in decibels (dB) of the hearing level for both ears at frequencies of 0.5, 1.0, and 2.0 kHz. HL was defined as an average of pure tone air conduction thresholds at 0.5, 1.0, and 2.0 kHz ≥20 dB in both ears.
Blood samples were obtained from the antecubital vein after a minimum fasting period of 10 hours. Blood examinations covered lipid profiling and the measurement of serum insulin, glucose, and hsCRP levels. Homeostatic model assessment of insulin resistance (HOMA-IR) was estimated according to the following formula: fasting blood insulin (U/mL) × fasting blood glucose (mg/dL)/405.22 Diabetes mellitus was defined as either having a fasting serum glucose level equal to or exceeding 126 mg/dl or being currently treated with antidiabetic medication. Serum hsCRP levels were quantified utilizing particle-enhanced immunoturbidimetric assay with a modular analytical P800 apparatus (Roche Diagnostics, Basel, Switzerland). The incidence of increased hsCRP levels during the follow-up period was defined as serum hsCRP > 3 mg/L, according to the CVD risk criteria established by the American Heart Association and Centers for Disease Control and Prevention.23
One-way analysis of variance and chi-square test were performed to compare the characteristics of the study participants stratified by hearing status at baseline. Logistic regression was utilized to assess the risk of increased hsCRP levels according to the hearing status in this cross-sectional study. Generalized estimating equations (GEEs) were performed to address the cluster effect of the participants in the longitudinal study.
The analyses were stratified based on age 40 years. Three models were established to control for potential confounders. Model 1 was adjusted for age and sex. Model 2 was additionally adjusted for alcohol consumption, smoking, exercise, education, income, marital status, BMI, insulin resistance, BP, blood glucose levels, and low-density lipoprotein cholesterol (LDL-C) levels. Model 3 was additionally adjusted for working hours and schedules. The outcomes were presented as odds ratios (ORs) with 95% confidence intervals (CIs).
All statistical analyses were performed using STATA software (version 17.0; StataCorp LP, College Station, TX, USA). Statistical significance was defined as a two-sided p-value < 0.05.
This study was approved by the Institutional Review Board (IRB) of Kangbuk Samsung Hospital (IRB No. 2023-03-033), and waived the requirement for informed consent. This was due to the use of anonymized data that were routinely collected as part of health checkups.
RESULTS
In this cross-sectional study, the mean age of the participants was 35.6 years (standard deviation [SD]: 7.7), and 59% were male. There were significant differences in age, sex, alcohol intake, smoking status, educational level, exercise status, household income, marital status, BMI, HOMA-IR, systolic blood pressure (SBP), glucose level, LDL-C level, working hours, and work schedule between the two groups. Among 204,091 participants, the prevalence of HL was 0.02% (Table 1). According to the logistic regression model, the HL group had a higher risk of increased hsCRP levels than the non-HL group. Compared to the non-HL group, the crude OR (95% CI) for increased hsCRP in the HL group was 1.24 (1.10–1.39). In model 1, which was adjusted for age and sex, the adjusted OR (95% CI) for increased hsCRP in the HL group was 1.25 (1.11–1.40). In model 2, which was further adjusted for alcohol consumption, smoking, exercise, education, income, marital status, BMI, insulin resistance, BP, blood glucose, and LDL cholesterol, the adjusted OR (95% CI) for increased hsCRP in the HL group was 1.17 (1.02–1.34). In model 3, which was further adjusted for working hours and work schedules, the adjusted OR (95% CI) for increased hsCRP in the HL group was 1.17 (1.02–1.34). However, when stratified by age (40 years), the association was significant only in those over 40 years. The ORs (95% CI) of the crude model, models 1, 2, and 3 for increased hsCRP in the HL groups over 40 were 1.33 (1.15–1.54), 1.30 (1.13–1.51), 1.28 (1.08–1.52), and 1.28 (1.08–1.53), respectively (Table 2).
Table 1
Basic characteristics according to hearing status (cross-sectional study)
Data are expressed as the mean ± standard deviation, median (interquartile range), or percentage.
BMI: body mass index; HOMA-IR: homeostatic model assessment for insulin resistance; SBP: systolic blood pressure; LDL-C: low-density lipoprotein cholesterol; hsCRP: high-sensitivity C-reactive protein.
a≥ 30 g/day for males, ≥ 20 g/day for females; b≥ Three times/week; c≥ College graduate; dTotal monthly household income ≥ 6 million Korean Republic won/month; eBMI ≥ 25 kg/m2; fIf working hours are not between 6 AM and 6 PM; ghsCRP > 3 mg/L; hp-value by χ2 test or t-test.
Table 2
Risk of increased hsCRP according to hearing status (cross-sectional study)
Bold indicates statistically significant results.
hsCRP: high-sensitivity C-reactive protein; OR: odds ratio; CI: confidence interval; BMI: body mass index; HOMA-IR: homeostatic model assessment for insulin resistance; SBP: systolic blood pressure; LDL-C: low-density lipoprotein cholesterol.
aEstimated from logistic regression models; bModel 1 was adjusted for age and sex; cModel 2: model 1 plus an adjustment for smoking status, alcohol intake, exercise, education level, total household income, marital status, BMI, HOMA-IR, SBP, glucose, and LDL-C; dModel 3: model 2 plus an adjustment for weekly working hours and shift work.
In the longitudinal study, the mean age of the participants was 36.2 years at baseline (SD: 7.4), and 63.5% were male. There were significant differences in age, sex, alcohol intake, smoking status, exercise status, educational level, household income, marital status, BMI, HOMA-IR, SBP, glucose level, LDL-C level, working hours, and work schedule between the HL and non-HL groups (Table 3). During follow-up, the hsCRP levels increased in 11,321 participants. Classified by hearing status, hsCRP levels increased in 272 of the 2,349 participants with HL and 11,049 of the 116,301 participants without HL. According to the GEEs model, the HL group had a higher risk of increased hsCRP levels than the non-HL group. However, the results that were statistically significant in the crude model were not significant after adjusting for the covariates. Compared to the non-HL group, the ORs (95% CI) of the crude model, model 1, model 2, and model 3 for increased hsCRP in the HL groups were 1.24 (1.11–1.40), 1.08 (0.96–1.21), 1.05 (0.92–1.19), and 1.05 (0.92–1.19), respectively. However, after stratification into two groups based on age, significant results were found in those over 40 years. The ORs (95% CI) of the crude model, models 1, 2, and 3 for increased hsCRP in the HL groups under 40 were 1.33 (1.12–1.58), 1.28 (1.08–1.52), 1.12 (0.92–1.36), and 1.10 (0.90–1.35), respectively. For the HL groups over 40, the ORs (95% CI) of the crude model, models 1, model 2, and model 3 were 1.25 (1.07–1.46), 1.20 (1.02–1.40), 1.19 (1.01–1.42), and 1.20 (1.01–1.43), respectively (Table 4).
Table 3
Basic characteristics according to hearing status (longitudinal study)
Data are expressed as the mean ± standard deviation, median (interquartile range), or percentage.
BMI, body mass index; HOMA-IR, homeostatic model assessment for insulin resistance; SBP, systolic blood pressure; LDL-C, low-density lipoprotein cholesterol.
a≥ 30 g/day for males, ≥ 20 g/day for females; b≥ Three times/week; c≥ College graduate; dTotal monthly household income ≥ 6 million Korean Republic won/month; eBMI ≥ 25 kg/m2; fIf working hours are not between 6 AM and 6 PM; gp-value by χ2 test or t-test.
Table 4
Risk of increased hsCRP according to hearing status (longitudinal study)
Bold indicates statistically significant results.
hsCRP: high-sensitivity C-reactive protein; OR: odds ratio; CI: confidence interval; BMI: body mass index; HOMA-IR: homeostatic model assessment for insulin resistance; SBP: systolic blood pressure; LDL-C: low-density lipoprotein cholesterol.
aEstimated from the generalized estimating equation model; bModel 1 was adjusted for age and sex; cModel 2: model 1 plus an adjustment for smoking status, alcohol intake, exercise, education level, total household income, marital status, BMI, HOMA-IR, SBP, glucose, and LDL-C; dModel 3: model 2 plus an adjustment for weekly working hours and shift work.
DISCUSSION
This large-scale cross-sectional and longitudinal study compared the incidence of increased hsCRP levels of workers classified according to their hearing status. We confirmed a significant association of increased hsCRP levels in individuals with HL. Even after adjusting for covariates that influence hsCRP, HL was associated with increased hsCRP levels in those aged > 40 years. In our study, increased hsCRP levels during the follow-up period were defined as hsCRP > 3 mg/L, which is a high-risk criterion for CVD based on the American Heart Association and Centers for Disease Control and Prevention.23 It suggests that individuals aged > 40 years with HL may have an increased risk of CVD.
Previous studies investigated the association between HL and increased CRP levels. A cohort study of 63 patients with HL and a case-control study of 301 patient with HL found increased CRP levels in the HL group compared to the healthy group.24,25 Moreover, over the long term, they found that CRP levels increased in the non-recovery group, defined as having less than 50% hearing threshold recovery during follow-up. However, these results were not statistically significant. The sample sizes of these previous studies were relatively small compared our study. We followed 118,650 participants for an average of 7.0 years, and the sample size and observational years were sufficient compared to previous studies. As a result, it seems that the statistical association was reflected in the analysis results. In addition, these previous studies did not perform a stratified analysis by age, whereas our study compared the risk using a stratified analysis by age. In addition, these previous studies only investigated the specific causes of HL, such as sudden sensorineural HL, which is defined as a hearing threshold of 30 dB or greater within 72 hours period.26 In contrast, our study defined HL as a hearing threshold of at least 20 dB, a recent recommendation on criteria for mild hearing impairment by the World Health Organization,27 in both ears, without considering the time of occurrence of HL.
We considered the GEEs analysis to be the most suitable for the current study as it showed the correlation of dependent variables repeatedly measured in a subject. As a result, just as the cross-sectional study confirmed an association between HL and hsCRP, the longitudinal study using GEEs analysis confirmed a significant association between HL and hsCRP in subjects over the age of 40. Since blood concentrations of inflammatory mediators such as hsCRP may increase with age, along with underlying diseases such as hypertension and diabetes, we expected that hsCRP levels would remain low in subjects under the age of 40.
The mechanisms between HL and increased CRP are not yet fully understood. According to some studies, the occurrence of HL is associated with oxidative stress in cochlea.28,29 As oxidative stress increases, it can cause apoptosis in cochlea, followed progression of HL.29 In fact, levels of reactive oxygen species (ROS) increase in all tissues of the body by inflammation, ischemia, infection, mental stress, obesity, and aging.30,31 Also, The production of antioxidant enzymes is reduced with age, and the ability of antioxidants becomes less efficient, leading to chronic low-grade inflammation.32 Oxidative stress caused by increased ROS and reduced antioxidant enzymes leads to tissue damages.30 Tissue damages induce the production of cytokines and the increased plasma cytokines induce the production of CRP, an inflammatory reactant produced in the liver.16 Since oxidative stress is affected by various factors, there will be an individual difference in susceptibility to oxidative stress. Individuals who are susceptible to oxidative stress to the extent that their cochlea are damaged are more likely to cause tissue damage to other tissues due to oxidative stress as well, resulting in inflammation and an increase in CRP. Our study supports this mechanism by confirming a significant increase in CRP in patients with HL compared to those without HL. Moreover, our study showed that the association between HL and increased hsCRP levels were found to be significant in those over 40 years compared with those under 40 years, which corresponds to an increased risk of CVD in people over 40 years.33 It is also consistent with previous study suggesting that CVD is associated with the pathogenesis of HL through chronic inflammatory responses.34
The strength of our study was its large-scale subjects, simultaneous cross-sectional and longitudinal study design, and objectively and consistently measured key variables at both baseline and follow-up. Nevertheless, this study has a few limitations. First, when defining HL, frequencies greater than 2 kHz were excluded. However, a frequency below 2 kHz in the conversation range, which is important in everyday life, were sufficiently reflected. In addition, because we performed audiometry rather than self-reporting to collect data on hearing status, the objectivity of the data was ensured. Second, the causes of HL were not considered. The causes of HL can be broadly classified into sensorineural and conductive, and in detail, there are various causes, such as noise, drugs, trauma, aging, and chronic diseases.35 Considering the differences in pathogenesis, it is necessary to classify the causes of HL to compare risks in future study. Third, the participants of this study were relatively young (average age: 36.1 years old) and well-educated, making it difficult to generalize the results to the general population, especially the elderly. However, as our study participants were younger than those in other studies, the distribution of hsCRP levels, which is an independent variable, was less likely to be affected by risk factors such as cancer or metabolic diseases which are common in the elderly. Fourth, in all studies except for randomized controlled trials, there may be bias due to uncontrolled potential confounding factors such as non-measurable variables that naturally exist. Fifth, since there was no information on noise exposure of participants in our cohort data, we could not consider the increase in hsCRP level that noise stimulation may induce by mediating stress hormones.
CONCLUSIONS
To our knowledge, this was the first large-scale simultaneous cross-sectional and longitudinal study on the association between HL and increased hsCRP levels. Our study confirmed a high risk of increased hsCRP in those with HL over the age of 40. Considering that hsCRP is a predictor of CVD risk, this suggests that the risk of CVD may increase in those with HL over 40 years. In future studies, it will be necessary to examine the mechanism underlying increased hsCRP levels in patients with HL.
Abbreviations
BMI
body mass index
BP
blood pressure
CI
confidence interval
CRP
C-reactive protein
CVD
cardiovascular disease
GEE
generalized estimating equation
HL
hearing loss
HOMA-IR
homeostatic model assessment of insulin resistance
hsCRP
high-sensitivity C-reactive protein
IRB
Institutional Review Board
KRW
Korean Republic won
LDL-C
low-density lipoprotein cholesterol
OR
odds ratio
ROS
reactive oxygen species
SBP
systolic blood pressure
SD
standard deviation
-
Competing interests: The authors declare that they have no competing interests.
-
Authors contributions:
NOTES
- 1. Stevens G, Flaxman S, Brunskill E, Mascarenhas M, Mathers CD, Finucane M, et al. Global and regional hearing impairment prevalence: an analysis of 42 studies in 29 countries. Eur J Public Health 2013;23(1):146–152. 22197756.ArticlePubMed
- 2. GBD 2019 Hearing Loss Collaborators. Hearing loss prevalence and years lived with disability, 1990–2019: findings from the Global Burden of Disease Study 2019. Lancet 2021;397(10278):996–1009. 33714390.PubMedPMC
- 3. The Lancet. Hearing loss: an important global health concern. Lancet 2016;387(10036):2351. 27312288.ArticlePubMed
- 4. Loughrey DG, Kelly ME, Kelley GA, Brennan S, Lawlor BA. Association of age-related hearing loss with cognitive function, cognitive impairment, and dementia: a systematic review and meta-analysis. JAMA Otolaryngol Head Neck Surg 2018;144(2):115–126. 29222544.ArticlePubMedPMC
- 5. Mener DJ, Betz J, Genther DJ, Chen D, Lin FR. Hearing loss and depression in older adults. J Am Geriatr Soc 2013;61(9):1627–1629. 24028365.ArticlePubMedPMCPDF
- 6. Chen DS, Betz J, Yaffe K, Ayonayon HN, Kritchevsky S, Martin KR, et al. Association of hearing impairment with declines in physical functioning and the risk of disability in older adults. J Gerontol A Biol Sci Med Sci 2015;70(5):654–661. 25477427.ArticlePubMedPMC
- 7. Friedland DR, Cederberg C, Tarima S. Audiometric pattern as a predictor of cardiovascular status: development of a model for assessment of risk. Laryngoscope 2009;119(3):473–486. 19235737.ArticlePubMed
- 8. Lee W, Chang Y, Shin H, Ryu S. Hearing loss and risk of overall, injury-related, and cardiovascular mortality: the Kangbuk Samsung Health Study. J Clin Med 2020;9(5):1415. 32397655.ArticlePubMedPMC
- 9. Libby P. Inflammation and cardiovascular disease mechanisms. Am J Clin Nutr 2006;83(2):456S–460S. 16470012.ArticlePubMed
- 10. Kurabi A, Keithley EM, Housley GD, Ryan AF, Wong AC. Cellular mechanisms of noise-induced hearing loss. Hear Res 2017;349:129–137. 27916698.ArticlePubMedPMC
- 11. Fischer ME, Schubert CR, Nondahl DM, Dalton DS, Huang GH, Keating BJ, et al. Subclinical atherosclerosis and increased risk of hearing impairment. Atherosclerosis 2015;238(2):344–349. 25555266.ArticlePubMedPMC
- 12. Frosolini A, Franz L, Daloiso A, Lovato A, de Filippis C, Marioni G. Digging into the role of inflammatory biomarkers in sudden sensorineural hearing loss diagnosis and prognosis: a systematic review and meta-analysis. Medicina (Kaunas) 2022;58(7):963. 35888682.ArticlePubMedPMC
- 13. Göde S, Turhal G, Kaya İ, Mavili HI, Kirazlı T. Evaluation of procalcitonin and hs-CRP levels in sudden sensorineural hearing loss. J Int Adv Otol 2018;14(1):44–47. 28639554.ArticlePubMedPDF
- 14. Gupta S, Curhan SG, Curhan GC. Biomarkers of systemic inflammation and risk of incident hearing loss. Ear Hear 2019;40(4):981–989. 30399011.ArticlePubMedPMC
- 15. Banait T, Wanjari A, Danade V, Banait S, Jain J. Role of high-sensitivity C-reactive protein (hs-CRP) in non-communicable diseases: a review. Cureus 2022;14(10):e30225. 36381804.ArticlePubMedPMC
- 16. Pepys MB, Hirschfield GM. C-reactive protein: a critical update. J Clin Invest 2003;111(12):1805–1812. 12813013.ArticlePubMedPMC
- 17. Luan YY, Yao YM. The clinical significance and potential role of C-reactive protein in chronic inflammatory and neurodegenerative diseases. Front Immunol 2018;9:1302. 29951057.ArticlePubMedPMC
- 18. Ridker PM, Cushman M, Stampfer MJ, Tracy RP, Hennekens CH. Inflammation, aspirin, and the risk of cardiovascular disease in apparently healthy men. N Engl J Med 1997;336(14):973–979. 9077376.ArticlePubMed
- 19. Bassuk SS, Rifai N, Ridker PM. High-sensitivity C-reactive protein: clinical importance. Curr Probl Cardiol 2004;29(8):439–493. 15258556.ArticlePubMed
- 20. Ridker PM, Rifai N, Rose L, Buring JE, Cook NR. Comparison of C-reactive protein and low-density lipoprotein cholesterol levels in the prediction of first cardiovascular events. N Engl J Med 2002;347(20):1557–1565. 12432042.ArticlePubMed
- 21. Chang Y, Jung HS, Cho J, Zhang Y, Yun KE, Lazo M, et al. Metabolically healthy obesity and the development of nonalcoholic fatty liver disease. Am J Gastroenterol 2016;111(8):1133–1140. 27185080.ArticlePubMedPDF
- 22. Matthews DR, Hosker JP, Rudenski AS, Naylor BA, Treacher DF, Turner RC. Homeostasis model assessment: insulin resistance and beta-cell function from fasting plasma glucose and insulin concentrations in man. Diabetologia 1985;28(7):412–419. 3899825.ArticlePubMedPDF
- 23. Pearson TA, Mensah GA, Alexander RW, Anderson JL, Cannon RO 3rd, Criqui M, et al. Markers of inflammation and cardiovascular disease: application to clinical and public health practice: a statement for healthcare professionals from the Centers for Disease Control and Prevention and the American Heart Association. Circulation 2003;107(3):499–511. 12551878.ArticlePubMed
- 24. Guo Y, Liu J. The roles played by blood inflammatory parameters in sudden sensorineural hearing loss. Ear Nose Throat J 2021.ArticlePDF
- 25. Masuda M, Kanzaki S, Minami S, Kikuchi J, Kanzaki J, Sato H, et al. Correlations of inflammatory biomarkers with the onset and prognosis of idiopathic sudden sensorineural hearing loss. Otol Neurotol 2012;33(7):1142–1150. 22872174.ArticlePubMed
- 26. Mattox DE, Simmons FB. Natural history of sudden sensorineural hearing loss. Ann Otol Rhinol Laryngol 1977;86(4 Pt 1):463–480. 889223.ArticlePubMedPDF
- 27. Humes LE. The World Health Organization’s hearing-impairment grading system: an evaluation for unaided communication in age-related hearing loss. Int J Audiol 2019;58(1):12–20. 30318941.ArticlePubMedPMC
- 28. Fuentes-Santamaría V, Alvarado JC, Mellado S, Melgar-Rojas P, Gabaldón-Ull MC, Cabanes-Sanchis JJ, et al. Age-related inflammation and oxidative stress in the cochlea are exacerbated by long-term, short-duration noise stimulation. Front Aging Neurosci 2022;14:853320. 35450058.PubMedPMC
- 29. Tan WJT, Song L. Role of mitochondrial dysfunction and oxidative stress in sensorineural hearing loss. Hear Res 2023;434:108783. 37167889.ArticlePubMed
- 30. Pizzino G, Irrera N, Cucinotta M, Pallio G, Mannino F, Arcoraci V, et al. Oxidative stress: harms and benefits for human health. Oxid Med Cell Longev 2017;2017:8416763. 28819546.ArticlePubMedPMCPDF
- 31. Marseglia L, Manti S, D’Angelo G, Nicotera A, Parisi E, Di Rosa G, et al. Oxidative stress in obesity: a critical component in human diseases. Int J Mol Sci 2014;16(1):378–400. 25548896.ArticlePubMedPMC
- 32. Tan BL, Norhaizan ME, Liew WP, Sulaiman Rahman H. Antioxidant and oxidative stress: a mutual interplay in age-related diseases. Front Pharmacol 2018;9:1162. 30405405.ArticlePubMedPMC
- 33. Hajar R. Framingham contribution to cardiovascular disease. Heart Views 2016;17(2):78–81. 27512540.ArticlePubMedPMC
- 34. Watson N, Ding B, Zhu X, Frisina RD. Chronic inflammation - inflammaging - in the ageing cochlea: a novel target for future presbycusis therapy. Ageing Res Rev 2017;40:142–148. 29017893.ArticlePubMedPMC
- 35. Cunningham LL, Tucci DL. Hearing loss in adults. N Engl J Med 2017;377(25):2465–2473. 29262274.ArticlePubMedPMC
REFERENCES
REFERENCES
Figure & Data
REFERENCES
Citations
Citations to this article as recorded by 
- Associations Between Inflammation and Multisensory Impairment Among Older Adults
Willa D. Brenowitz, Christina R. Sheppler, Yue Leng, Kristine Yaffe
Journal of the American Geriatrics Society.2025; 73(9): 2846. CrossRef
 Cite
Cite- Figure
-
- Related articles
-
- Association between heavy metal exposure and high-sensitivity C-reactive protein in the elderly: Korea National Health and Nutrition Examination Survey (KNHANES) 2016–2017
- The impact of alcohol consumption on hearing loss in male workers with a focus on alcohol flushing reaction: the Kangbuk Samsung Cohort Study
Association between hearing loss and high-sensitivity C-reactive protein: the Kangbuk Samsung Cohort Study


Fig. 1 Flowchart of the study participants (cross-sectional study).hsCRP: high-sensitivity C-reactive protein.
Fig. 2 Flowchart of the study participants (longitudinal study).hsCRP: high-sensitivity C-reactive protein.
Fig. 1
Fig. 2
Association between hearing loss and high-sensitivity C-reactive protein: the Kangbuk Samsung Cohort Study
| Characteristics | Overall (n = 204,091) | Hearing status | ||
|---|---|---|---|---|
| Normal (n = 199,103) | Hearing loss (n = 4,988) | |||
| Sex (male) | 59.0 | 58.8 | 70.7 | < 0.001 |
| Age (years) | 35.6 ± 7.7 | 35.4 ± 7.4 | 46.5 ± 11.3 | < 0.001 |
| Age > 40 | 22.1 | 21.0 | 66.3 | < 0.001 |
| Current smoker | 20.2 | 20.0 | 26.5 | < 0.001 |
| Heavy alcohol intakea | 15.0 | 14.8 | 19.5 | < 0.001 |
| Regular exerciseb | 12.7 | 12.6 | 16.1 | < 0.001 |
| High education levelc | 82.1 | 82.6 | 63.4 | < 0.001 |
| High household incomed | 28.5 | 28.5 | 28.8 | < 0.001 |
| Marital status (married) | 70.0 | 69.6 | 84.6 | < 0.001 |
| BMI (kg/m2)e | 23.1 | 23.1 | 23.8 | < 0.001 |
| HOMA-IR | 1.22 (0.81–1.78) | 1.22 (0.81–1.78) | 1.18 (0.77–1.77) | < 0.001 |
| SBP (mmHg) | 106.8 ± 11.0 | 106.7 ± 11.0 | 109.9 ± 11.2 | < 0.001 |
| Glucose (mg/dL) | 92.4 ± 8.1 | 92.3 ± 8.1 | 95.0 ± 8.9 | < 0.001 |
| LDL-C (mg/dL) | 118.0 ± 29.9 | 117.7 ± 29.9 | 127.4 ± 31.0 | < 0.001 |
| Working hours (hours/week) | 40.7 ± 18.1 | 40.7 ± 18.0 | 40.6 ± 19.0 | < 0.001 |
| Shift workf | 12.8 | 12.8 | 9.6 | < 0.001 |
| hsCRP (mg/L) | 0.4 (0.2–0.8) | 0.4 (0.2–0.8) | 0.5 (0.3–1.0) | < 0.001 |
| hsCRPg | 5.2 | 5.2 | 6.3 | < 0.001 |
| Hearing status | OR (95% CI)a | ||||
|---|---|---|---|---|---|
| Unadjusted | Model 1b | Model 2c | Model 3d | ||
| Total | |||||
| Normal | 1.00 (reference) | 1.00 (reference) | 1.00 (reference) | 1.00 (reference) | |
| Hearing loss | 1.24 (1.10–1.39) | 1.25 (1.11–1.40) | 1.17 (1.02–1.34) | 1.17 (1.02–1.34) | |
| Age ≤ 40 | |||||
| Normal | 1.00 (reference) | 1.00 (reference) | 1.00 (reference) | 1.00 (reference) | |
| Hearing loss | 1.20 (0.98–1.46) | 1.15 (0.94–1.40) | 0.99 (0.80–1.22) | 0.99 (0.80–1.22) | |
| Age > 40 | |||||
| Normal | 1.00 (reference) | 1.00 (reference) | 1.00 (reference) | 1.00 (reference) | |
| Hearing loss | 1.33 (1.15–1.54) | 1.30 (1.13–1.51) | 1.28 (1.08–1.52) | 1.28 (1.08–1.53) | |
| Characteristics | Overall (n = 118,650) | Hearing status | ||
|---|---|---|---|---|
| Normal (n = 116,301) | Hearing loss (n = 2,349) | |||
| Sex (male) | 63.51 | 63.23 | 77.65 | < 0.001 |
| Age (years) | 36.2 ± 6.4 | 36.0 ± 6.3 | 42.3 ± 8.3 | < 0.001 |
| Age > 40 | 23.6 | 23.0 | 56.6 | < 0.001 |
| Current smoker | 21.05 | 20.89 | 29.12 | < 0.001 |
| Heavy alcohol intakea | 14.11 | 13.99 | 20.05 | < 0.001 |
| Regular exerciseb | 12.12 | 12.10 | 13.07 | 0.004 |
| High education levelc | 85.73 | 85.88 | 78.29 | < 0.001 |
| High household incomed | 29.80 | 29.72 | 33.80 | < 0.001 |
| Marital status (married) | 75.57 | 75.36 | 85.91 | < 0.001 |
| BMI (kg/m2)e | 23.1 | 23.1 | 23.9 | < 0.001 |
| HOMA-IR | 1.20 (0.80–1.74) | 1.20 (0.80–1.74) | 1.25 (0.84–1.85) | < 0.001 |
| SBP (mmHg) | 106.5 ± 10.9 | 106.4 ± 10.9 | 108.7 ± 10.8 | < 0.001 |
| Glucose (mg/dL) | 92.5 ± 7.9 | 92.4 ± 7.9 | 94.8 ± 8.6 | < 0.001 |
| LDL-C (mg/dL) | 117.5 ± 29.0 | 117.4 ± 29.0 | 124.1 ± 28.7 | < 0.001 |
| Working hours (hours/week) | 41.2 ± 18.5 | 41.4 ± 18.4 | 39.7 ± 19.2 | < 0.001 |
| Shift workf | 9.9 | 9.95 | 7.07 | < 0.001 |
| hsCRP (mg/L) | 0.4 (0.2–0.7) | 0.4 (0.2–0.7) | 0.5 (0.3–0.8) | < 0.001 |
| Hearing status | Incidence | OR (95% CI)a | ||||
|---|---|---|---|---|---|---|
| Unadjusted | Model 1b | Model 2c | Model 3d | |||
| Total (n = 118,650) | ||||||
| Normal (n = 116,301) | 11,049 (9.5%) | 1.00 (reference) | 1.00 (reference) | 1.00 (reference) | 1.00 (reference) | |
| Hearing loss (n = 2,349) | 272 (11.6%) | 1.24 (1.11–1.40) | 1.08 (0.96–1.21) | 1.05 (0.92–1.19) | 1.05 (0.92–1.19) | |
| Age ≤ 40 (n = 90,633) | ||||||
| Normal (n = 89,614) | 8,211 (9.2%) | 1.00 (reference) | 1.00 (reference) | 1.00 (reference) | 1.00 (reference) | |
| Hearing loss (n = 1,019) | 115 (11.3%) | 1.33 (1.12–1.58) | 1.28 (1.08–1.52) | 1.12 (0.92–1.36) | 1.10 (0.90–1.35) | |
| Age > 40 (n = 28,017) | ||||||
| Normal (n = 26,687) | 2,838 (10.6%) | 1.00 (reference) | 1.00 (reference) | 1.00 (reference) | 1.00 (reference) | |
| Hearing loss (n = 1,330) | 157 (11.8%) | 1.25 (1.07–1.46) | 1.20 (1.02–1.40) | 1.19 (1.01–1.42) | 1.20 (1.01–1.43) | |
Table 1 Basic characteristics according to hearing status (cross-sectional study)
Data are expressed as the mean ± standard deviation, median (interquartile range), or percentage.
BMI: body mass index; HOMA-IR: homeostatic model assessment for insulin resistance; SBP: systolic blood pressure; LDL-C: low-density lipoprotein cholesterol; hsCRP: high-sensitivity C-reactive protein.
a≥ 30 g/day for males, ≥ 20 g/day for females; b≥ Three times/week; c≥ College graduate; dTotal monthly household income ≥ 6 million Korean Republic won/month; eBMI ≥ 25 kg/m
Table 2 Risk of increased hsCRP according to hearing status (cross-sectional study)
Bold indicates statistically significant results.
hsCRP: high-sensitivity C-reactive protein; OR: odds ratio; CI: confidence interval; BMI: body mass index; HOMA-IR: homeostatic model assessment for insulin resistance; SBP: systolic blood pressure; LDL-C: low-density lipoprotein cholesterol.
aEstimated from logistic regression models; bModel 1 was adjusted for age and sex; cModel 2: model 1 plus an adjustment for smoking status, alcohol intake, exercise, education level, total household income, marital status, BMI, HOMA-IR, SBP, glucose, and LDL-C; dModel 3: model 2 plus an adjustment for weekly working hours and shift work.
Table 3 Basic characteristics according to hearing status (longitudinal study)
Data are expressed as the mean ± standard deviation, median (interquartile range), or percentage.
BMI, body mass index; HOMA-IR, homeostatic model assessment for insulin resistance; SBP, systolic blood pressure; LDL-C, low-density lipoprotein cholesterol.
a≥ 30 g/day for males, ≥ 20 g/day for females; b≥ Three times/week; c≥ College graduate; dTotal monthly household income ≥ 6 million Korean Republic won/month; eBMI ≥ 25 kg/m
Table 4 Risk of increased hsCRP according to hearing status (longitudinal study)
Bold indicates statistically significant results.
hsCRP: high-sensitivity C-reactive protein; OR: odds ratio; CI: confidence interval; BMI: body mass index; HOMA-IR: homeostatic model assessment for insulin resistance; SBP: systolic blood pressure; LDL-C: low-density lipoprotein cholesterol.
aEstimated from the generalized estimating equation model; bModel 1 was adjusted for age and sex; cModel 2: model 1 plus an adjustment for smoking status, alcohol intake, exercise, education level, total household income, marital status, BMI, HOMA-IR, SBP, glucose, and LDL-C; dModel 3: model 2 plus an adjustment for weekly working hours and shift work.

