
Articles
- Page Path
- HOME > Ann Occup Environ Med > Volume 35; 2023 > Article
- Original Article Development of algorithm for work intensity evaluation using excess overwork index of construction workers with real-time heart rate measurement device
-
Jae-young Park1
 , Jung Hwan Lee2, Mo-Yeol Kang1, Tae-Won Jang3, Hyoung-Ryoul Kim1, Se-Yeong Kim4, Jongin Lee1
 -
Annals of Occupational and Environmental Medicine 2023;35:e24.
DOI: https://doi.org/10.35371/aoem.2023.35.e24
Published online: July 19, 2023
1Department of Occupational and Environmental Medicine, Seoul St. Mary’s Hospital, College of Medicine, The Catholic University of Korea, Seoul, Korea.
2Department of Civil and Environmental Engineering, Hanyang University, Seoul, Korea.
3Department of Occupational and Environmental Medicine, Hanyang University Guri Hospital, College of Medicine, Hanyang University, Seoul, Korea.
4Department of Preventive and Occupational Medicine, School of Medicine, Pusan National University, University, Yangsan, Korea.
- Correspondence: Jongin Lee. Department of Occupational and Environmental Medicine, Seoul St. Mary’s Hospital, College of Medicine, The Catholic University of Korea, 222 Banpo-daero, Seocho-gu, Seoul 06591, Korea. leejongin.md@gmail.com
• Received: March 16, 2023 • Revised: June 8, 2023 • Accepted: June 8, 2023
Copyright © 2023 Korean Society of Occupational & Environmental Medicine
This is an Open Access article distributed under the terms of the Creative Commons Attribution Non-Commercial License (https://creativecommons.org/licenses/by-nc/4.0/) which permits unrestricted non-commercial use, distribution, and reproduction in any medium, provided the original work is properly cited.
Abstract
-
Background The construction workers are vulnerable to fatigue due to high physical workload. This study aimed to investigate the relationship between overwork and heart rate in construction workers and propose a scheme to prevent overwork in advance.
-
Methods We measured the heart rates of construction workers at a construction site of a residential and commercial complex in Seoul from August to October 2021 and develop an index that monitors overwork in real-time. A total of 66 Korean workers participated in the study, wearing real-time heart rate monitoring equipment. The relative heart rate (RHR) was calculated using the minimum and maximum heart rates, and the maximum acceptable working time (MAWT) was estimated using RHR to calculate the workload. The overwork index (OI) was defined as the cumulative workload evaluated with the MAWT. An appropriate scenario line (PSL) was set as an index that can be compared to the OI to evaluate the degree of overwork in real-time. The excess overwork index (EOI) was evaluated in real-time during work performance using the difference between the OI and the PSL. The EOI value was used to perform receiver operating characteristic (ROC) curve analysis to find the optimal cut-off value for classification of overwork state.
-
Results Of the 60 participants analyzed, 28 (46.7%) were classified as the overwork group based on their RHR. ROC curve analysis showed that the EOI was a good predictor of overwork, with an area under the curve of 0.824. The optimal cut-off values ranged from 21.8% to 24.0% depending on the method used to determine the cut-off point.
-
Conclusion The EOI showed promising results as a predictive tool to assess overwork in real-time using heart rate monitoring and calculation through MAWT. Further research is needed to assess physical workload accurately and determine cut-off values across industries.
BACKGROUND
Construction workers are particularly susceptible to health risks due to factors such as dust, noise, and high physical workload.1,2 Fatigue related to overwork in construction workers has been linked to accidents and injuries,3 cerebrovascular disease risk4 and chronic fatigue syndrome.5 To prevent these health effects, it is essential to assess physical workload in the workplace and manage workers appropriately. However, subjective questionnaires and interviews are inconvenient and prone to recall bias.6 Therefore, previous studies have utilized physiological metrics such as heart rate (HR), heart rate variability, skin temperature, electromyography, and jerk metrics to evaluate workload,7 as well as combinations of these indicators.8,9,10 Among these, HR measurement can be easily performed with a wristwatch-type device.11 Hwang et al.12,13 reported the results of a feasibility study on HR monitoring of construction workers using PPG sensor technology built into a wristband-type activity tracker. In particular, relative heart rate (RHR), which will be further discussed later in this paper, has been widely used to assess physical workload.14,15,16,17
Another approach to fatigue management is maximum acceptable working time (MAWT), which refers to the maximum time that an individual can perform tasks of a given intensity without fatigue, given their ability, such as cardiovascular function. If a worker works longer than the MAWT, there is a limit to the body's ability to supply the necessary oxygen for physical activity from work. In a 2002 study, Wu and Wang14 calculated biomarkers and MAWT for adult volunteers according to increased physical load. In their study, the boundary value of MAWT was determined using oxygen intake and RHR. In short, working at a high RHR gives less MAWT, meaning that more rest is needed. By using their equation, we can have a better estimation of cumulative workload by weighting RHR, rather than simply monitoring RHR. However, to the best of our knowledge, no previous study has developed a real-time fatigue monitoring system utilizing RHR and MAWT.
In this study, we will propose a scheme to predict overwork. First we will define an overwork index (OI) based on RHR and MAWT, which can be measured in real time. Using receiver operating characteristic (ROC) curve analysis, we will provide optimal cut-off values for overwork prediction. Since HR monitoring devices have not only recorded HR information in real time, but also used communication technologies such as Bluetooth and LTE to transmit information collected in real time to servers to immediately utilize it for early intervention in case of overwork (that is, break during work).
METHODS
From August to October 2021, we measured the working time HRs of construction workers at a residential and commercial complex construction site in Seoul. The study participants were limited to workers of Korean nationality. After an on-site safety training conducted from 6 a.m. to 7 a.m. every day, we explained the study to workers and recruited volunteers. Participants wore real-time HR monitoring equipment. After completing a preliminary questionnaire and obtaining informed consent, workers were provided with an explanation about the device. We used 5 to 10 units of the devices daily. Due to the fact that construction workers have no fixed number of people, those who worked in the morning changed daily. As a result, new research participants were recruited every day with the same protocol, resulting in several duplicate participants. In the case of duplicated study subjects, the last measured result was used as the main result to ensure compliance with the measurement.18. Results of the first measurement and all measurements with duplication were used for sensitivity analyses. In total, 66 workers participated in the study.
We measured the HR from the start of work to the end of work using Polar M430. We started measurements of HRs at 7 a.m. when they started working. After finishing work between 3 p.m. and 4 p.m., we collected devices and transferred the data to the researcher’s PC and saved it.
To calculate the RHR, we evaluated the minimum and maximum HRs. The HR measured together with blood pressure measurement was considered as the minimum HR after making the target worker rest before starting the measurement. For workers who had multiple measurements, the minimum value of the HR measured was selected. However, if this value was higher than the minimum HR during work, the 1st centile value of the HR measured during work was used as the minimum HR. This value could rule out erroneous measurements and provide a better estimation of the resting HR.
The maximum HR was calculated with [208 − 0.7 × (Age)],18,19,20 which has been widely used in the previous studies.13,21
The RHR was calculated using the following equation (1) using the minimum HR and the maximum HR:
However, in this study, instead of calculating the RHR using the average HR during work day, the RHR was evaluated in units of 1 second using the measured HR per second.
MAWT
According to a previous study by Wu and Wang14 that measured the MAWT for young adults, MAWT can be estimated using RHR with the following the equation (2):
The workload can be calculated as the reciprocal of MAWT multiplied by worked time (3).
The justification of this formula will be discussed later. The calculation of the workload might vary depending on the unit of evaluation time. As the time unit is divided finely, the amount of work calculated generally increases.
Definition of overwork
Previous studies have no agreement on the workload limit based on RHR for an 8-hour workday. For example, 24.5% for cyclists,14 30% for teachers, construction workers,17,22 1.5 MAWT, roughly corresponds to 33% of RHR, for Korean workers4 and construction workers,18 30%–40% for construction workers.13 For this study, we defined overwork as a workday in which RHR for workday is more than 30% following some of the previous studies.17,23 To develop an index that monitors overwork in real time, we define new concepts as follows. First, we evaluated the workload by evaluating the MAWT on a per-second basis and defined the OI as the cumulative workload evaluated with the MAWT (4).
We schematized indicators calculated based on the HR measured for each worker. An example is shown in Fig. 1. The purple graph is the RHR and the blue line represents the OI. To evaluate the degree of overwork in real time, an appropriate scenario line (PSL) was set as an index that can be compared to the OI. The PSL is a straight line that increases from 0 to 1 over 9 hours based on an 8-hour work and 1-hour break as a cumulative workload indicator (green straight line in Fig. 1). Using the difference between the OI (blue) and the PSL (green), the excess overwork index (EOI) was evaluated in real time during work performance (red line in Fig. 1).
Fig. 1

An example of real-time records of heart rate and indices to predict overwork during working time.
It is this EOI value that we performed ROC curve analysis to find the optimal cut-off value for classification of overwork state. Among many methods to calculate the optimal cut off value,24 we applied Youden index,25 Concordance Probability method26 and the closest to (0, 1) criteria, which had been widely used in the previous studies.
Statistical analysis
It was tested whether there were differences in covariates defined above between the overwork group and the non-overwork group. We used a chi-square test for nominal variables and a t-test for continuous variables. The statistical significance level was set at p-value < 0.05. All statistical analyses were performed using R version 4.2.2. For ROC curve analysis, R package ‘cutpointr’ was used.
Other variables
Participants recorded demographic variables such as age, gender and job. They also recorded variables that could affect HR in self-report format, including subjective work intensity and amount of smoking and coffee intake of the day. Measurements were made from August to October, which included the hottest period in Korea. We evaluated the degree of heat wave by date by heat index and recorded it in conjunction with the measurement date.27 We interviewed three experienced experts related to the construction industry and divided the intensity of the job. Management, electricity work and the operation of tower crane were evaluated as jobs with low work strength. Other jobs were evaluated to have high work strength.
Ethics statement
The present study protocol was exempted from review by the Institutional Review Board of the Catholic University College of Medicine (approval no. KC21OISI0501). Informed consent was obtained from all participants of the study.
Out of the 66 participants, six were excluded from the analysis due to errors in the device or incomplete measurements of HR. The remaining 60 participants were analyzed according to the method described in the methods section, where a workday RHR exceeding 30% was defined as overworked. Among the participants, 28 were classified as overworked, accounting for 46.7% of the total.
There were no significant differences between the overwork and non-overwork groups in terms of age, workload classification by job, subject feeling of work intensity, and number of coffee cups or cigarettes consumed during the workday, which could affect HR. However, the overwork group had a higher ratio of extreme caution for the heat index on the workday, and they consumed more coffee and cigarettes on average. Age also showed a nonsignificant difference, with a relatively higher proportion of individuals aged 60 or older in the overwork group (Table 1).
Table 1
Demographic characteristics of study population divided by overwork with assessment using last measurements of heart rate
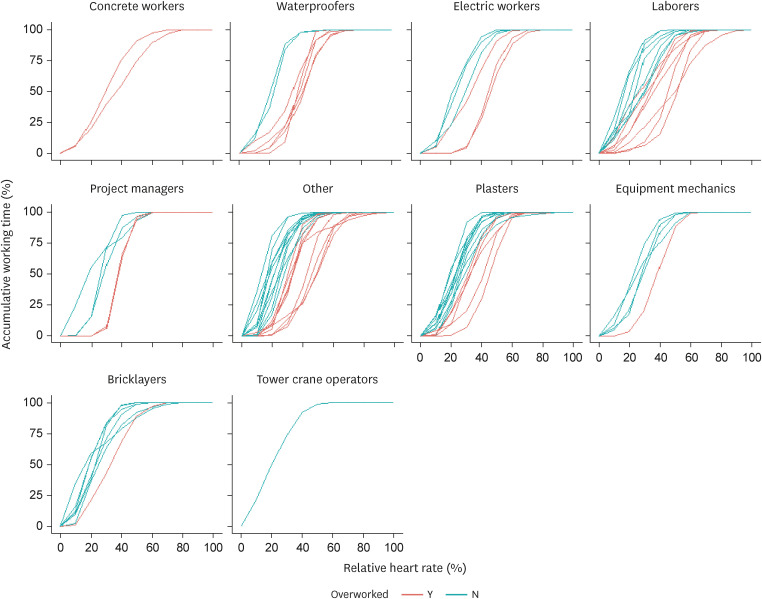
Table 2 summarizes the HR measurements of construction workers by job classification. The mean RHR was lowest for Tower crane operators, and highest for concrete workers, waterproofers, and electric workers. Fig. 2 illustrates the accumulative working time spent for a given RHR interval by job classification, sorted by the order of RHR. The S-shaped curve shifts rightward when the subject works longer on a higher RHR, indicating a greater physical workload. Fig. 3 shows the same data for normal weather, excluding data obtained during caution or extreme caution heat index conditions.
Table 2
Overview of HR measurements of construction workers by Job
Fig. 2

Workload patterns of relative heart rate with the cumulative time of construction workers by job including duplicated cases.
Fig. 3
Workload patterns of relative heart rate with the cumulative time of construction workers by job including duplicated cases in normal weather condition only.
The overwork and non-overwork groups showed clear differences in HR and overwork indicators. The average OI value of the overwork group was significantly higher than that of the non-overwork group (2.3 vs. 1.1, p-value < 0.001). The average maximum HR was also significantly higher in the overwork group than in the non-overwork group (142 bpm vs. 128 bpm, p-value < 0.001). However, the average minimum HR showed no significant difference between the two groups (60.2 bpm vs. 63.5 bpm, p-value = 0.261, Table 3). This trend was observed not only in the analysis based on the last measurement but also in the first measurement (n = 60) and all measurements (n = 180) (Supplementary Tables 1 and 2).
Table 3
Overwork index and heart rates of study population divided by overwork with assessment using last measurements of heart rate
To determine the cut-off value for classifying overwork when the EOI increased above a specific value, we plotted the ROC curve, and the area under the curve (AUC) was 0.824 (Supplementary Fig. 1). The distribution of the predictor, EOI, was also plotted (Supplementary Fig. 2). Table 4 presents optimal cut-off values, accuracy, sensitivity, and specificity for each data source and method used to determine optimal cut-off points. When last measurements were used as a data source, the optimal cut-off points of the EOI were 24.0% for Youden index, 24.0% for Concordance probability method, and 21.8% for the closest to (0.1) criteria. All three models showed similar tendencies in AUC, accuracy, sensitivity, and specificity.
Table 4
Relevance indices of models by heart rate resources to predict overwork
DISCUSSION
Construction workers often have high physical workloads, especially in hot and humid environments, which can lead to overwork. Early-warning systems have been proposed in previous studies to prevent overwork.8,9 In this study, we propose a scheme to assess overwork and provide advance warning based solely on HR, which can be measured using a wrist-type device during work with minimal inconvenience. This approach requires little health information about the worker in advance, making it useful in situations where many workers are temporary.
Our study demonstrates that the EOI can be used as a predictive tool to assess overwork in real-time, based on HR monitoring and calculation through the MAWT. By monitoring EOI instead of real-time HR, the workload can be estimated more accurately by weighting high RHRs. Our study found that the EOI value cut-off ranged from 15.4% to 29.3%, depending on the method used to find the optimal cut-off value.
Overall, our scheme based on HR monitoring and MAWT calculation could enable real-time monitoring of physical workload and help prevent overwork before it occurs in construction workers.
In our basic analysis comparing overwork and non-overwork groups, we did not observe significant differences in age, heat index, smoking, and coffee intake, which are known to potentially affect HR. Previous studies have shown that age18 and hot weather conditions28 are associated with higher RHR. Smoking is also known to increase the resting heart rate (ResHR),29 while nicotine intake can cause a rapid increase in HR within 15 minutes.30
Therefore, the high ResHR recorded in smokers could complicate the interpretation of our EOI estimation, depending on the correlation between RHR, MAWT, and EOI. However, we could not exclude participants who smoked because smoking is prevalent among construction industry workers.
Similarly, the effect of coffee intake on HR is difficult to interpret. Acute coffee intake has little impact on HR,31 while habitual coffee intake might lower HR.32 The overwork group in our study may have had more breaks during work, leading to more coffee intake. We also did not observe significant differences in the subjective feeling of work intensity and workload classification by job. Previous studies have questioned the reliability of self-reported work intensity due to recall bias.6 We also note that hot weather conditions may have affected our results, as taking more breaks in hot weather could have decreased the subjective feeling of work intensity.
Disease and medication can change HR. One limitation of this study was that it did not investigate angina, arrhythmia, or thyroid dysfunction. However, the prevalence of these conditions is not expected to be high in our study population, which is characterized by high labor intensity. Additionally, the study included some participants who were taking antihypertensive medications. A sub-analysis comparing the average daily RHR and EOI values between participants who were taking antihypertensive medications and those who were not found that the latter group had higher values for both. However, this difference was not statistically significant.
Table 2 presents HR measurements by job classification. Overall, our RHR levels are higher than in previous studies,18 similar to some13,33 and lower than others.21 In our study, operators showed the lowest mean RHR, consistent with a previous study.33 However, bricklayers and carpenters did not exhibit high RHR, unlike in a previous study.18 Among jobs with low work strength, management and electrical work (excluding tower crane operators) showed high RHR. We note that this may be due to weather conditions, as the data for overwork cases in management and electrical work were mostly obtained during caution or extreme caution heat index levels, as shown in Figs. 2 and 3.
The study conducted by Wu and Wang14 focused on young adults in their 20s and 30s and aimed to determine MAWT. Other studies have also verified MAWT using the same theory on healthy adults aged 20-35 without any history of hypertension, heart surgery, cardiovascular, or respiratory diseases.34,35 However, the subjects used in Wu and Wnag’s study14 for calculating MAWT were different from actual construction workers, as revealed by the Korea Safety and Health Agency’s (KOSHA) 2019 general health examination results; the proportion of workers in the construction industry was 8.9% for those under 30, 17.9% for those in their 30s, 25.1% for those in their 40s, 32.6% for those in their 50s, and 15.4% for those in their 60s or older. The number of patients with disease was 95,814 (22.4%). The number of patients with suspected hypertension and diabetes was 59,102 (13.8%). That is, it seemed that subjects of this study used for the calculation of MAWT were different from actual construction workers. Moreover, Wu and Wang14 used a bicycle to determine the RHR and MAWT curve, which might not reflect the relationship between RHR and MAWT for construction workers. Thus, additional physiological studies are necessary to understand this relationship better.
Several studies have reported different formulas for estimating maximum HR, and the commonly used [220 − (Age)] formula lacks scientific rigor.19 In our study, we used [208 − 0.7 × (Age)]20 following previous studies on construction workers13,21 but there are studies33 using [206 − 0.7 × (Age)],36 too. Moreover, the formula we used has a better fit for the Korean population 37 than the [220 − (Age)] formula.
When calculating the RHR, it is necessary to determine the resting HR. In our study, we measured ResHR daily before work. Since we could not control the workplace for enough resting, some measurements of ResHR during the workday were higher than the actual minimum HR. In these cases, we used the 1st centile value of the HR measured during work as the minimum HR. A similar approach was taken by a previous study33 while other previous studies used a single measurement13 or an estimation formula.18,38,39 However, since the HR is lower at night than during the day,40 and we only measured HRs during the day, there is a possibility that the minimum HR was overestimated, leading to an overestimation of MAWT.
It is important to note that the change in ResHR itself can act as a cardiovascular risk factor. For example, in patients with heart failure, lowering the HR has been shown to prevent cardiovascular events.41 On the other hand, too low ResHR can act as a risk factor for atrial fibrillation.42 In our study, we only focused on the calculation of RHR and used the minimum HR measured during work as ResHR. This approach has limitations since ResHR itself has an effect on cardiovascular risk. Therefore, it is necessary to establish a model that can simultaneously track changes in both RHR and ResHR to evaluate the risk of cardiovascular events.
We utilized the Polar M430 model as a measurement tool to accurately record HRs per second. There are several validation studies that support its reliability for measurements.43,44 However, as the device lacks a communication function and data analysis can only be done when stored on a device and connected to a PC, the EOI cut-off point proposed in this study cannot be implemented using this device. Recently, HR studies using Fitbit have reported the same level of validation as the Polar model.45 As HR data can be transmitted to the server in real-time via Bluetooth-connected LTE devices, it is possible to apply the management plan proposed in this study using EOI with Fitbit or other devices that support real-time telecommunication.
Our research results indicate that HR monitoring can be used for health care management at construction sites. The management plan can be implemented in both short-term and long-term approaches. In the short-term, measures can be taken to prevent acute diseases by monitoring rapid HR drops. In the long-term, we suggest continuous evaluation of work suitability through rigorous RHR evaluations, periodic health checkups to detect abnormalities, and improvement of workers’ cardiovascular functions through aerobic exercise, smoking cessation, and weight control.
Compared to previous classical methods that rely on yearly health checkups, our approach has the advantage of real-time monitoring to control workload and enable intervention by field managers at the appropriate time. In particular, it can increase work efficiency and ensure worker safety by identifying appropriate rest times during hot seasons. Overall, our management plan offers a useful approach to promoting health and safety at construction sites.
CONCLUSIONS
In conclusion, the EOI showed promising results as a predictive tool to assess overwork in real-time using HR monitoring and calculation through MAWT. The EOI value cut-off in our study ranged from 15.4% to 29.3%, which could be used by field managers to monitor physical workload and prevent overwork. However, since HR is influenced by various factors, including weather condition, smoking, coffee intake, stress, and anxiety,46 further research is needed to assess physical workload accurately and determine cut-off values across industries. Nevertheless, the proposed scheme based on RHR and MAWT provides a feasible approach to monitor physical workload and prevent overwork, contributing to the well-being and safety of workers.
ACKNOWLEDGEMENTS
The authors thank Ji-Woong Han, a student of Yonsei University, who collected data every day during the study period. Resident physicians of Department of Occupational and Environmental Medicine in Seoul St. Mary’s Hospital cleaned the data. We collected data from a construction site of YOUNGSHINE corporation. We thank to them for their full support. Seoul Institute of Technology funded and supported this study.
Abbreviations
AUC
area under the curve
EOI
excess overwork index
HR
heart rate
MAWT
maximum acceptable working time
OI
overwork index
PSL
appropriate scenario line
ResHR
resting heart rate
RHR
relative heart rate
ROC
receiver operating characteristic
-
Funding: This study was funded by Seoul Institute of Technology in a part of the research project (2021-AA-003) entitled ‘Development of Construction Site Safety Management Platform Using Smart Personal Protective Equipment.’ Additional analysis was supported by Korea Medical Institute (KMI).
-
Competing interests: The authors declare that they have no competing interests.
-
Author Contributions:
Conceptualization: Lee J.
Data curation: Lee JH, Lee J.
Formal analysis: Park JY.
Funding acquisition: Kim HR, Lee J.
Investigation: Lee J.
Methodology: Park JY, Jang TW, Kim SY.
Project administration: Lee JH, Lee J.
Resources: Lee JH, Kim SY.
Supervision: Kang MY, Jang TW, Kim HR, Kim SY, Lee J.
Validation: Kang MY, Jang TW, Kim HR.
Visualization: Park JY.
Writing - original draft: Park JY.
Writing - review & editing: Kang MY, Jang TW, Kim HR, Kim SY, Lee J.
NOTES
SUPPLEMENTARY MATERIALS
Supplementary Table 1
Overwork index and heart rates of study population divided by overwork with assessment using first measurements of heart rate
Supplementary Table 2
Overwork index and heart rates of study population divided by overwork with assessment using all the measurements allowing duplication
Supplementary Fig. 1
ROC curve in a model predicting overwork with assessment using last measurements of heart rate. Area under curve is 0.82.
Supplementary Fig. 2
Distribution of excess overwork index by overwork class (Y = overwork, N = non-overwork) using last measurements of heart rate. Vertical lines are the optimal cut-off for The Closest to (0,1) Criteria.
- 1. Hartmann B, Fleischer AG. Physical load exposure at construction sites. Scand J Work Environ Health 2005;31(Suppl 2):88–95. 16363451.PubMed
- 2. Pinto A, Nunes IL, Ribeiro RA. Occupational risk assessment in construction industry–overview and reflection. Saf Sci 2011;49(5):616–624.Article
- 3. Adane MM, Gelaye KA, Beyera GK, Sharma HR, Yalew WW. Occupational injuries among building construction workers in Gondar City, Ethiopia. Occup Med Health Aff 2013;1(5):125.Article
- 4. Jang TW, Kim HR, Lee HE, Myong JP, Koo JW, Ye BJ, et al. Overwork and cerebrocardiovascular disease in Korean adult workers. J Occup Health 2015;57(1):51–57. 25410266.ArticlePubMedPDF
- 5. Watanabe Y, Evengard B, Kuratsune H, Jason LA, Natelson BH. Fatigue Science for Human Health. Berlin, Germany: Springer; 2008.
- 6. Kwak L, Proper KI, Hagströmer M, Sjöström M. The repeatability and validity of questionnaires assessing occupational physical activity--a systematic review. Scand J Work Environ Health 2011;37(1):6–29. 20802979.ArticlePubMed
- 7. Anwer S, Li H, Antwi-Afari MF, Umer W, Wong AY. Evaluation of physiological metrics as real-time measurement of physical fatigue in construction workers: state-of-the-art review. J Constr Eng Manage 2021;147(5):03121001.Article
- 8. Yi W, Chan AP, Wang X, Wang J. Development of an early-warning system for site work in hot and humid environments: a case study. Autom Construct 2016;62:101–113.Article
- 9. Anwer S, Li H, Antwi-Afari MF, Umer W, Wong AY. Cardiorespiratory and thermoregulatory parameters are good surrogates for measuring physical fatigue during a simulated construction task. Int J Environ Res Public Health 2020;17(15):5418. 32731366.ArticlePubMedPMC
- 10. Aryal A, Ghahramani A, Becerik-Gerber B. Monitoring fatigue in construction workers using physiological measurements. Autom Construct 2017;82:154–165.Article
- 11. Li KH, White FA, Tipoe T, Liu T, Wong MC, Jesuthasan A, et al. The current state of mobile phone apps for monitoring heart rate, heart rate variability, and atrial fibrillation: narrative review. JMIR Mhealth Uhealth 2019;7(2):e11606. 30767904.ArticlePubMedPMC
- 12. Hwang S, Seo J, Jebelli H, Lee S. Feasibility analysis of heart rate monitoring of construction workers using a photoplethysmography (PPG) sensor embedded in a wristband-type activity tracker. Autom Construct 2016;71:372–381.Article
- 13. Hwang S, Lee S. Wristband-type wearable health devices to measure construction workers’ physical demands. Autom Construct 2017;83:330–340.Article
- 14. Wu HC, Wang MJ. Relationship between maximum acceptable work time and physical workload. Ergonomics 2002;45(4):280–289. 12028725.ArticlePubMed
- 15. Ismaila SO, Oriolowo KT, Akanbi OG. Cardiovascular strain of sawmill workers in South-Western Nigeria. Int J Occup Saf Ergon 2013;19(4):607–611. 24321639.ArticlePubMed
- 16. Kirk PM, Sullman MJ. Heart rate strain in cable hauler choker setters in New Zealand logging operations. Appl Ergon 2001;32(4):389–398. 11461040.ArticlePubMed
- 17. Shimaoka M, Hiruta S, Ono Y, Nonaka H, Hjelm EW, Hagberg M. A comparative study of physical work load in Japanese and Swedish nursery school teachers. Eur J Appl Physiol Occup Physiol 1998;77(1-2):10–18. 9459515.ArticlePubMedPDF
- 18. Lunde LK, Koch M, Veiersted KB, Moen GH, Wærsted M, Knardahl S. Heavy physical work: cardiovascular load in male construction workers. Int J Environ Res Public Health 2016;13(4):356. 27023574.ArticlePubMedPMC
- 19. Robergs RA, Landwehr R. The surprising history of the "HRmax= 220-age" equation. J Exerc Physiol Online 2002;5(2):1–10.
- 20. Tanaka H, Monahan KD, Seals DR. Age-predicted maximal heart rate revisited. J Am Coll Cardiol 2001;37(1):153–156. 11153730.ArticlePubMed
- 21. Nwaogu JM, Chan AP. Work-related stress, psychophysiological strain, and recovery among on-site construction personnel. Autom Construct 2021;125:103629.Article
- 22. Adi TJW, Ratnawinanda LA. Construction worker fatigue prediction model based on system dynamic. MATEC Web Conf 2017;138:05004.Article
- 23. Ilmarinen J. Job design for the aged with regard to decline in their maximal aerobic capacity: part I—Guidelines for the practitioner. Int J Ind Ergon 1992;10(1-2):53–63.Article
- 24. Nahm FS. Receiver operating characteristic curve: overview and practical use for clinicians. Korean J Anesthesiol 2022;75(1):25–36. 35124947.ArticlePubMedPMCPDF
- 25. Youden WJ. Index for rating diagnostic tests. Cancer 1950;3(1):32–35. 15405679.ArticlePubMed
- 26. Liu X. Classification accuracy and cut point selection. Stat Med 2012;31(23):2676–2686. 22307964.ArticlePubMedPDF
- 27. Rothfusz LP. The Heat Index Equation (or, More Than You ever Wanted to Know about Heat Index),” Tech. Attachment, SR/SSD 90-23. Forth Worth, TX: Headquarters, NWS Southern Region; 1990.
- 28. Bates GP, Schneider J. Hydration status and physiological workload of UAE construction workers: a prospective longitudinal observational study. J Occup Med Toxicol 2008;3(1):21. 18799015.ArticlePubMedPMC
- 29. Linneberg A, Jacobsen RK, Skaaby T, Taylor AE, Fluharty ME, Jeppesen JL, et al. Effect of smoking on blood pressure and resting heart rate: a mendelian randomization meta-analysis in the CARTA consortium. Circ Cardiovasc Genet 2015;8(6):832–841. 26538566.PubMedPMC
- 30. Azar RR, Frangieh AH, Mroué J, Bassila L, Kasty M, Hage G, et al. Acute effects of waterpipe smoking on blood pressure and heart rate: a real-life trial. Inhal Toxicol 2016;28(8):339–342. 27109645.ArticlePubMed
- 31. Hara A, Ohide H, Miyagawa K, Takeuchi T, Nakatani Y, Yokoyama H, et al. Acute effects of caffeine on blood pressure and heart rate in habitual and non-habitual coffee consumers: a randomized, double-blind, placebo-controlled study. Iryo Yakugaku 2014;40(7):383–388.
- 32. Nohara-Shitama Y, Adachi H, Enomoto M, Fukami A, Nakamura S, Kono S, et al. Habitual coffee intake reduces all-cause mortality by decreasing heart rate. Heart Vessels 2019;34(11):1823–1829. 31062117.ArticlePubMedPDF
- 33. Chen WC, Tserng HP. Real-time individual workload management at tunnel worksite using wearable heart rate measurement devices. Autom Construct 2022;134:104051.Article
- 34. Afshari D, Moradi S, Ahmadi Angali K, Shirali GA. Estimation of heat stress and maximum acceptable work time based on physiological and environmental response in hot-dry climate: a case study in traditional bakers. Int J Occup Environ Med 2019;10(4):194–202. 31586384.ArticlePubMedPMCPDF
- 35. Ariza LE, Idrovo AJ. Physical workload and maximum acceptable work time among supermarket workers in Cali, Colombia. Rev Salud Publica (Bogota) 2005;7(2):145–156. 16149274.PubMed
- 36. Londeree BR, Moeschberger ML. Effect of age and other factors on maximal heart rate. Res Q Exerc Sport 1982;53(4):297–304.Article
- 37. Park JH, Jung HC, Jung YS, Song JK, Lee JM. Re-visiting maximal heart rate prediction using cross-validation in population aged 7–55 years. Int J Environ Res Public Health 2022;19(14):8509. 35886359.ArticlePubMedPMC
- 38. Coolbaugh CL, Raymond SC Jr, Hawkins DA. Feasibility of a dynamic web guidance approach for personalized physical activity prescription based on daily information from wearable technology. JMIR Res Protoc 2015;4(2):e67. 26043793.ArticlePubMedPMC
- 39. Russell A, Heneghan C, Venkatraman S. Investigation of an estimate of daily resting heart rate using a consumer wearable device. MedRxiv 2018 10 18 10.1101/19008771.Article
- 40. Nanchen D. Resting heart rate: what is normal? Heart 2018;104(13):1048–1049. 29382691.ArticlePubMed
- 41. Böhm M, Swedberg K, Komajda M, Borer JS, Ford I, Dubost-Brama A, et al. Heart rate as a risk factor in chronic heart failure (SHIFT): the association between heart rate and outcomes in a randomised placebo-controlled trial. Lancet 2010;376(9744):886–894. 20801495.ArticlePubMed
- 42. Morseth B, Graff-Iversen S, Jacobsen BK, Jørgensen L, Nyrnes A, Thelle DS, et al. Physical activity, resting heart rate, and atrial fibrillation: the Tromsø Study. Eur Heart J 2016;37(29):2307–2313. 26966149.ArticlePubMedPMC
- 43. Henriksen A, Grimsgaard S, Horsch A, Hartvigsen G, Hopstock L. Validity of the polar M430 activity monitor in free-living conditions: validation study. JMIR Form Res 2019;3(3):e14438. 31420958.ArticlePubMedPMC
- 44. Janicki GJ. The Accuracy of Heart Rate and Energy Expenditure Measurements Using the Polar M430 Watch. Clinical Exercise Physiology. La Crosse, WI: University of Wisconsin - La Crosse; 2020, 43.
- 45. Bai Y, Hibbing P, Mantis C, Welk GJ. Comparative evaluation of heart rate-based monitors: Apple Watch vs Fitbit Charge HR. J Sports Sci 2018;36(15):1734–1741. 29210326.ArticlePubMed
- 46. Abdelhamid TS, Everett JG. Physiological demands during construction work. J Constr Eng Manage 2002;128(5):427–437.Article
REFERENCES
REFERENCES
Figure & Data
REFERENCES
Citations
Citations to this article as recorded by 
- Development of productivity model of continuous miner operators working in hazardous underground mine environmental conditions
Siddhartha Roy, Devi Prasad Mishra, Hemant Agrawal, Ram Madhab Bhattacharjee
Measurement.2025; 239: 115516. CrossRef - Investigated Predictors of Construction Workers’ Ongoing Fatigue: Random Forest Approach
Soyeon Park, Byungdo Cheon, Hayoung Kim, Heejung Kim
Journal of Management in Engineering.2025;[Epub] CrossRef - Integrating posture‐hour constraints into construction scheduling to enhance workforce wellbeing
Kai Qi, Ming Lu
Computer-Aided Civil and Infrastructure Engineering.2025; 40(30): 6107. CrossRef - Impact of Resilience Engineering on Physical Symptoms of Construction Workers
Zhen Hu, Heng Zhong, Siyuan Li, Siyi Li, Yuzhong Shen, Changquan He, Zhizhou Xu
Buildings.2024; 14(12): 4056. CrossRef
 Cite
CiteDevelopment of algorithm for work intensity evaluation using excess overwork index of construction workers with real-time heart rate measurement device
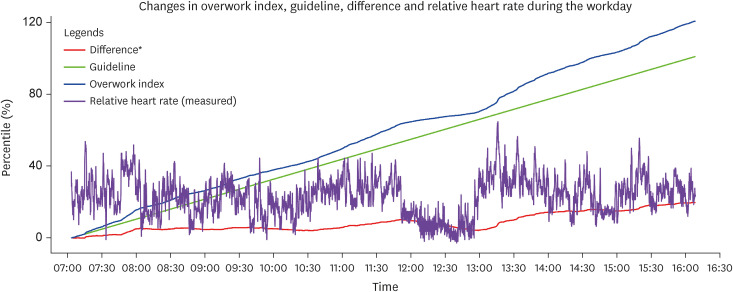
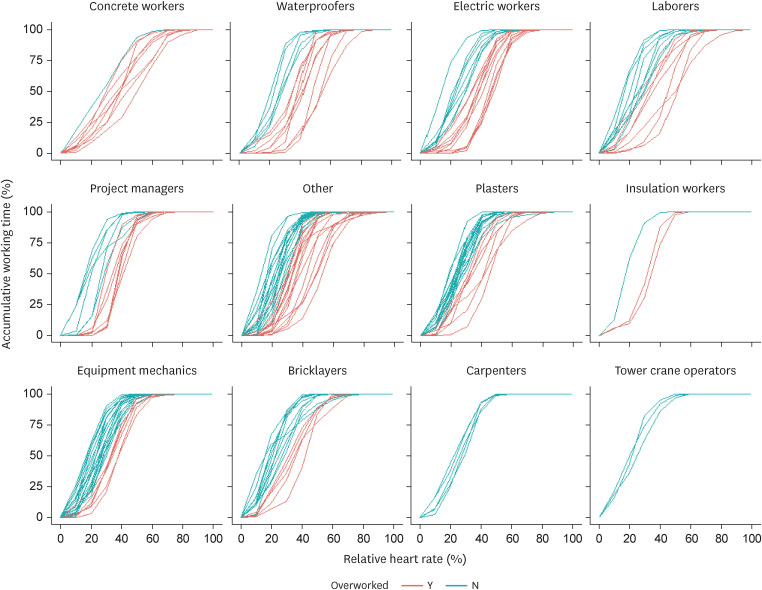

Fig. 1 An example of real-time records of heart rate and indices to predict overwork during working time.
Fig. 2 Workload patterns of relative heart rate with the cumulative time of construction workers by job including duplicated cases.
Fig. 3 Workload patterns of relative heart rate with the cumulative time of construction workers by job including duplicated cases in normal weather condition only.
Fig. 1
Fig. 2
Fig. 3
Development of algorithm for work intensity evaluation using excess overwork index of construction workers with real-time heart rate measurement device
| Variables | Non-overwork (n = 32) | Overworka (n = 28) | ||
|---|---|---|---|---|
| Sex | 0.156 | |||
| Male | 28 (87.5) | 28 (100) | ||
| Female | 4 (12.5) | 0 (0.0) | ||
| Age (years) | 0.062 | |||
| < 40 | 4 (12.5) | 5 (17.9) | ||
| ≥ 40 and < 50 | 7 (21.9) | 0 (0.0) | ||
| ≥ 50 and < 60 | 12 (37.5) | 11 (39.3) | ||
| ≥ 60 | 9 (28.1) | 12 (42.9) | ||
| Hypertension medication | 1.000 | |||
| Yes | 3 (9.4) | 3 (10.7) | ||
| No | 29 (90.6) | 25 (89.3) | ||
| Workload classification according to job | 0.783 | |||
| Low | 5 (15.6) | 3 (10.7) | ||
| High | 25 (15.6) | 25 (89.3) | ||
| No answer | 2 (6.3) | 0 (0) | ||
| Heat index of the workday | 0.055 | |||
| Normal | 19 (59.4) | 15 (53.6) | ||
| Caution | 9 (28.1) | 3 (10.7) | ||
| Extreme caution | 4 (12.5) | 10 (35.7) | ||
| Subjective feeling of work intensity | 0.235 | |||
| Affordable | 4 (12.5) | 8 (28.6) | ||
| Acceptable | 25 (78.1) | 16 (57.1) | ||
| Overburdened | 2 (6.3) | 2 (7.1) | ||
| No answer | 1 (3.1) | 2 (7.1) | ||
| Number of cigarettes in the workday | 0.157 | |||
| Mean ± SD | 6.2 ± 6.8 | 8.9 ± 7.2 | ||
| Median [Min, Max] | 4.5 [0, 20.0] | 10.0 [0, 25.0] | ||
| No answer | 2 (6.3) | 2 (7.1) | ||
| Number of coffee cups in the workday | 0.055 | |||
| Mean ± SD | 1.0 ± 1.2 | 1.9 ± 1.9 | ||
| Median [Min, Max] | 1.0 [0, 5.0] | 1.0 [0, 5.0] | ||
| No answer | 1 (3.1) | 2 (7.1) | ||
| Job | No. | Estimated resting HRa | Maximum HRa | Mean HRa | RHRa |
|---|---|---|---|---|---|
| Bricklayers | 16 | 59.2 (10.7) | 127.3 (15.4) | 86.7 (13.7) | 26.6 (6.9) |
| 52 [52,77] | 126.5 [106,156] | 82.5 [70.6,109.4] | 25.1 [17.5,40.7] | ||
| Carpenters | 5 | 77.6 (1.3) | 133.8 (2.2) | 103.1 (2) | 25.4 (2.2) |
| 77 [77,80] | 135 [130,135] | 103.9 [100.2,105] | 26.5 [22.8,27.5] | ||
| Concrete workers | 9 | 69.6 (10.7) | 145.8 (8) | 104.3 (10.4) | 36.9 (6.8) |
| 71 [50,85] | 146 [132,158] | 106 [87.4,117] | 36.6 [26.7,48.8] | ||
| Electric workers | 20 | 55.4 (12.9) | 142.2 (8.1) | 99.4 (6.8) | 33.7 (9.6) |
| 64 [37,65] | 142.5 [125,152] | 100.4 [82.2,109.6] | 34 [14.5,47.1] | ||
| Equipment mechanics | 26 | 65.0 (9.9) | 133.3 (7.2) | 93.7 (8.1) | 26.8 (5.6) |
| 61 [51,85] | 132.5 [120,147] | 91.8 [82.7,112.2] | 26.5 [17.5,38.2] | ||
| Insulation workers | 3 | 69 (17.3) | 134.3 (1.5) | 100.6 (4.2) | 27.1 (8) |
| 59 [59,89] | 134 [133,136] | 100 [96.8,105.1] | 30.3 [18,32.9] | ||
| Laborers | 15 | 70.3 (8.3) | 136.6 (13.2) | 100.5 (11.8) | 30.8 (10.2) |
| 66 [62,90] | 134 [113,163] | 99.1 [81.7,119.3] | 28.3 [16.6,50.1] | ||
| Plasters | 24 | 55.5 (9.7) | 131.2 (16.7) | 87.7 (9.8) | 27.7 (6.5) |
| 62 [42,66] | 127.5 [100,177] | 89.5 [69.3,101.7] | 26 [19.1,44.6] | ||
| Project managers | 13 | 54.3 (18.6) | 135.6 (9.4) | 95.2 (12.2) | 30.2 (8.7) |
| 70 [35,72] | 132 [126,155] | 94.1 [69.2,118] | 30.8 [16.3,41.3] | ||
| Tower crane operators | 3 | 49.0 (0) | 126.7 (3.5) | 78.8 (2.7) | 22.8 (2.1) |
| 49 [49,49] | 127 [123,130] | 77.3 [77.2,81.9] | 21.7 [21.6,25.2] | ||
| Waterproofers | 14 | 56.9 (4) | 130.1 (11.4) | 94.2 (11.5) | 35.8 (10.7) |
| 56 [53,65] | 131.5 [112,148] | 93 [75.8,113.4] | 35.9 [20.4,54.3] | ||
| Other | 32 | 58.8 (5.2) | 130.9 (18) | 90.9 (10.7) | 30.1 (9.5) |
| 57 [55,76] | 126.5 [108,190] | 90.1 [71.3,114.1] | 29.5 [13,52.1] |
| Variables | Non-overwork (n = 32) | Overworka (n = 28) | ||
|---|---|---|---|---|
| Overwork Index | < 0.001 | |||
| Mean ± SD | 1.1 ± 0.3 | 2.3 ± 0.9 | ||
| Median [Min, Max] | 1.1 [0.6, 1.6] | 2.0 [1.3, 4.8] | ||
| Maximal heart rate | < 0.001 | |||
| Mean ± SD | 128 ± 11.1 | 142 ± 9.9 | ||
| Median [Min, Max] | 132 [100, 150] | 141 [126, 166] | ||
| Minimal heart rate | 0.261 | |||
| Mean ± SD | 60.2 ± 12.0 | 63.5 ± 11.1 | ||
| Median [Min, Max] | 60.5 [36.0, 81.0] | 66.5 [35.0, 81.0] | ||
| Variables | Heart rate resource | |||
|---|---|---|---|---|
| Last records (n = 60) | First records (n = 60) | Full records (n = 180) | ||
| Youden index | ||||
| Optimal cut-off point | 24.0% | 29.3% | 26.5% | |
| Accuracy | 75.6% | 77.0% | 80.0% | |
| Sensitivity | 69.2% | 67.9% | 71.2% | |
| Specificity | 81.2% | 88.7% | 86.7% | |
| Concordance probability method | ||||
| Optimal cut-off point | 24.0% | 29.1% | 26.2% | |
| Accuracy | 75.6% | 77.0% | 80.0% | |
| Sensitivity | 69.2% | 68.0% | 71.4% | |
| Specificity | 81.2% | 88.6% | 86.4% | |
| The closest to (0,1) criteria | ||||
| Optimal cut-off point | 21.8% | 15.4% | 21.8% | |
| Accuracy | 75.2% | 77.5% | 78.5% | |
| Sensitivity | 70.7% | 79.3% | 74.8% | |
| Specificity | 79.2% | 75.2% | 81.3% | |
| AUC | 0.824 | 0.871 | 0.862 | |
Table 1 Demographic characteristics of study population divided by overwork with assessment using last measurements of heart rate
Values are presented as number (%) unless otherwise indicated.
aOverwork is defined as the average of relative heart rate during the workday exceeds 30%.
b
Table 2 Overview of HR measurements of construction workers by Job
HR: heart rate; RHR: relative heart rate.
aFor each variable, average (standard deviation), median [minimum, maximum] is shown.
Table 3 Overwork index and heart rates of study population divided by overwork with assessment using last measurements of heart rate
aOverwork is defined as the average of Relative heart rate during the workday exceeds 30%.
b
Table 4 Relevance indices of models by heart rate resources to predict overwork
AUC: area under the curve.

