
Articles
- Page Path
- HOME > Ann Occup Environ Med > Volume 35; 2023 > Article
- Original Article Organic solvent exposure for the chronic kidney disease: updated systematic review with meta-analysis
-
Chaeseong Lim1
 , Hyeoncheol Oh1,2
 -
Annals of Occupational and Environmental Medicine 2023;35:e11.
DOI: https://doi.org/10.35371/aoem.2023.35.e11
Published online: May 17, 2023
1Department of Occupational and Environmental Medicine, Kosin University Gospel Hospital, Busan, Korea.
2Department of Occupational and Environmental Medicine, Kosin University College of Medicine, Kosin University Gospel Hospital, Busan, Korea.
- Correspondence: Hyeoncheol Oh. Department of Occupational and Environmental Medicine, Kosin University Gospel Hospital and Kosin University College of Medicine, 262 Gamcheon-ro, Seo-gu, Busan 49267, Korea. jin-hc@hanmail.net
• Received: October 3, 2022 • Revised: March 16, 2023 • Accepted: April 17, 2023
Copyright © 2023 Korean Society of Occupational & Environmental Medicine
This is an Open Access article distributed under the terms of the Creative Commons Attribution Non-Commercial License (https://creativecommons.org/licenses/by-nc/4.0/) which permits unrestricted non-commercial use, distribution, and reproduction in any medium, provided the original work is properly cited.
Abstract
-
Background Studies on the relationship between organic solvent exposure and chronic kidney disease (CKD) have presented inconsistent results. Definition of CKD has changed in 2012, and other cohort studies have been newly published. Therefore, this study aimed to newly confirm the relationship between organic solvent exposure and CKD through an updated meta-analysis including additional studies.
-
Methods This systematic review was conducted in accordance with the Preferred Reporting Items for Systematic Reviews and Meta-Analysis (PRISMA) guidelines. The search was conducted on January 2, 2023 using Embase and MEDLINE databases. Case-control and cohort studies on the relationship between organic solvent exposure and CKD were included. Two authors independently reviewed full-text.
-
Results Of 5,109 studies identified, a total of 19 studies (control studies: 14 and cohort studies: 5) were finally included in our meta-analysis. The pooled risk of CKD in the organic solvent exposed group was 2.44 (1.72–3.47). The risk of a low-level exposure group was 1.07 (0.77–1.49). The total risk of a high-level exposure group was 2.44 (1.19–5.00). The risk of glomerulonephritis was 2.69 (1.18–6.11). The risk was 1.46 (1.29–1.64) for worsening of renal function. The pooled risk was 2.41 (1.57–3.70) in case-control studies and 2.51 (1.34–4.70) in cohort studies. The risk of subgroup classified as ‘good’ by the Newcastle Ottawa scale score was 1.93 (1.43–2.61).
-
Conclusions This study confirmed that the risk of CKD was significantly increased in workers exposed to mixed organic solvents. Further research is needed to determine the exact mechanisms and thresholds. Surveillance for kidney damage in the group exposed to high levels of organic solvents should be conducted.
-
Trial Registration PROSPERO Identifier: CRD42022306521
BACKGROUND
Organic solvents are substances widely used in many industrial sites, most of which are used in combination with harmful substances. They have deteriorating effects on the health of workers in industrial sites. The components of mixed organic solvents are solvents in which benzenes, ketones, alcohols, acetates, etc. are mixed, and the composition ratios contained in them differ depending on the purpose of use, so the effects on the human body are different and may act additively depending on the type.1 In particular, organic solvents are chemical compounds widely used in almost all workplaces, such as paint manufacturing, automobile manufacturing and painting, synthetic resin manufacturing, metal cleaning, apparel washing, chemical extraction, and degreasing in pharmaceuticals. These chemicals can melt other substances to maintain a uniformly dispersed solution. Representative composite organic solvents include toluene, n-hexane, and methyl isobutyl ketone (MIBK).
Exposure to these organic solvents can affect various body organs such as the nervous system, respiratory system, cardiovascular system, hematopoietic system, skin, and mucous membrane.2 In addition, studies have continuously published that organic solvents can affect the occurrence of chronic kidney disease (CKD), such as worsening of renal function, occurrence of proteinuria and glomerulonephritis (GN) since the 1970s.3,4,5,6,7
However, some studies have shown contradictory results.8,9 Ravnskov10 in 2000 conducted a meta-analysis by collecting case-control studies that investigated organic solvent exposure and chronic renal failure. However, the term of chronic renal failure has been changed to CKD. Its definition has been changed with more criteria added. Only decreased renal function was previously included following the 2012 guidelines of Kidney Disease Improvement Global Outcomes (KDIGO) since a meta-analysis was published.11 In addition, cohort studies based on a larger number of subjects with significant follow-up period for organic solvents and CKD have been recently published since the publication of the previous meta-analysis.
Therefore, this study aimed to newly confirm the relationship between organic solvent exposure and CKD by performing an updated meta-analysis including recent additional studies not included in the existing meta-analysis.
METHODS
This systematic review was conducted in accordance with the Preferred Reporting Items For Systematic Reviews and Meta-Analysis (PRISMA) guidelines.12 The protocol of this study was registered in the international prospective register of systematic reviews, PROSPERO (registration number: CRD42022306521).
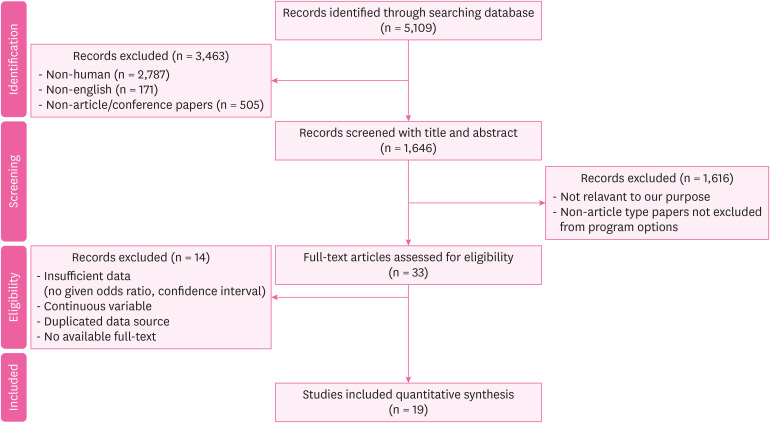
We included studies on the occurrence or deterioration of CKD due to exposure to organic solvents. Exposure to organic solvents was defined according to the definition in each paper. The definition of CKD included worsening of renal function (< 60 mL/min/1.73 m2) and proteinuria (albumin excretion rate ≥ 30 mg/24 hours; Albumin-to-creatinine ratio ≥ 30 mg/g [≥ 3 mg/mmol]) that lasted for more than three months, electrolyte abnormality, and other abnormalities due to tubular disorder, abnormalities detected by histology, structural abnormalities detected by imaging, and history of kidney transplantation in accordance with the KDIGO guidelines (Table 1).11 Therefore, the outcome of this study included not only decreased renal function, but also diseases such as GN (corresponding to proteinuria or histological abnormalities) and diabetic nephropathy (corresponding to proteinuria or histological abnormalities). We did not limit the date of publication. We included all time. Among studies that met the criteria, case-control studies and cohort studies were included. After primary search, we excluded non-human, non-English, and non-article (such as conference) papers. After reviewing title and abstract, we excluded papers irrelevant to our purpose. After reviewing full text, we also excluded papers with insufficient data (no information for odds ratio [OR] or confidence interval [CI]), those with continuous variables, those with duplicated data sources, and those without available full text (Fig. 1). Studies that were duplicated or did not meet the criteria were also excluded.
Table 1
Definition and criteria for CKD (KDIGO guideline11)
The search was conducted on January 2, 2023 using Embase and MEDLINE databases.
To conduct a systematic review, the search was conducted according to Population, Exposure, Comparator, and Outcomes (PECO) statement.13 Population was defined as the general population. Exposure was defined as exposure to organic solvents, which corresponded to a significant exposure defined in each paper. Comparator was defined as non-exposed to organic solvents, which was defined as not corresponding to a significant exposure defined in each paper. Outcome was defined as CKD in accordance with the 2012 KDIGO Guideline definition. MeSH terms related to organic solvents and CKD were considered first. To expand the search scope, a search strategy was established by adding related free words through discussions between authors. Search terms used are shown in the Appendix 1.
We searched and selected papers by agreement of search terms. Among searched papers, non-human article, non-English article, and non-article/conference papers were excluded with the automatic program of the database. Excluding those papers, we reviewed remaining papers by reading the abstract. Non-article type papers that were unsuitable or not previously excluded by the automatic program were additionally excluded.
After that, through a full text review of remaining documents, appropriate papers were finally selected by examining whether the risk of organic solvent exposure and CKD was accurately given, whether CIs were accurately given, and whether data sources were not duplicated. Two authors reviewed full texts independently. If there was a disagreement, authors discussed, and final selection was made by agreement.
In the screening phase, we extracted data including the title, abstract, journal, author name, year of publication, and type of publication. Additional information on research design, number of samples, effect measures, study period, World Health Organization region, exposure category, disease type, and so on were collected through full text evaluation. This process was done by the first author and checked by the corresponding author after primary collection process. If data were missing or insufficient, the corresponding author instructed additionally and the first author supplemented them.
The risk of bias was evaluated using the Newcastle-Ottawa scale.14 This scale is the most commonly used evaluation tool in observational studies. We decided that it would be suitable for evaluating the literature included in this study. According to this scale, the risk of bias was classified into the following three categories: ‘good,’ ‘fair,’ and ‘poor.’ The first author and corresponding author independently assessed the risk of bias of included studies and verified the quality of the evidence. If there was a disagreement in the assessment, it was resolved through discussion.
All effect estimates were integrated into ORs. If no OR was given, the OR was calculated directly using the raw data. All included papers were cases in which the effect estimate was an OR or the OR could be calculated directly using raw data. Thus, converting the relative risk or hazard ratio to OR was unnecessary. The 95% CI of each study was also reflected.
In addition to the overall risk for CKD, we also analyzed risks for subgroups according to the degree of exposure using papers classifying exposure degrees of solvents into low exposure, intermediate exposure, and high exposure. The exposure stage was in accordance with the definition in each paper. In addition, we performed subgroup analysis according to each disease group, research type, and studies that were evaluated as ‘good’ by the Newcastle-Ottawa Scale (NOS).
We used the Review Manager 5 (RevMan 5; Cochrane Collaboration, Chichester, UK) to draw a pooled risk calculation for selected papers and visualized it using a forest plot. In addition, classification of I2 statistics presented by Higgins et al.15 was used to evaluate heterogeneity of effect measurement. I2 value was also calculated through RevMan 5. I2 values of 25%, 50%, and 75% were defined as low, medium, and high heterogeneity, respectively. When heterogeneity exceeded 50%, a random effect was used as an effect estimate. Otherwise, a fixed effect was used.
The risk of publication bias was evaluated using the funnel plot in RevMan 5. In addition, Egger’s regression test and trim-and-fill analysis were additionally performed using Stata 13 software (StataCorp LP, College Station, TX, USA) to statistically analyze publication bias. Egger’s regression test is a method of statistically analyzing whether a funnel plot is asymmetric.16 The trim-and-fill analysis can estimate the corrected integrated effect size by virtually adding studies that are presumed to have been excluded due to publication bias.17
We used the Grading of Recommendations Assessment, Development and Evaluation (GRADE) approach to evaluate the reliability of risk estimation according to eight considerations and divided the reliability into high, moderate, low, and insufficient categories. These eight considerations were as follows: study limitation, directness, consistency, precision, reporting bias, dose-response association, plausible confounding that would decrease observed effect, and strength of association (magnitude of effect).17
RESULTS
Of 5,109 studies searched, a total of 1,646 papers were selected, excluding a total of 3,463 non-human articles, non-English articles, non-article types, and duplicated papers. We reviewed and selected 33 papers based on the title and abstract. By conducting a full-text review of these papers, a total of 19 studies (14 patient-control studies and 5 cohort studies) were finally included in our meta-analysis (Fig. 1). Of these 19 studies, 12 case-control studies3,4,5,8,18,19,20,21,22,23,24,25 were studies that were included in the previous meta-analysis performed by Ravnskov.10 Two case-control studies9,26 and 5 cohort studies7,27,28,29,30 were newly included after the revised definition of CKD. Characteristics of these included research studies are presented in Table 2.
Table 2
Characteristics of included studies that reported exposure to organic solvents
| Author(s) | Time of study | Study design | Data source | Number of samples | Exposure | Outcome |
|---|---|---|---|---|---|---|
| Zimmerman3 | 1975 | Case-control | Nephrology program of University of Wisconsin Center for Health Sciences, and Veterans’ Administration Hospital, Madison, Wisconsin 53706, USA | Case 63, Control 63 | Hydrocarbona | ESRD |
| Ravnskov et al.4 | 1979 | Case-control | Department of Nephrology in Lund, Sweden (otherwise, not specified) | Case 50, Control 100 | Organic solvents | GN |
| Finn et al.18 | 1980 | Case-control | Hospital inpatients (otherwise, not specified) | Case 89, Control 53 | Hydrocarbona | ESRD |
| van der Laan5 | 1980 | Case-control | Renal Pathology Department of the University of Amsterdam (otherwise, not specified) | Case 50, Control 50 | Organic solvents | GN |
| Harrison et al.19 | 1986 | Case-control | Patients who presented with membranous GN in the Edinburgh region over 20 years (otherwise, not specified) | Case 65, Control 1,746,530 | Organic solvents | GN |
| Harrington et al.8 | 1989 | Case-control | Referents: west midlands, community-based referents renal cancer case: drawn from names of all living patients with histologically proved renal adenocarcinoma (clear cell) diagnosed from May 1984 to April 1985 and recorded in the west midland’s regional cancer registry (contacted by post, participate after agreement) | Case 50, Control 50 | Organic solvents | GN, renal adenocarcinoma |
| GN case: patients attending for renal biopsy at the Queen Elizabeth Hospital, Birmingham | ||||||
| Steenland et al.20 | 1990 | Case-control | Edinburgh Renal Clinics (otherwise, not specified) | Case 325, Control 325 | Oragnic solvents | ESRD |
| Porro et al.21 | 1992 | Case-control | Case: clinical records of the Nephrology Department at the University of Bari | Case 60, Control 120 | Organic solvents | GN |
| Control: outpatients at the University of Bari | ||||||
| Yaqoob et al.22 | 1992 | Case-control | Case: Patients undergoing regular dialysis therapy between January 1988 and December 1989 and supervised by the Mersey Regional Renal Unit | Case 55 Control 55 | Hydrocarbona | ESRD |
| Control: normal controls attending a surgical day unit for minor surgical procedures | ||||||
| Yaqoob et al.26 | 1994 | Case-control | Patients with type 1 diabetes of over 10 years duration who regularly attended diabetic and renal clinics over a 6-month period were assessed. | Case 68, Control 45 | Hydrocarbona | Diabetic nephropathy |
| Stengel et al.23 | 1995 | Case-control | Cases were identified from the list of all patients whose GN was first diagnosed between January 1985 and December 1990 in Pathology Departments of 5 hospitals in Paris region. | Case 298, Control 298 | Organic solvents | GN |
| Nuyts et al.24 b | 1995 | Case-control | Cases were recruited from five renal units in three industrial areas (antwerp, Liege, and Turnhout). | Case 272, Control 272 | Copperb, Chromium, Tin, Mercury, Welding Fumes, Silicon, Grain dust, Hydrocarbona | Chronic renal failure (defined as a consistent calculated creatinine clearance under the third percentile of the normal distribution) |
| Controls were randomly selected from lists of voters in Antwerp, Turnhout, and Liege and in three rural communities (Brasschaat, Gierle, and Neupre) from the same catchment areas. | ||||||
| Asal et al.25 | 1996 | Case-control | cases were obtained from hospitals in metropolitan areas of Oklahoma City and Tulsa, Oklahoma. All major hospitals and nephrology clinics were contacted. Participating hospitals, nephrology clinics, and nephrologists were requested to provide a complete list of their patients whose diagnoses had an ICD code pertinent to chronic renal disease between January 1, 1985 and December 31, 1992. | Case 321, Control 321 | Hydrocarbona | GN |
| Fored et al.9 | 2004 | Case-control | The continuously updated Swedish National Population Register provided a well-defined study base of all 5.3 million native Swedes aged 18 to 74 years who were residents in the country during the ascertainment period (May 20, 1996 through May 31, 1998). | Case 913, Control 991 | Organic solvents | Chronic renal failure (men and women whose serum creatinine level exceeded 300 μmol/L (3.4 mg/dL) and 250 μmol/L (2.8 mg/dL)) |
| Ravnskov27 | 1986 | Cohort (prospective) | Department of Nephrology of the University Hospital Lund, Sweden (otherwise, not specified) | 71 | Hydrocarbona | Chronic renal failure (GFR < 80 mL/min) |
| Yaqoob et al.7 | 1993 | Cohort (retrospective) | Patients with biopsy-proven GN of duration > 1 year (proliferative, n = 60; membranous, n = 8) who regularly attended renal clinics over six months during 1989. | 68 | Hydrocarbona | Progressive renal failure (defined as persistent rise of serum creatinine > 50 μmol/L above the baseline) |
| Radican et al.28 | 2006 | Cohort (retrospective) | Data from 3 sources: a database of former civilian employees of the Hill Air Force Base in Utah, mortality data from the National Death Index (NDI), and ESRD incidence data from the U.S. Renal Data System (USRDS) database | 14,455 | Hydrocarbona | ESRD |
| Jacob et al.29 | 2007 | Cohort (retrospective) | GN-PROGRESS retrospective cohort study in 11 nephrology departments of the Paris region (see acknowledgments for a list of participating centers) | 338 | Organic solvents | ESRD |
| Jacob et al.30 | 2007 | Cohort (retrospective) | GN-PROGRESS retrospective cohort study. All new Caucasian adult patients with biopsy proven IgA nephropathy (IgAN), membranous nephropathy, and focal and segmental glomerulosclerosis diagnosed between January 1994 and June 2001 in 11 nephrology departments in the Paris area were invited to participate in the study between January 2002 and March 2004. | 269 | Organic solvents | ESRD |
ESRD: end-stage renal disease; GN: glomerulonephritis; ICD: International Statistical Classification of Diseases; GFR: glomerular filtration rate.
aAll papers with exposure defined as hydrocarbons included in this meta-analysis investigated hydrocarbons detected in petroleum-related products or paints, adhesives, degreasing agents, and diluents known to be occupationally exposed solvents.
bAmong several exposure factors, only hydrocarbon results were extracted and used for analysis.
Overall effect of organic solvents
We calculated the overall effect by analyzing the selected 19 papers. The I2 value was 87%, which was found to be heterogeneous. The effect estimate was adopted as a random effect. Accordingly, the pooled risk of developing CKD for the organic solvent exposed group was 2.44 (95% CI: 1.72–3.47, I2 = 87%) compared to the non-exposed group (Fig. 2).
Fig. 2
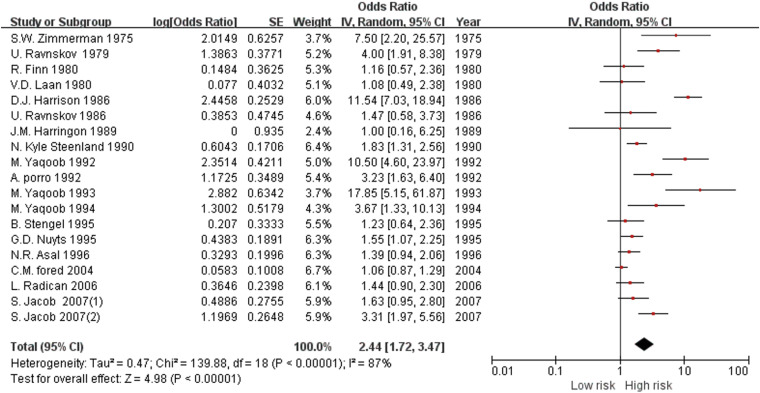
Forest plot of the overall risk of chronic kidney disease for exposure to organic solvents.
SE: standard error; IV: interval variable; CI: confidence interval.
Subgroup analysis according to exposure level
Results of subgroup analysis according to exposure levels are summarized in Table 3. We were able to calculate the risk according to the degree of exposure in a total of 6 studies.4,8,9,21,23,29 All these studies did not conduct a quantitative evaluation of organic solvent exposure. However, they all evaluated the exposure intensity qualitatively by examining occupational history, working conditions, and duration of employment by two or more industrial hygiene engineers. For the low-level exposure group, the risk of developing CKD was 1.07 (95% CI: 0.77–1.49, I2 = 1%). The total risk for the high-level exposure group was 2.44 (95% CI: 1.19–5.00, I2 = 73%).
Table 3
Subgroup analysis according to exposure level, disease category, study design, and quality of study
Subgroup analysis according to disease category
Results of subgroup analysis according to disease category are summarized in Table 3. The outcome of included studies could be largely classified into worsening of renal function (OR: 1.46, 95% CI: 1.29–1.64, I2 = 75%) and risk of GN (OR: 2.69, 95% CI: 1.18–6.11, I2 = 92%).
Subgroup analysis according to study design
Results of subgroup analysis according to the study type are summarized in Table 3. In case-control studies, 2.41 (95% CI: 1.57–3.70, I2 = 89%) was found and in cohort studies, 2.51 (95% CI: 1.34–4.70, I2 = 78%).
Subgroup analysis according to NOS score
Analysis results of subgroups according to NOS score are summarized in Table 3. For those with high NOS scores, the total risk was 1.93 (95% CI: 1.43–2.61, I2 = 78%). For those with fair/poor NOS scores, the total risk was 4.12 (95% CI: 3.09–5.51, I2 = 88%).
Eight case-control studies and four cohort studies were evaluated as ‘good’ according to the NOS score. Among case-control studies, 2 were evaluated as ‘fair.’ For the 4 patient control studies, 1 cohort study was evaluated as ‘poor.’ Detailed evaluation results of the bias risk are presented in Table 4.
Table 4
Quality assessment of studies included in the systematic review according to the Newcastle Ottawa Scale
| Study (cohort) | Year | Selection representativeness of the sample | Selection of the non-intervention cohort | Ascertainment of exposure | Demonstration that outcome of interest was not present at start of study | Comparability based on design and analysis | Outcome assessment of outcome | Was follow up long enough for outcomes to occur | Adequacy of follow up of cohorts | Total score | Assessment |
|---|---|---|---|---|---|---|---|---|---|---|---|
| Ravnskov27 | 1986 | 0 | 1 | 1 | 1 | 0 | 1 | 1 | 0 | 5 | Poor |
| Yaqoob et al.7 | 1993 | 0 | 1 | 1 | 1 | 2 | 1 | 1 | 1 | 8 | Good |
| Radican et al.28 | 2006 | 1 | 1 | 1 | 1 | 2 | 1 | 1 | 1 | 9 | Good |
| Jacob et al.29 | 2007 | 0 | 1 | 1 | 1 | 2 | 1 | 1 | 0 | 7 | Good |
| Jacob et al.30 | 2007 | 0 | 1 | 1 | 1 | 2 | 1 | 1 | 0 | 7 | Good |
| Study (case-control) | Selection is the case definition adequate? | Representativeness of cases | Selection of controls | Definition of controls | Comparability based on design and analysis | Outcome assessment of exposure | Same method of ascertainment for cases and controls | Non-response rate | Total score | Assessment | |
| Zimmerman3 | 1975 | 1 | 1 | 0 | 1 | 2 | 0 | 1 | 0 | 6 | Poor |
| Ravnskov et al.4 | 1979 | 1 | 1 | 0 | 1 | 2 | 1 | 1 | 0 | 7 | Good |
| Finn et al.18 | 1980 | 1 | 0 | 0 | 1 | 1 | 0 | 1 | 0 | 4 | Poor |
| van der Laan5 | 1980 | 1 | 1 | 0 | 0 | 2 | 0 | 1 | 0 | 5 | Poor |
| Harrison et al.19 | 1986 | 1 | 1 | 0 | 0 | 0 | 0 | 0 | 0 | 2 | Poor |
| Harrington et al.8 | 1989 | 1 | 1 | 1 | 1 | 2 | 1 | 1 | 0 | 8 | Good |
| Steenland et al.20 | 1990 | 1 | 1 | 1 | 1 | 2 | 1 | 1 | 0 | 8 | Good |
| Yaqoob et al.22 | 1992 | 1 | 0 | 0 | 1 | 2 | 1 | 1 | 0 | 6 | Fair |
| Porro et al.21 | 1992 | 1 | 1 | 0 | 1 | 2 | 1 | 1 | 0 | 7 | Good |
| Yaqoob et al.26 | 1994 | 1 | 0 | 0 | 1 | 2 | 1 | 1 | 0 | 6 | Fair |
| Stengel et al.23 | 1995 | 0 | 0 | 0 | 0 | 0 | 1 | 1 | 0 | 2 | Poor |
| Nuyts et al.24 | 1995 | 1 | 0 | 1 | 1 | 2 | 1 | 1 | 0 | 7 | Good |
| Asal et al.25 | 1996 | 1 | 1 | 1 | 0 | 2 | 1 | 1 | 0 | 7 | Good |
| Fored et al.9 | 2004 | 1 | 1 | 1 | 0 | 2 | 1 | 1 | 0 | 7 | Good |
A funnel plot was drawn for the total outcome of CKD risk (Fig. 3). It appeared to be asymmetrical, suggesting a publication bias. The result of the Egger’s regression test showed a p-value of 0.019. Similarly, the publishing bias was statistically significant. In addition, there was no change in the estimated result of the trim-and-fill analysis.
Fig. 3

Funnel plot for overall risk of chronic kidney disease according to organic solvent exposure.
SE: standard error; OR: odds ratio.
The strength of the evidence was evaluated through eight domains of the GRADE approach for major outcomes. As a result, the quality of evidence was low (Table 5).
Table 5
GRADE approach for the primary outcome
GRADE: Grading of Recommendations Assessment, Development and Evaluation; CKD: chronic kidney disease.
aAll included studies are observational, and the risk of bias in 5 included studies was evaluated as ‘Poor.’
bConsiderable heterogeneity (I2 = 87%).
cFunnel plot asymmetry, Egger’s regression test p = 0.019.
dOverall pooled risk = 2.44.
DISCUSSION
Our meta-analysis showed an overall OR of 2.44 (95% CI: 1.72–3.47). The group with a high-level exposure to organic solvents had a higher total risk than the low-level exposure group. Statistically significant results were only found for the group with high-level exposures, but not for the group with low-level exposures. The overall OR is 2.44 (95% CI: 1.72–3.47) and OR for group with high-level exposure was 2.44 (95% CI: 1.19–5.00) too. The OR for group with low-exposure was 1.07 (95% CI: 0.77–1.49). Because there was higher value of OR in the studies that do not include exposure level, so overall value of OR became same as that of high-exposure group.
In addition, the group with exposure to organic solvents showed a significant increase in the risk of GN as well as worsening of renal function. The increase in the risk of CKD due to exposure to organic solvents was significant when case-control groups were analyzed separately. The result was the same for cohort studies with long-term follow-up.
In some studies, the risk was calculated without adjusting for a confounder such as diabetes or high blood pressure. Considering this point, studies with a high risk of bias according to the NOS score were excluded. A subgroup analysis for studies evaluated as ‘good’ by the NOS score was performed separately. Similarly, results showed a significant increase in risk.
In conclusion, the risk for the CKD was higher for the group with high-level organic solvents exposure. There was a consistent risk for case-control studies and cohort studies and for studies with ‘good’ and ‘fair, poor’ scores by NOS. These results appear to increase the evidence level of our hypothesis that organic solvent exposure could increase the risk of CKD.
We felt the need to broaden the scope of outcomes according to the KDIGO guidelines which had changed after the publication of the previous paper by Ravnskov.10 At the time of publication of the paper by Ravnskov,10 chronic renal failure was only defined by glomerular filtration rate according to guidelines of the American Society of Nephrology.31 Accordingly, this paper also added studies on the occurrence of proteinuria (such as GN) and histological abnormality as an outcome. In addition, high-quality cohort studies based on sophisticated methodologies have been newly published since 2000. Thus, it was necessary to conduct a revised meta-analysis by adding these new cohort studies. Cohort studies are known to have higher hierarchy of evidence than case-control studies in evidence-based medicine32. Thus, we thought that it would be necessary to further analyze these cohort studies.
Previously, Ravnskov10 analyzed associations of exposure to organic solvents with acute and/or early chronic GN (defined as acute/chronic as diagnosed by biopsy), chronic renal failure (defined as renal function), and end-stage renal disease (ESRD) (defined as renal failure patient on hemodialysis) for workers. As a result, the pooled risk was 0.95 (95% CI: 0.6–1.4) for acute/early chronic GN, 3.1 (95% CI: 1.5–6.2) for chronic renal failure, and 5.9 (95% CI: 3.8–9.3) for ESRD. As such, there was no significant correlation of exposure to organic solvents with acute/early chronic GN in the previous study. However, exposure to organic solvents had a significant correlation with diagnosis of GN in our study, with a pooled risk of 2.69 (95% CI: 1.18–6.11). Results might be different because GN of our study included chronic stage and acute/early stage. As a result, GN might be significantly correlated to organic solvent exposure when targeting all stages. In addition, both the previous study and the present study showed a significant correlation of organic solvent exposure with worsening of renal function.
We found in our search that there were only a few studies regarding biological mechanisms for the occurrence of proteinuria and worsening of renal function caused by exposure to organic solvents. One animal study by Mutti et al.33 was found. In that study, albuminuria and urinary fibronectin were found in rats exposed to styrene and severe interstitial fibrosis was confirmed by renal biopsy. And Acute renal failure from acute tubular necrosis has been observed in workers with acute intoxication from halogenated hydrocarbons such as carbon tetrachloride.34 In the study of Franchini et al.,35 it was confirmed that proteinuria and enzymatic urine (muramidase and β-glucuronidase) were excreted in workers chronically exposed to various organic solvents or mixed organic solvents. It suggests that organic solvent exposure contributes to worsening of renal function and proteinuria through mechanisms such as tubulointerstitial damage.
Occupational exposure to organic solvents is generally more of a mixture than a single substance. Considering that organic solvents used in industry are generally mixtures, it is necessary to comprehensively consider the effects on the kidneys of these organic solvents.
Results of this study suggest that various occupational health management and surveillance is necessary along with warning for CKD in occupational groups who handle organic solvents. Especially, high-exposure group such as petroleum-related product handlers, painters, metal workers, and laboratory workers who are currently exposed to high-levels of mixed organic solvents and workers classified as a high-risk group as a result of occupational risk assessment in countries conducting occupational risk assessment, should be given periodic surveillance or regular health examination about kidney damage. Tests of surveillance or examination should include not only renal function test such as blood urea nitrogen and creatinine levels, but also urine proteins, and biologic exposure indices like urine hippuric acid, urine trichloroethylene for those who might be exposed to high levels of organic solvents. In addition, workplaces that meet these conditions require health management service such as workplace health education and periodic working environment measurement.
The funnel plot for the publication bias test and the Egger’s regression analysis proved that there was a publication bias. In addition, trim-and-fill analysis was conducted to predict the estimated overall effect size. There was no change in funnel picture. In conclusion, this study found a publication bias. Thus, effect measures of this study might be different from true values.
In some studies, exposure was defined as hydrocarbons, not organic solvents. Examples of organic solvents include hydrocarbon-based solvents such as benzene and toluene, halogenated hydrocarbons such as trichloroethylene, and alcohols such as isopropyl alcohol, aldehyde, ethers, and ketones. These substances have the property of dissolving oil and fat in common. All papers3,7,18,22,25,26,27,28 with exposure defined as hydrocarbons included in this meta-analysis investigated hydrocarbons detected in petroleum-related products or paints, adhesives, degreasing agents, and diluents known to be occupationally exposed solvents. These are all hydrocarbons used as industrial solvents. We concluded that hydrocarbon exposure was also included in organic solvent exposure. It confirmed to be the same classification in the previous meta-analysis paper published by Ravnskov.10
No study included in this paper evaluated exposure quantitatively. In the case of studies that analyzed some subgroups of exposure intensity, a survey was conducted on industrial hygienists on what solvent they were exposed to, what kind of work they were involved in, and their exposure period, which were then classified accordingly.4,8,9,21,23,29 Overall, these studies differed in the criteria for setting the exposure level. However, exposure intensity was qualitatively evaluated in a survey performed by industrial hygiene engineers in all these studies. And although each calculation formula was different, the exposure intensity was calculated based on the job group the subjects were engaged in, and the occupational group classification according to the exposure intensity was generally the same (i.e., painting was classified as high-level exposure), and the exposure intensity was calculated by multiplying exposure frequency and exposure period in all studies included (Table 6). Therefore, the authors judged that it would possible to conduct a subgroup analysis according to the exposure concentration by citing the results of high exposure and low exposure calculated in each paper. But, It is believed that research through quantitative evaluation is needed in the future.
Table 6
Definition of high vs. low exposure in each studies
| Studies | Definition of high vs. low exposure | |
|---|---|---|
| Ravnskov4 (1979) | Intensity factor | |
| 2 = occupational house painting indoor, industrial spray-painting without protection devices, carpet and floor laying, production of paint and glue, polyester plastic application | ||
| 1 = non-occupational house painting indoor, spray-painting with protection devices, industrial degreasing of metal, printing work, occupational gluing, anesthesiologic work, dry cleaning | ||
| 0.5 = outdoor painting, motor repairing, handling of petrol, hobby gluing, drawing with filter-tipped pens | ||
| Intensity: Hour of exposure × Year of exposure × Intensity factor | ||
| 50 ≤ high exposed | ||
| 10 ≤ and < 50 exposed | ||
| < 10 non-exposed | ||
| Harrington et al.8 (1989) | Exposure indices (EIs) were computed for each relevant solvent type up to the time of diagnosis or retirement, whichever was the earlier. EI were then calculated by multiplying the score by the total duration of exposure, adjusted so that 1-year full time heavy exposure corresponded to an exposure index of 100. An overall EI for “total solvent” exposures was obtained simply by summing the EIs for individual solvents. | |
| 100 ≤ EI: Exposed | ||
| 1 ≤ EI < 100: Intermediate | ||
| EI < 1: Non-exposed | ||
| Porro et al.21 (1992) | Intensity factor | |
| 2 = production of paint and glue, occupational painting indoors, spray painting without protection devices, polyester resin application with heavy contact with styrene, tank cleaning without protection devices, carpet cleaning | ||
| 1 = non-occupational painting indoors, spray painting with protection devices, industrial degreasing of metals, printing work(rotogravure), occupational gluing(including vamps gluing), dry cleaning, anesthetic work, occupational use of hair sprays, use of pesticides, polyester resin application with low exposure to styrene | ||
| 0.5 = outdoor painting, motor repairing, hobby gluing, drawing with felt tipped pens, exposure to exhaust fumes outdoors, handling of petrol fuels, degreasing of metals(excluding industrial degreasing) | ||
| Intensity: Hour of exposure × Year of exposure × Intensity factor | ||
| High exposure = Above median | ||
| Lower exposure = Below median | ||
| No exposure = Reference | ||
| (median: occupational 80.12, non-occupational 2.76) | ||
| Stengel et al.23 (1995) | Two industrial hygiene experts assessed exposure to 30 different types of solvents as well as the level (low, medium, high) and the frequency of exposure (i.e., once a week, subdivided as < 2 h/wk, 2–20 h/wk, and > 20 h/wk) (The examples of method to calculate exposure level are not provided). | |
| No exposure: No exposure | ||
| Low exposure: Defined as < 2 h/wk whatever the level or low level whatever the frequency (< 2 h/wk or low level in the tables) | ||
| Fored et al.9 (2004) | The exposure was classified on a 5-level scale in terms of approximated additive HE. Exposure to an HE of 1.0 for a single solvent corresponds to an average exposure level during an 8-hour working day equal to the OEL prescribed by the Swedish Work Environment Authority in 1996 (Ordinance on Occupational Exposure Limit Values, ASF 1996:2 [In Swedish], Stockholm, National Board of Occupational Safety and Health [Swedish Work Environment Authority], 1996) | |
| Cumulative lifetime exposure for organic solvents was calculated as the product of the intensity (HE), exposure frequency (days per month), and the duration (years) of the exposure, summed over all work periods in the subject’s occupational history. | ||
| Lifetime cumulative dose | ||
| First-Second quartile: Low exposure | ||
| Third-Fourth quartile: High exposure | ||
| Jacob et al. 29 (2007) | Job periods were reviewed, and solvent exposure level (low, medium, high) and frequency (occasional [i.e., less than once a week] or regular [i.e., once a week], subdivided as < 2, 2 to 20, and > 20 h/wk) was determined by 2 industrial hygienists. (The examples of method to calculate exposure level are not provided) | |
| No exposure = No exposure | ||
| Low exposure = Low intensity or frequency < 2 h/wk. | ||
| High exposure = High intensity and frequency ≥ 2 h/wk. | ||
Subgroup analysis by disease category was performed by collecting only cases with an OR for 1 disease, excluding cases where 2 or more diseases overlapped in the outcome. However, this only excluded cases where there was a mention of disease duplication in the body of the thesis. Even if there was no such mention, there was a possibility that the disease was counted in duplicate.
In addition, organic solvent exposure in studies included in this paper was defined only by experience in occupation exposure to organic solvents such as paint makers and machine industries. There was no subgroup analysis of exactly which specific substances were dangerous. Among papers included in this study, Radican et al.28 (trichloroethylene, 1,1,1-trichloroethylene, JP4 gasoline) and Jacob et al.30 (trichloroethylene, methylene chloride, toluene, and xylene, aliphatic hydrocarbons, ketones, alcohols, esters) showed risks of individual substances. In other studies, the risk of individual substances was not given. However, organic solvent exposure is known to be mixed organic solvent exposure mostly.36 Therefore, we concluded that it would be more meaningful to understand the risk of exposure to mixed organic solvents itself.
This study includes the studies from 1975 to 2007, and most of the studies included were studies prior to the 2000s. The reason for including studies from such a distant past are, first, because there are few studies after 2000, and second, because there are enough good quality studies with low risk of bias among studies before 2000. However, it is possible that this study did not reflect the latest trends as a result. These studies were mainly published in the US or Europe. Since the 2000s, risks have been outsourced, such as processes and factories using hazardous chemicals such as organic solvents being moved to the third world. It is presumed that the number of workers exposed to high concentrations of these organic solvents has rapidly decreased, and related studies are no longer being conducted.
Papers included in this study did not conduct a quantitative exposure evaluation of individual organic solvents. We performed a subgroup analysis by dividing high and low exposure levels through exposure period and exposure intensity defined by each study included in this analysis. However, it was not possible to analyze the kind of substance or the amount of substance that caused CKD. Only with further studies exact regulation could be applied in practice, such as setting an accurate exposure limit value that requires a renal function or proteinuria screening test. Further research should be conducted on the exact mechanism by which organic solvents contribute to glomerular damage or worsening of renal function.
CONCLUSIONS
We performed an updated meta-analysis including recent research data to investigate the association between mixed organic solvent exposure and CKD. As a result, it was confirmed that the risk of CKD was significantly increased in workers exposed to mixed organic solvents. Further research is needed to determine the exact mechanisms and thresholds. Surveillance for kidney damage in the group exposed to high levels of organic solvents should also be conducted.
Abbreviations
ACR
albumin-to-creatinine ratio
CI
confidence interval
CKD
chronic kidney disease
ESRD
end-stage renal disease
GFR
glomerular filtration rate
GN
glomerulonephritis
GRADE
Grading of Recommendations Assessment, Development and Evaluation
HE
hygienic effect
ICD
International Statistical Classification of Diseases
IV
interval variable
KDIGO
Kidney Disease Improvement Global Outcomes
MIBK
methyl isobutyl ketone
NOS
Newcastle-Ottawa Scale
OEL
occupational exposure limit
OR
odds ratio
PECO
Population, Exposure, Comparator, and Outcomes
PRISMA
Preferred Reporting Items for Systematic Reviews and Meta-Analysis
RBD
red blood cell
SE
standard error
WBC
white blood cell
-
Competing interests: The authors declare that they have no competing interests.
-
Author Contributions:
NOTES
- 1. Andersen M, MacNaughton M, Clewell HJ. Threshold limit values for chemical substances and physical agents and biological exposure indices. Biological Exposure Indices. 1998 TLVs and BEIs. Cincinnati, OH, USA: American Conference of Governmental Industrial Hygienists (ACGIH); 1998, 541–550.
- 2. Korea Occupational Safety and Health Agency. Korea Occupational Safety and Health Research Institute. Evaluation of the Strike and Multiple Organic Solvents. Ulsan, Korea: Korea Occupational Safety and Health Agency; 2003.
- 3. Zimmerman SW, Groehler K, Beirne GJ. Hydrocarbon exposure and chronic glomerulonephritis. Lancet 1975;2(7927):199–201. 51959.ArticlePubMed
- 4. Ravnskov U, Forsberg B, Skerfving S. Glomerulonephritis and exposure to organic solvents. A case-control study. Acta Med Scand 1979;205(7):575–579. 474184.PubMed
- 5. van der Laan G. Chronic glomerulonephritis and organic solvents. A case-control study. Int Arch Occup Environ Health 1980;47(1):1–8. 7429643.PubMed
- 6. Bell GM, Gordon AC, Lee P, Doig A, MacDonald MK, Thomson D, et al. Proliferative glomerulonephritis and exposure to organic solvents. Nephron J 1985;40(2):161–165.ArticlePDF
- 7. Yaqoob M, Stevenson A, Mason H, Bell GM. Hydrocarbon exposure and tubular damage: additional factors in the progression of renal failure in primary glomerulonephritis. Q J Med 1993;86(10):661–667. 8255964.ArticlePubMed
- 8. Harrington JM, Whitby H, Gray CN, Reid FJ, Aw TC, Waterhouse JA. Renal disease and occupational exposure to organic solvents: a case referent approach. Br J Ind Med 1989;46(9):643–650. 2789968.ArticlePubMedPMC
- 9. Fored CM, Nise G, Ejerblad E, Fryzek JP, Lindblad P, McLaughlin JK, et al. Absence of association between organic solvent exposure and risk of chronic renal failure: a nationwide population-based case-control study. J Am Soc Nephrol 2004;15(1):180–186. 14694171.PubMed
- 10. Ravnskov U. Hydrocarbon exposure may cause glomerulonephritis and worsen renal function: evidence based on Hill’s criteria for causality. QJM 2000;93(8):551–556. 10924538.ArticlePubMed
- 11. Stevens P, Levin A. Kidney Disease: Improving Global Outcomes Chronic Kidney Disease Guideline Development Work Group Members. Evaluation and management of chronic kidney disease: synopsis of the kidney disease: improving global outcomes 2012 clinical practice guideline. Ann Intern Med 2013;158(11):825–830. 23732715.ArticlePubMedPDF
- 12. Page MJ, McKenzie JE, Bossuyt PM, Boutron I, Hoffmann TC, Mulrow CD, et al. The PRISMA 2020 statement: an updated guideline for reporting systematic reviews. Syst Rev 2021;10(1):89. 33781348.PubMedPMC
- 13. Morgan RL, Whaley P, Thayer KA, Schünemann HJ. Identifying the PECO: A framework for formulating good questions to explore the association of environmental and other exposures with health outcomes. Environ Int 2018;121(Pt 1):1027–1031. 30166065.ArticlePubMedPMC
- 14. Wells G, Shea B, O’Connell J. The Newcastle-Ottawa scale (NOS) for assessing the quality of nonrandomised studies in meta-analyses. Ottawa, Canada: Ottawa Health Research Institute; 2011.
- 15. Higgins JP, Thompson SG, Deeks JJ, Altman DG. Measuring inconsistency in meta-analyses. BMJ 2003;327(7414):557–560. 12958120.ArticlePubMedPMC
- 16. Hayashino Y, Noguchi Y, Fukui T. Systematic evaluation and comparison of statistical tests for publication bias. J Epidemiol 2005;15(6):235–243. 16276033.ArticlePubMedPMC
- 17. Shim SR, Shin IS, Bae JM. Intervention meta-analysis using STATA software. J Health Info Stat 2016;41(1):123–134.ArticlePDF
- 18. Finn R, Fennerty AG, Ahmad R. Hydrocarbon exposure and glomerulonephritis. Clin Nephrol 1980;14(4):173–175. 7428191.PubMed
- 19. Harrison DJ, Thomson D, MacDonald MK. Membranous glomerulonephritis. J Clin Pathol 1986;39(2):167–171. 3950037.ArticlePubMedPMC
- 20. Steenland NK, Thun MJ, Ferguson CW, Port FK. Occupational and other exposures associated with male end-stage renal disease: a case/control study. Am J Public Health 1990;80(2):153–157. 2153349.ArticlePubMedPMC
- 21. Porro A, Lomonte C, Coratelli P, Passavanti G, Ferri GM, Assennato G. Chronic glomerulonephritis and exposure to solvents: a case-referent study. Br J Ind Med 1992;49(10):738–742. 1419865.ArticlePubMedPMC
- 22. Yaqoob M, Bell GM, Percy DF, Finn R. Primary glomerulonephritis and hydrocarbon exposure: a case-control study and literature review. Q J Med 1992;83(301):409–418. 1438676.PubMed
- 23. Stengel B, Cénée S, Limasset JC, Protois JC, Marcelli A, Brochard P, et al. Organic solvent exposure may increase the risk of glomerular nephropathies with chronic renal failure. Int J Epidemiol 1995;24(2):427–434. 7635606.ArticlePubMed
- 24. Nuyts GD, Van Vlem E, Thys J, De Leersnijder D, D’Haese PC, Elseviers MM, et al. New occupational risk factors for chronic renal failure. Lancet 1995;346(8966):7–11. 7603180.ArticlePubMed
- 25. Asal NR, Cleveland HL, Kaufman C, Nsa W, Nelson DI, Nelson RY, et al. Hydrocarbon exposure and chronic renal disease. Int Arch Occup Environ Health 1996;68(4):229–235. 8738352.ArticlePubMedPDF
- 26. Yaqoob M, Patrick AW, McClelland P, Stevenson A, Mason H, Percy DF, et al. Occupational hydrocarbon exposure and diabetic nephropathy. Diabet Med 1994;11(8):789–793. 7851074.ArticlePubMed
- 27. Ravnskov U. Influence of hydrocarbon exposure on the course of glomerulonephritis. Nephron J 1986;42(2):156–160.ArticlePDF
- 28. Radican L, Wartenberg D, Rhoads GG, Schneider D, Wedeen R, Stewart P, et al. A retrospective occupational cohort study of end-stage renal disease in aircraft workers exposed to trichloroethylene and other hydrocarbons. J Occup Environ Med 2006;48(1):1–12. 16404204.ArticlePubMedPMC
- 29. Jacob S, Héry M, Protois JC, Rossert J, Stengel B. Effect of organic solvent exposure on chronic kidney disease progression: the GN-PROGRESS cohort study. J Am Soc Nephrol 2007;18(1):274–281. 17135394.PubMed
- 30. Jacob S, Héry M, Protois JC, Rossert J, Stengel B. New insight into solvent-related end-stage renal disease: occupations, products and types of solvents at risk. Occup Environ Med 2007;64(12):843–848. 17567724.ArticlePubMedPMC
- 31. Hsu CY, Chertow GM. Chronic renal confusion: insufficiency, failure, dysfunction, or disease. Am J Kidney Dis 2000;36(2):415–418. 10922323.ArticlePubMed
- 32. Evans D. Hierarchy of evidence: a framework for ranking evidence evaluating healthcare interventions. J Clin Nurs 2003;12(1):77–84. 12519253.ArticlePubMed
- 33. Mutti A, Coccini T, Alinovi R, Toubeau G, Broeckaert F, Bergamaschi E, et al. Exposure to hydrocarbons and renal disease: an experimental animal model. Ren Fail 1999;21(3-4):369–385. 10416216.ArticlePubMed
- 34. Landry JF, Langlois S. Acute exposure to aliphatic hydrocarbons: an unusual cause of acute tubular necrosis. Arch Intern Med 1998;158(16):1821–1823. 9738613.ArticlePubMed
- 35. Franchini I, Cavatorta A, Falzoi M, Lucertini S, Mutti A. Early indicators of renal damage in workers exposed to organic solvents. Int Arch Occup Environ Health 1983;52(1):1–9. 6603422.ArticlePubMedPDF
- 36. Winchester RV, Madjar VM. Solvent effects on workers in the paint, adhesive and printing industries. Ann Occup Hyg 1986;30(3):307–317. 3777750.PubMed
REFERENCES
REFERENCES
Appendix
Supplementary methods
Example of search strategy used:
(hydrocarbon:ab,ti OR solvent*:ab,ti OR acetone:ab,ti OR '2 propanol':ab,ti OR tetrahydrofuran:ab,ti OR cyclohexane:ab,ti OR toluene:ab,ti OR xylene:ab,ti OR trichloroethylene:ab,ti OR hexane:ab,ti OR benzene:ab,ti OR ethylbenzene:ab,ti OR styrene:ab,ti OR '4 methyl 2 pentanone':ab,ti OR 'diisobutyl ketone':ab,ti OR 'methylethyl ketone':ab,ti OR butanol:ab,ti OR isobutanol:ab,ti OR trichloroethane:ab,ti)
AND
(kidney:ab,ti OR 'kidney disease':ab,ti OR 'kidney failure':ab,ti OR 'chronic kidney failure':ab,ti OR renal:ab,ti OR creatinine:ab,ti OR 'glomerulus filtration rate':ab,ti OR 'end stage renal disease':ab,ti OR ‘Proteinuria’ OR glomerulonephritis:ab,ti OR 'membranous nephropathy':ab,ti OR 'minimal change disease':ab,ti OR 'focal segmental glomerulosclerosis':ab,ti OR 'membranoproliferative glomerulonephritis':ab,ti OR 'fibrillary glomerulonephritis':ab,ti OR 'mesangioproliferative glomerulopathy':ab,ti OR 'proliferative glomerulonephritis':ab,ti OR 'acute diffuse proliferative glomerulonephritis':ab,ti OR 'crescentic glomerulonephritis':ab,ti OR 'immunoglobulin A nephropathy':ab,ti OR 'IgA nephropathy':ab,ti). The terms in apostrophes are the mesh terms and the words without the apostrophes are the freewords.
Figure & Data
REFERENCES
Citations
Citations to this article as recorded by 
- Environmental Pollution and Its Impact on Kidney Diseases: A Comprehensive Review of Current Evidence
Seung Eun Lee, Yong Seek Park
Life.2026; 16(2): 291. CrossRef - Assessment of Early Nephrotoxicity in Workers Exposed to Trichloroethylene Using NGAL and KIM‐1 Biomarkers
Murat Büyükşekerci, Meşide Gündüzöz, Mustafa Polat, Osman Gökhan Özakıncı, Lütfiye Tutkun, Gülsüm Abuşoğlu, Servet Birgin İritaş, Vugar Ali Türksoy, Engin Tutkun
Journal of Applied Toxicology.2026;[Epub] CrossRef - Identifying and Prioritizing Hazardous Chemicals in Construction Metal Structure Coating Systems: A Roadmap for Data‐Driven Disease Prevention
Paridhi Patel, Dhimiter Bello, Anila Bello
American Journal of Industrial Medicine.2025;[Epub] CrossRef - Mixed Solvency Concept to Replace Harmful Organic Solvent: Recent Trends and Future Challenges in Formulation Development
Pranjal Kumar Singh, Nidhi Singh, Atul Pratap Singh, Poonam Bhardwaj, Kapil Sachan, Smita Singh
Combinatorial Chemistry & High Throughput Screening.2025; 28(2): 226. CrossRef - The Exposome and the Kidney: A Silent Dialogue Shaping Chronic Kidney Disease
Livia Alvarenga, Marcia Ribeiro, Ludmila F. M. F. Cardozo, Natália A. Borges, Peter Stenvinkel, Denise Mafra
Journal of Xenobiotics.2025; 15(3): 73. CrossRef - Association between job characteristics and kidney function among men: a cross-sectional analysis of the Rafsanjan cohort study
Zahra Jamali, Reza Hosseiniara, Parvin Khalili, Fatemeh Ayoobi, Sadegh Zarei, Zahra Ahmadi, Seyed Mojtaba Heydari Khoormizi, Alireza Nazari
BMC Nephrology.2025;[Epub] CrossRef
 Cite
CiteOrganic solvent exposure for the chronic kidney disease: updated systematic review with meta-analysis


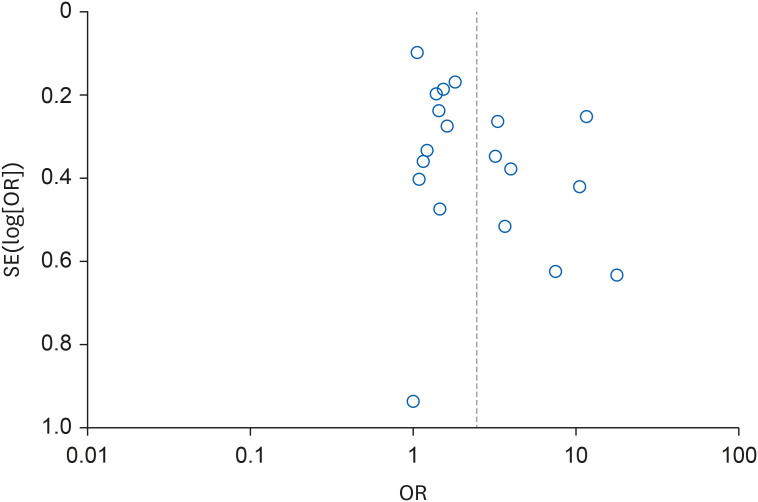
Fig. 1 Study flow diagram showing included studies and reasons for exclusion of studies.
Fig. 2 Forest plot of the overall risk of chronic kidney disease for exposure to organic solvents.SE: standard error; IV: interval variable; CI: confidence interval.
Fig. 3 Funnel plot for overall risk of chronic kidney disease according to organic solvent exposure.SE: standard error; OR: odds ratio.
Fig. 1
Fig. 2
Fig. 3
Organic solvent exposure for the chronic kidney disease: updated systematic review with meta-analysis
| Definition | ||
|---|---|---|
| CKD is defined based on the presence of either kidney damage or decreased kidney function for three or more months, irrespective of cause. | ||
| Criteria | Comment | |
| Duration ≥ 3 months, based on documentation of inference | Duration is necessary to distinguish chronic from acute kidney diseases. | |
| - Clinical evaluation can often suggest duration | ||
| - Documentation of duration is usually not available in epidemiologic studies | ||
| GFR < 60 mL/min/1.73 m2 | GFR is the best overall index of kidney function in health and disease. | |
| - The normal GFR in young adults is approximately 125 mL/min/1.73 m2; GFR < 15 mL/min/1.73 m2 is defined as kidney failure | ||
| - Decreased GFR can be detected by current estimating equations for GFR based on serum creatinine (estimated GFR) but not by serum creatinine alone | ||
| - Decreased estimated GFR can be confirmed by measured GFR, measured creatinine clearance, or estimated GFR using cystatin C | ||
| Kidney damage, as defined by structural abnormalities or functional abnormalities other than decreased GFR | Pathologic abnormalities (examples). Cause is based on underlying illness and pathology. Markers of kidney damage may reflect pathology. | |
| - Glomerular diseases (diabetes, autoimmune diseases, systemic infections, drugs, neoplasia) | ||
| - Vascular diseases (atherosclerosis, hypertension, ischemia, vasculitis, thrombotic microangiopathy) | ||
| - Tubulointestitial diseases (urinary tract infections, stones, obstruction, drug toxicity) | ||
| - Cystic disease (polycystic kidney disease) | ||
| History of kidney transplantation. | ||
| - Chronic allograft nephropathy (non-specific findings of tubular atrophy, interstitial fibrosis, vascular and glomerular sclerosis) | ||
| - Rejection | ||
| - Drug toxicity (calcineurin inhibitors) | ||
| - BK virus nephropathy | ||
| - Recurrent disease (glomerular disease, oxalosis, Fabry disease) | ||
| Albuminuria as marker of kidney damage (increased glomerular permeability, urine ACR > 30 mg/g)a. | ||
| - The normal urine ACR in young adults is < 10 mg/g. Urine ACR categories 10–29, 30–300 and > 300 mg are termed “mildly increased, moderately increased, and severely increased” respectively. Urine ACR > 2,200 mg/g is accompanied by signs and symptoms of nephrotic syndrome (low serum albumin, edema, and high serum cholesterol). | ||
| - Threshold value corresponds approximately to urine dipstick values of trace or 1+, depending on urine concentration | ||
| - High urine ACR can be confirmed by urine albumin excretion in a timed urine collection | ||
| Urinary sediment abnormalities as markers of kidney damage, for example: | ||
| - RBC casts in proliferative glomerulonephritis | ||
| - WBC casts in pyelonephritis or interstitial nephritis | ||
| - Granular casts and renal tubular epithelial cells in many parenchymal diseases (non-specific) | ||
| Imaging abnormalities as markers of kidney damage (ultrasound, computed tomography and magnetic resonance imaging with or without contrast, isotope scans, angiography) | ||
| - Polycystic kidneys | ||
| - Hydronephrosis due to obstruction | ||
| - Cortical scarring due to infarcts, pyelonephritis or vesicoureteral reflux | ||
| - Renal masses or enlarged kidneys due to infiltrative disease | ||
| - Renal artery stenosis | ||
| - Small and echogenic kidneys (common in later stages of CKD due to many parenchymal diseases) | ||
| Author(s) | Time of study | Study design | Data source | Number of samples | Exposure | Outcome |
|---|---|---|---|---|---|---|
| Zimmerman | 1975 | Case-control | Nephrology program of University of Wisconsin Center for Health Sciences, and Veterans’ Administration Hospital, Madison, Wisconsin 53706, USA | Case 63, Control 63 | Hydrocarbona | ESRD |
| Ravnskov et al. | 1979 | Case-control | Department of Nephrology in Lund, Sweden (otherwise, not specified) | Case 50, Control 100 | Organic solvents | GN |
| Finn et al. | 1980 | Case-control | Hospital inpatients (otherwise, not specified) | Case 89, Control 53 | Hydrocarbona | ESRD |
| van der Laan | 1980 | Case-control | Renal Pathology Department of the University of Amsterdam (otherwise, not specified) | Case 50, Control 50 | Organic solvents | GN |
| Harrison et al. | 1986 | Case-control | Patients who presented with membranous GN in the Edinburgh region over 20 years (otherwise, not specified) | Case 65, Control 1,746,530 | Organic solvents | GN |
| Harrington et al. | 1989 | Case-control | Referents: west midlands, community-based referents renal cancer case: drawn from names of all living patients with histologically proved renal adenocarcinoma (clear cell) diagnosed from May 1984 to April 1985 and recorded in the west midland’s regional cancer registry (contacted by post, participate after agreement) | Case 50, Control 50 | Organic solvents | GN, renal adenocarcinoma |
| GN case: patients attending for renal biopsy at the Queen Elizabeth Hospital, Birmingham | ||||||
| Steenland et al. | 1990 | Case-control | Edinburgh Renal Clinics (otherwise, not specified) | Case 325, Control 325 | Oragnic solvents | ESRD |
| Porro et al. | 1992 | Case-control | Case: clinical records of the Nephrology Department at the University of Bari | Case 60, Control 120 | Organic solvents | GN |
| Control: outpatients at the University of Bari | ||||||
| Yaqoob et al. | 1992 | Case-control | Case: Patients undergoing regular dialysis therapy between January 1988 and December 1989 and supervised by the Mersey Regional Renal Unit | Case 55 Control 55 | Hydrocarbona | ESRD |
| Control: normal controls attending a surgical day unit for minor surgical procedures | ||||||
| Yaqoob et al. | 1994 | Case-control | Patients with type 1 diabetes of over 10 years duration who regularly attended diabetic and renal clinics over a 6-month period were assessed. | Case 68, Control 45 | Hydrocarbona | Diabetic nephropathy |
| Stengel et al. | 1995 | Case-control | Cases were identified from the list of all patients whose GN was first diagnosed between January 1985 and December 1990 in Pathology Departments of 5 hospitals in Paris region. | Case 298, Control 298 | Organic solvents | GN |
| Nuyts et al. | 1995 | Case-control | Cases were recruited from five renal units in three industrial areas (antwerp, Liege, and Turnhout). | Case 272, Control 272 | Copperb, Chromium, Tin, Mercury, Welding Fumes, Silicon, Grain dust, Hydrocarbona | Chronic renal failure (defined as a consistent calculated creatinine clearance under the third percentile of the normal distribution) |
| Controls were randomly selected from lists of voters in Antwerp, Turnhout, and Liege and in three rural communities (Brasschaat, Gierle, and Neupre) from the same catchment areas. | ||||||
| Asal et al. | 1996 | Case-control | cases were obtained from hospitals in metropolitan areas of Oklahoma City and Tulsa, Oklahoma. All major hospitals and nephrology clinics were contacted. Participating hospitals, nephrology clinics, and nephrologists were requested to provide a complete list of their patients whose diagnoses had an ICD code pertinent to chronic renal disease between January 1, 1985 and December 31, 1992. | Case 321, Control 321 | Hydrocarbona | GN |
| Fored et al. | 2004 | Case-control | The continuously updated Swedish National Population Register provided a well-defined study base of all 5.3 million native Swedes aged 18 to 74 years who were residents in the country during the ascertainment period (May 20, 1996 through May 31, 1998). | Case 913, Control 991 | Organic solvents | Chronic renal failure (men and women whose serum creatinine level exceeded 300 μmol/L (3.4 mg/dL) and 250 μmol/L (2.8 mg/dL)) |
| Ravnskov | 1986 | Cohort (prospective) | Department of Nephrology of the University Hospital Lund, Sweden (otherwise, not specified) | 71 | Hydrocarbona | Chronic renal failure (GFR < 80 mL/min) |
| Yaqoob et al. | 1993 | Cohort (retrospective) | Patients with biopsy-proven GN of duration > 1 year (proliferative, n = 60; membranous, n = 8) who regularly attended renal clinics over six months during 1989. | 68 | Hydrocarbona | Progressive renal failure (defined as persistent rise of serum creatinine > 50 μmol/L above the baseline) |
| Radican et al. | 2006 | Cohort (retrospective) | Data from 3 sources: a database of former civilian employees of the Hill Air Force Base in Utah, mortality data from the National Death Index (NDI), and ESRD incidence data from the U.S. Renal Data System (USRDS) database | 14,455 | Hydrocarbona | ESRD |
| Jacob et al. | 2007 | Cohort (retrospective) | GN-PROGRESS retrospective cohort study in 11 nephrology departments of the Paris region (see acknowledgments for a list of participating centers) | 338 | Organic solvents | ESRD |
| Jacob et al. | 2007 | Cohort (retrospective) | GN-PROGRESS retrospective cohort study. All new Caucasian adult patients with biopsy proven IgA nephropathy (IgAN), membranous nephropathy, and focal and segmental glomerulosclerosis diagnosed between January 1994 and June 2001 in 11 nephrology departments in the Paris area were invited to participate in the study between January 2002 and March 2004. | 269 | Organic solvents | ESRD |
| Categories | Number of results | OR (95% CI) | |
|---|---|---|---|
| Exposure level | |||
| High exposure | 6 | 2.44 (1.19–5.00) | |
| Low exposure | 6 | 1.07 (0.77–1.49) | |
| Disease category | |||
| GN | 6 | 2.69 (1.18–6.11) | |
| Worsening of renal function | 6 | 1.46 (1.29–1.64) | |
| Study design | |||
| Case-control | 12 | 2.41 (1.57–3.70) | |
| Cohort | 5 | 2.51 (1.34–4.70) | |
| NOS good | 12 | 1.93 (1.43–2.61) | |
| NOS fair/poor | 7 | 4.12 (3.09–5.51) | |
| Study (cohort) | Year | Selection representativeness of the sample | Selection of the non-intervention cohort | Ascertainment of exposure | Demonstration that outcome of interest was not present at start of study | Comparability based on design and analysis | Outcome assessment of outcome | Was follow up long enough for outcomes to occur | Adequacy of follow up of cohorts | Total score | Assessment |
|---|---|---|---|---|---|---|---|---|---|---|---|
| Ravnskov | 1986 | 0 | 1 | 1 | 1 | 0 | 1 | 1 | 0 | 5 | Poor |
| Yaqoob et al. | 1993 | 0 | 1 | 1 | 1 | 2 | 1 | 1 | 1 | 8 | Good |
| Radican et al. | 2006 | 1 | 1 | 1 | 1 | 2 | 1 | 1 | 1 | 9 | Good |
| Jacob et al. | 2007 | 0 | 1 | 1 | 1 | 2 | 1 | 1 | 0 | 7 | Good |
| Jacob et al. | 2007 | 0 | 1 | 1 | 1 | 2 | 1 | 1 | 0 | 7 | Good |
| Study (case-control) | Selection is the case definition adequate? | Representativeness of cases | Selection of controls | Definition of controls | Comparability based on design and analysis | Outcome assessment of exposure | Same method of ascertainment for cases and controls | Non-response rate | Total score | Assessment | |
| Zimmerman | 1975 | 1 | 1 | 0 | 1 | 2 | 0 | 1 | 0 | 6 | Poor |
| Ravnskov et al. | 1979 | 1 | 1 | 0 | 1 | 2 | 1 | 1 | 0 | 7 | Good |
| Finn et al. | 1980 | 1 | 0 | 0 | 1 | 1 | 0 | 1 | 0 | 4 | Poor |
| van der Laan | 1980 | 1 | 1 | 0 | 0 | 2 | 0 | 1 | 0 | 5 | Poor |
| Harrison et al. | 1986 | 1 | 1 | 0 | 0 | 0 | 0 | 0 | 0 | 2 | Poor |
| Harrington et al. | 1989 | 1 | 1 | 1 | 1 | 2 | 1 | 1 | 0 | 8 | Good |
| Steenland et al. | 1990 | 1 | 1 | 1 | 1 | 2 | 1 | 1 | 0 | 8 | Good |
| Yaqoob et al. | 1992 | 1 | 0 | 0 | 1 | 2 | 1 | 1 | 0 | 6 | Fair |
| Porro et al. | 1992 | 1 | 1 | 0 | 1 | 2 | 1 | 1 | 0 | 7 | Good |
| Yaqoob et al. | 1994 | 1 | 0 | 0 | 1 | 2 | 1 | 1 | 0 | 6 | Fair |
| Stengel et al. | 1995 | 0 | 0 | 0 | 0 | 0 | 1 | 1 | 0 | 2 | Poor |
| Nuyts et al. | 1995 | 1 | 0 | 1 | 1 | 2 | 1 | 1 | 0 | 7 | Good |
| Asal et al. | 1996 | 1 | 1 | 1 | 0 | 2 | 1 | 1 | 0 | 7 | Good |
| Fored et al. | 2004 | 1 | 1 | 1 | 0 | 2 | 1 | 1 | 0 | 7 | Good |
| Outcome | Quality assessment | ||||||||
|---|---|---|---|---|---|---|---|---|---|
| Required domains | Additional domains | Grade | |||||||
| Study limitation | Consistency | Directness of evidence | Precision | Reporting bias | Dose-response association | Plausible confounding that would decrease observed effect | Strength of association (magnitude of effect) | ||
| CKD | Lowa | Inconsistentb | Direct | Precise | detectedc | None | Absent | Larged | ⨁⨁Low |
| Studies | Definition of high vs. low exposure | |
|---|---|---|
| Ravnskov | Intensity factor | |
| 2 = occupational house painting indoor, industrial spray-painting without protection devices, carpet and floor laying, production of paint and glue, polyester plastic application | ||
| 1 = non-occupational house painting indoor, spray-painting with protection devices, industrial degreasing of metal, printing work, occupational gluing, anesthesiologic work, dry cleaning | ||
| 0.5 = outdoor painting, motor repairing, handling of petrol, hobby gluing, drawing with filter-tipped pens | ||
| Intensity: Hour of exposure × Year of exposure × Intensity factor | ||
| 50 ≤ high exposed | ||
| 10 ≤ and < 50 exposed | ||
| < 10 non-exposed | ||
| Harrington et al. | Exposure indices (EIs) were computed for each relevant solvent type up to the time of diagnosis or retirement, whichever was the earlier. EI were then calculated by multiplying the score by the total duration of exposure, adjusted so that 1-year full time heavy exposure corresponded to an exposure index of 100. An overall EI for “total solvent” exposures was obtained simply by summing the EIs for individual solvents. | |
| 100 ≤ EI: Exposed | ||
| 1 ≤ EI < 100: Intermediate | ||
| EI < 1: Non-exposed | ||
| Porro et al. | Intensity factor | |
| 2 = production of paint and glue, occupational painting indoors, spray painting without protection devices, polyester resin application with heavy contact with styrene, tank cleaning without protection devices, carpet cleaning | ||
| 1 = non-occupational painting indoors, spray painting with protection devices, industrial degreasing of metals, printing work(rotogravure), occupational gluing(including vamps gluing), dry cleaning, anesthetic work, occupational use of hair sprays, use of pesticides, polyester resin application with low exposure to styrene | ||
| 0.5 = outdoor painting, motor repairing, hobby gluing, drawing with felt tipped pens, exposure to exhaust fumes outdoors, handling of petrol fuels, degreasing of metals(excluding industrial degreasing) | ||
| Intensity: Hour of exposure × Year of exposure × Intensity factor | ||
| High exposure = Above median | ||
| Lower exposure = Below median | ||
| No exposure = Reference | ||
| (median: occupational 80.12, non-occupational 2.76) | ||
| Stengel et al. | Two industrial hygiene experts assessed exposure to 30 different types of solvents as well as the level (low, medium, high) and the frequency of exposure (i.e., once a week, subdivided as < 2 h/wk, 2–20 h/wk, and > 20 h/wk) (The examples of method to calculate exposure level are not provided). | |
| No exposure: No exposure | ||
| Low exposure: Defined as < 2 h/wk whatever the level or low level whatever the frequency (< 2 h/wk or low level in the tables) | ||
| Fored et al. | The exposure was classified on a 5-level scale in terms of approximated additive HE. Exposure to an HE of 1.0 for a single solvent corresponds to an average exposure level during an 8-hour working day equal to the OEL prescribed by the Swedish Work Environment Authority in 1996 ( | |
| Cumulative lifetime exposure for organic solvents was calculated as the product of the intensity (HE), exposure frequency (days per month), and the duration (years) of the exposure, summed over all work periods in the subject’s occupational history. | ||
| Lifetime cumulative dose | ||
| First-Second quartile: Low exposure | ||
| Third-Fourth quartile: High exposure | ||
| Jacob et al. | Job periods were reviewed, and solvent exposure level (low, medium, high) and frequency (occasional [i.e., less than once a week] or regular [i.e., once a week], subdivided as < 2, 2 to 20, and > 20 h/wk) was determined by 2 industrial hygienists. (The examples of method to calculate exposure level are not provided) | |
| No exposure = No exposure | ||
| Low exposure = Low intensity or frequency < 2 h/wk. | ||
| High exposure = High intensity and frequency ≥ 2 h/wk. | ||
Table 1 Definition and criteria for CKD (KDIGO guideline11)
CKD: chronic kidney disease; GFR: glomerular filtration rate; ACR: albumin-to-creatinine ratio; RBD: red blood cell; WBC: white blood cell.
aACR conversion factor 1.0 mg/g = 0.113 mg/mmol.
Table 2 Characteristics of included studies that reported exposure to organic solvents
ESRD: end-stage renal disease; GN: glomerulonephritis; ICD: International Statistical Classification of Diseases; GFR: glomerular filtration rate.
aAll papers with exposure defined as hydrocarbons included in this meta-analysis investigated hydrocarbons detected in petroleum-related products or paints, adhesives, degreasing agents, and diluents known to be occupationally exposed solvents.
bAmong several exposure factors, only hydrocarbon results were extracted and used for analysis.
Table 3 Subgroup analysis according to exposure level, disease category, study design, and quality of study
OR: odds ratio; CI: confidence interval; GN: glomerulonephritis; NOS: Newcastle Ottawa Scale.
Table 4 Quality assessment of studies included in the systematic review according to the Newcastle Ottawa Scale
Table 5 GRADE approach for the primary outcome
GRADE: Grading of Recommendations Assessment, Development and Evaluation; CKD: chronic kidney disease.
aAll included studies are observational, and the risk of bias in 5 included studies was evaluated as ‘Poor.’
bConsiderable heterogeneity (I2 = 87%).
cFunnel plot asymmetry, Egger’s regression test
dOverall pooled risk = 2.44.
Table 6 Definition of high vs. low exposure in each studies
HE: hygienic effect; OEL: occupational exposure limit.

