
Articles
- Page Path
- HOME > Ann Occup Environ Med > Volume 34; 2022 > Article
- Original Article Impacts of presenteeism on work-related injury absence and disease absence
-
Youna Won1
 , Hwan-Cheol Kim1,2, Jiho Kim1, Minsun Kim1, Seong-Cheol Yang1,2, Shin-Goo Park1,2, Jong-Han Leem1,2
 -
Annals of Occupational and Environmental Medicine 2022;34:e25.
DOI: https://doi.org/10.35371/aoem.2022.34.e25
Published online: September 23, 2022
1Department of Occupational and Environmental Medicine, Inha University Hospital, Incheon, Korea.
2Departments of Social and Preventive Medicine, School of Medicine, Inha University, Incheon, Korea.
- Address for Correspondence: Hwan-Cheol Kim. Department of Occupational and Environmental Medicine, School of Medicine, Inha University Hospital, 27 Inhang-ro, Jung-gu, Incheon 22332, Republic of Korea. carpediem@inha.ac.kr
• Received: April 11, 2022 • Revised: May 30, 2022 • Accepted: August 23, 2022
Copyright © 2022 Korean Society of Occupational & Environmental Medicine
This is an Open Access article distributed under the terms of the Creative Commons Attribution Non-Commercial License (https://creativecommons.org/licenses/by-nc/4.0/) which permits unrestricted non-commercial use, distribution, and reproduction in any medium, provided the original work is properly cited.
Abstract
-
Background Many studies have been conducted on presenteeism and absenteeism, but the relationship between presenteeism and absenteeism is unclear. This study was undertaken to investigate the effect of presenteeism on future absenteeism.
-
Methods This study was conducted on non-white collar workers that underwent general health examinations in 2014 and 2015. We asked subjects to fill out a questionnaire about their experiences of presenteeism for the past one year in 2014. In 2015, it was checked whether the same subjects had any experience of absence from work due to injury or disease during the past year. The χ2 test was used to analyze relationships between sociodemographic and occupational characteristics, presenteeism, and absence. Odds ratios (ORs) were calculated by logistic regression analysis controlled for confounding factors.
-
Results A total of 12,572 workers were included in the study. For workers who experienced presenteeism, the OR for injury absence was 2.705 (95% confidence interval [CI]: 2.044–3.581), and the OR for disease absence was 4.906 (95% CI: 3.996–6.024) after adjusting for sociodemographic and occupational confounding factors. For men that experienced presenteeism, the OR for injury absence was 3.035 (95% CI: 2.258–4.081), and the OR for disease absence was 5.508 (95% CI: 4.340–6.989). For women that experienced presenteeism, the OR for injury absence was 1.322 (95% CI: 0.577–3.028), which was not significant, and the OR for disease absence was 3.629 (95% CI: 2.405–5.475).
-
Conclusions This study suggests that presenteeism can influence future absenteeism. The effect of presenteeism may depend on cause of absence. Men who experienced presenteeism showed greater effects on injury and disease absence than women. For women, experience of presenteeism had a significant effect on disease absence but not on injury absence.
BACKGROUND
Presenteeism has been defined in various ways and was once considered to be the opposite of absenteeism, that is, presence in the workplace. However, the modern definition emphasizes not only the existence of workplace but also the health status and ability to work of the workers. Thus, presenteeism refers to the act of going to work and working despite health problems.1 Worker health problems can reduce concentration, work efficiency, and productivity,2,3 which can lead to business losses,4 and thus, managing presenteeism involves the management of individual workers and the company. Presenteeism is widespread worldwide and is experienced by 30% to 90% of workers.5
Previous studies have reported that several factors influence presenteeism. The following cross-sectional studies identified factors that influence presenteeism. According to Bielecky et al.,6 workers with chronic diseases such as hypertension or diabetes often experience presenteeism, and workers with mental health disorders, like depression, are more likely to experience health problems in the workplace. Presenteeism is also related to work characteristics such as the job demands and the availability of alternative workers, which are particularly relevant among health workers.7 In addition, non-regular employment and a self-employed status have been associated with a higher prevalence of presenteeism than regular employment.8
When health is not good, workers have a choice between absence or going to work. Therefore, presenteeism can be considered as an alternative to absenteeism. As such, it can be thought that absenteeism and presenteeism have negative effects on each other. But in previous studies, they were shown to have positive effects during the same period.9 According to a study by Leineweber et al.,10 a strong association exists between presenteeism and absence for sickness during the same 12-month period (odds ratio [OR]: 2.11, 95% confidence interval [CI]: 1.79–2.49). It shows that presenteeism is not a substitute for absenteeism. It is rather reported that the cost loss due to presenteeism is greater than the cost loss due to absenteeism.4,5 Previous cross-sectional studies can verify the close relationship between presenteeism and absenteeism, but they do not provide a temporal relationship, so there is a limitation in that they cannot be show the impact of presenteeism over time.
Therefore, we evaluated how past presenteeism affects future absence by evaluating absence 1 year after evaluating presenteeism. In addition, we classified types of absences and conducted sex-stratified.
METHODS
According to the Korean National Health Insurance Act, general health checkups should be conducted annually on non-white collar workers. Among those that underwent a general checkup in 2014, we selected individuals that received examinations at workplace units contracted with a hospital. To increase study homogeneity, only non-white collar workers followed up in 2015 were selected. The first questionnaire was conducted in 2014, and the second questionnaire was repeated in 2015, the following year. In 2014, the first year of the baseline, 408 workplaces and 20,950 people were included, but 7,328 people and 112 workplaces were lost during follow-up. Accordingly, 13,622 workers who underwent checkups in 2014 and 2015 and 296 workplaces were included. Of these 13,622 workers, 92.3% responded to all items, and thus, 12,572 workers and 291 workplaces were included in the analysis (Fig. 1).

All participants completed a self-reported questionnaire, which included questions on individual and sociodemographic variables and psychosocial work environment characteristics. Nurses or doctors assisted when workers experienced difficulties. All participants provided consent for the use of personal information before both examinations.
Data collection through the questionnaire was repeated from the same participants at 12-month intervals. We inserted the following questions into the general examination questionnaire to obtain data on presenteeism and absence. Presenteeism at baseline (2014) was determined using the question: “During the past year, have you ever worked despite being sick?” There were two response categories “yes” or “no”. The following year (2015), we assessed absences due to injury or disease using two questions: 1) “Have you been absent for more than one day due to an injury related to work?”; 2) “Have you been absent for more than one day due to physical or mental disease caused or aggravated by work, excluding injury, during the past year?”. Absences were defined as being absent from the workplace and not working. When absence was caused by an injury, it was defined as an 'injury absence' and when caused by disease as a ‘disease absence’.
The sociodemographic data included in the analysis were; sex and age (categorized by decade) and health indicators and lifestyle factors, which included smoking status, alcohol consumption, and chronic disease. Smoking status was categorized as current, former, or never, alcohol consumption as 0–2 times, 3–4 times, or 5–7 times per week, and chronic diseases included diabetes, high blood pressure, cardiovascular disease, cancer, and other diseases.
In addition, variables related to occupational factors were also identified. Workplace size was classified by number of workers. Korea categorizes Small and Medium-sized Enterprises and large enterprises based on the employment of < or ≥ 300 people, and we adopted the same convention. Industry types were classified according to the 9th revised classification of the Korean Standard Industry Code (KSIC) of the National Statistical Office, which systematically categorizes activities mainly performed by production unit type (e.g., business unit, corporate unit). No information on worker contracts was obtained.
Initially, the χ2 test was used to determine whether presenteeism and potential confounders were associated with absences due to injury or disease (the outcome variables). Logistic regression analysis was used to assess the association between presenteeism and absences due to injury or disease. In the multivariate logistic regression analysis, potential confounders with p-values of < 0.25 by univariate analysis were included. The adjusted ORs and CIs were obtained with the fully adjusted model.
We conducted supplemental stratified analysis on men and women as a previous study reported sex influences sick leave.11 The analysis was conducted using SPSS 19.0 (IBM Corp., Armonk, NY, USA).
RESULTS
Finally, 12,572 individuals were included in the study group. Characteristics of these study subjects are provided in Table 1. Among them, 2,823 (22.5%) answered at baseline (2014) that they had experienced presenteeism during the past year (the group with presenteeism). Differences between the group with presenteeism and the remainder (the group without presenteeism, n = 9,749) were found to be significant for sociodemographic factors such as sex, age, chronic disease, and smoking, but not alcohol consumption. There were 1,681 (17.7%) men and 1,142 (37.4%) women in the group with presenteeism. Of the 12,572 study subjects, 29.7% were in their 30s, 83.1% had no chronic disease, 42.1% did not smoke, and 82.5% consumed alcohol 0-2 times a week. The groups with and without presenteeism differed with respect to industry classification but not workplace size (P=0.506). The largest percentage of study subjects worked in the manufacturing industry (38.0%), followed by wholesale and retail at 20.2%. Eight thousand five-hundred seventy-five (68.2%) of study subjects worked in workplaces of 300 or more, of which 1,911 (22.3%) experienced presenteeism.
Table 1
Sociodemographic and occupational characteristics of the study subjects
Tables 2 and 3 show the characteristics of the study subjects who experienced the injury and disease absence one year after presenteeism. Two-hundred nineteen (1.7%) had experienced absence due to injury, and 410 (3.3%) absence due to disease. Significant differences were found for experience of presenteeism during the year before the baseline examination for injury and disease absence (both p < 0.001). For injury absence, significant differences were found for sex, smoking, industry classification, and workplace size. For disease absence, significant differences were found for smoking and industrial classification. Factors such as sex and workplace size had different effects on absence for different causes.
Table 2
Sociodemographic and occupational characteristics of the study subjects according to absence due to injury
Table 3
Sociodemographic and occupational characteristics of the study subjects according to absence due to disease
We also investigated the characteristics of study subjects by sex. Men and women had median ages in the 40s and 30s, respectively. Significant sex differences were found for all variables related to sociodemographic characteristics (e.g., chronic disease, smoking, and alcohol consumption). Furthermore, significant sex differences were observed for industry classification and workplace size (both p < 0.001), i.e., 39.6% of men were engaged in manufacturing and 25.7% in transportation and warehousing, whereas 32.8% of women were engaged in manufacturing and 30.9% in health and social welfare services. Injury absence was experienced by 194 men (2.0%) and 25 women (0.8%). The numbers of absences due to disease were 303 (3.2%) for men and 107 (3.5%) for women, which were more than the number of absences due to injury (information not shown).
The association between presenteeism and absenteeism adjusted for confounders is shown in Table 4. The unadjusted OR (95% CI) of those that experienced presenteeism who subsequently experienced absence due to an injury was 2.456 (1.870–3.225), and after adjusting for general sociodemographic factors, the adjusted OR (95% CI) was 2.996 (2.260–3.971). The OR (95% CI) of injury absence after adjusting for additional occupational factors was 2.705 (2.044–3.581). For absence due to disease, the unadjusted OR (95% CI) for those that experienced presenteeism was 5.020 (4.108–6.135), and after adjusting for general sociodemographic factors, the adjusted OR (95% CI) was 5.176 (4.227–6.338), and the OR (95% CI) adjusted for additional occupational factors was 4.906 (3.996–6.024).
Table 4
Associations between presenteeism with or without adjustment for confounding variables and absence due to injury or disease
OR: odds ratio, CI: confidence interval.
aORs were calculated by logistic regression analysis for absence due to injury or disease after adjusting for sex, age, chronic disease, smoking, and alcohol consumption.
bORs were calculated by logistic regression analysis for absence due to injury or disease after adjusting for sex, age, chronic disease, smoking, alcohol consumption, industry classification, and workplace size.
The results of stratified analysis by sex are presented in Table 5. After adjusting for sociodemographic and occupational factors, the adjusted OR (95% CI) for those in the presenteeism group that experienced injury absence was 3.035 (2.258–4.081) for men and 1.322 (0.577–3.028) for women. Unlike men, presenteeism was not associated with injury absence in women. For absence due to disease, the adjusted ORs (95% CI) after adjusting for sociodemographic and occupational factors were 5.508 (4.340–6.989) for men and 3.629 (2.405–5.475) for women. Presenteeism and disease absence were related in both men and women.
Table 5
Associations between presenteeism and absence due to injury or disease in men and women with or without adjustment for confounding variables
OR: odds ratio, CI: confidence interval.
aORs were calculated by logistic regression analysis for absence due to injury or disease after adjusting for age, chronic disease, smoking, and alcohol consumption.
bORs were calculated by logistic regression analysis for absence due to injury or disease after adjustment for age, chronic disease, smoking, alcohol consumption, industry classification, and workplace size.
DISCUSSION
This study shows that presenteeism affects injury and disease absence and that its effects are greater in men than women. The effects of sociodemographic factors on absence differed, and alcohol consumption did not show a significant effect on absence. Even when analyzed by sex, alcohol consumption was not significantly related to injury absence in men or women (p = 0.624 and p = 1.000, respectively), which contradicts the common belief that alcohol consumption is associated with work-related injury, but concurs with the results of other studies.12 Buvik et al.13 in a study of 1,940 working adults found that only 1%–2% experienced alcohol-related absence over one year. Differences in alcohol consumption or injury scale measures used in studies may have influenced results. Other studies have addressed the effects of alcohol consumption on workers and commonly reported that alcohol consumption can have adverse health-related effects and affect labor economics and productivity. Thus, alcohol consumption cannot be overlooked.14,15
On the other hand, smoking was found to be significantly related to injury absence in men (p < 0.001). Furthermore, significant relationships between smoking and disease absence were observed for men and women (both p <0.001). Smoking decreases bone density and reduces nutrition and healing of the musculoskeletal system by decreasing blood flow and oxygen supply. These mechanisms increase the risk of musculoskeletal injury and dose-dependently increase the intensity of musculoskeletal symptoms.16,17 Furthermore, smoking is known to increase the risk of work-related injury.18 Smoking, including exposure to secondhand smoke, is also a risk factor that significantly increases the burden of disease.19 Our results are consistent with previous reports on the effects of smoking.
Regarding occupational factors, industry classification was found to affect both presenteeism and injury and disease absence, and workplace size was found to affect injury absence significantly. These findings suggest that work characteristics such as workplace size, job demand, lack of replacement manpower, and the inability to do non-face-to-face work among health care workers affect presenteeism and absenteeism.7
The effect of presenteeism on disease absence was greater than that of injury absence, and this tendency did not change after stratification by sex. However, sex was found to have different effects on injury and disease absence. The same results were obtained for disease absence for men and women, but presenteeism had no significant effect on injury absence in women. We propose the following hypotheses to explain these results. First, work-related injuries are related to occupational types; for example, production workers experience more work-related injuries than office workers.10,20 Furthermore, the occupations of our male and female study subjects differed. More specifically, when workers were classified using the 9th KSIC, 39.6% of male workers were engaged in manufacturing and 25.7% in transportation and warehousing. On the other hand, 32.8% of female workers were engaged in manufacturing and 30.9% in health and social welfare services. As risks of injury depend on work type, the higher proportion of female workers in the service industry probably influenced our results. In addition, the majority of female healthcare workers were less than 40 years old. This difference in industry classification is considered to be the reason for the age difference observed between men and women. Second, a greater percentage of women are non-regular workers. According to Statistics Korea (KOSIS, 2015), the percentages of non-regular workers are 40.2% for women and 26.4% for men. Non-regular workers are not eligible for annual leave, and leave from work may be difficult for minor injuries. In our study, only 0.8% of women who experienced presenteeism reported injury absence.
The strength of this study is that it was conducted in multiple workplaces on workers subject to general health examinations under the National Health Insurance Act, whereas other studies on presenteeism focused on single workplaces. Therefore, the large sample size of the present study increases its clinical significance. Another strength is that a one-year interval was used to evaluate relations between presenteeism and absence. Previous cross-sectional studies did not show a causal relationship between presenteeism and absence, whereas this study verified the temporal direction of exposure and outcome. Our results suggest that presenteeism might be used as a predictive index for injury and disease absence. Also, absence was assessed by dividing it into 2 causes, that is, injury and disease, and it was confirmed that the effect of presenteeism depended on the cause of absence. In addition, stratification by sex showed the effects of presenteeism different in men and women.
Although our result shows that presenteeism influences absence, it does not elucidate the mechanism involved. However, we identified that presenteeism could lead to absence. The following mechanism can be inferred. There are several common health-related factors (such as smoking) that influence presenteeism and absence. A worker with poor health has to choose either presenteeism or absence. Workers are more likely to choose presenteeism over absence when they are in the acute phase of the disease or mild diseases. However, rest in these condition may be helpful for health recovery. Presenteeism does not provide enough rest, which can lead to missing the initial recovery period and aggravating the disease. Also, because poor health status is associated with reduced concentration and increased job strain, it may increase the risk of occupational injury.21,22
This study has another limitation. A dichotomous approach (yes/no) was used to determine experience of presenteeism, and thus, the existence of presenteeism was determined subjectively. We suggest additional objective studies be undertaken to evaluate the severity, frequency, and cause of presenteeism using a systematic scale. A study by Bergström et al.23 showed an increased risk of absenteeism of ≥ 30 days over the following 2 years when presenteeism exceeds 5 days. To devise management indicators of presenteeism aimed at preventing future absenteeism, additional studies are required.
CONCLUSIONS
In this study, presenteeism was found to increase future absenteeism, and this effect differed according to the cause of absence. Also, this study shows that the relationship between presenteeism and absenteeism is influenced by sex. The effect of presenteeism on injury and disease absence was greater in men than women, but no significant results were obtained for relations between presenteeism and injury absence among women.
-
Competing interests: The authors declare that they have no competing interests.
-
Author Contributions:
NOTES
- 1. Karanika-Murray M, Cooper CL. Presenteeism: an introduction to a prevailing global phenomenon. Updated 2018]. Accessed May 14, 2021]. http://irep.ntu.ac.uk/id/eprint/33625/1/8260_Karanika-Murray.pdf .
- 2. Taloyan M, Aronsson G, Leineweber C, Magnusson Hanson L, Alexanderson K, Westerlund H. Sickness presenteeism predicts suboptimal self-rated health and sickness absence: a nationally representative study of the Swedish working population. PLoS One 2012;7(9):e44721. 22984547.ArticlePubMedPMC
- 3. Boles M, Pelletier B, Lynch W. The relationship between health risks and work productivity. J Occup Environ Med 2004;46(7):737–745. 15247814.ArticlePubMed
- 4. Hemp P. Presenteeism: at work--but out of it. Harv Bus Rev 2004;82(10):49–58. 155. 15559575.PubMed
- 5. Lohaus D, Habermann W. Presenteeism: a review and research directions. Hum Resour Manage Rev 2019;29(1):43–58.Article
- 6. Bielecky A, Chen C, Ibrahim S, Beaton DE, Mustard CA, Smith PM. The impact of co-morbid mental and physical disorders on presenteeism. Scand J Work Environ Health 2015;41(6):554–564. 26392307.ArticlePubMed
- 7. Krane L, Larsen EL, Nielsen CV, Stapelfeldt CM, Johnsen R, Risør MB. Attitudes towards sickness absence and sickness presenteeism in health and care sectors in Norway and Denmark: a qualitative study. BMC Public Health 2014;14(1):880. 25160059.ArticlePubMedPMCPDF
- 8. Kim MS, Park JB, Min KB, Lee KJ, Kwon K. Presenteeism among self-employed workers: Korean working conditions survey. Ann Occup Environ Med 2014;26:32. 25852942.ArticlePubMedPMCPDF
- 9. Aronsson G, Gustafsson K, Dallner M. Sick but yet at work. An empirical study of sickness presenteeism. J Epidemiol Community Health 2000;54(7):502–509. 10846192.ArticlePubMedPMC
- 10. Leineweber C, Westerlund H, Hagberg J, Svedberg P, Alexanderson K. Sickness presenteeism is more than an alternative to sickness absence: results from the population-based SLOSH study. Int Arch Occup Environ Health 2012;85(8):905–914. 22270388.ArticlePubMedPDF
- 11. Allebeck P, Mastekaasa A. Swedish Council on Technology Assessment in Health Care (SBU). Chapter 5. Risk factors for sick leave - general studies. Scand J Public Health Suppl 2004;63:49–108. 15513654.PubMed
- 12. Veazie MA, Smith GS. Heavy drinking, alcohol dependence, and injuries at work among young workers in the United States labor force. Alcohol Clin Exp Res 2000;24(12):1811–1819. 11141040.ArticlePubMed
- 13. Buvik K, Moan IS, Halkjelsvik T. Alcohol-related absence and presenteeism: beyond productivity loss. Int J Drug Policy 2018;58:71–77. 29864644.ArticlePubMed
- 14. Cheng WJ, Huang MC, Cheng Y, Chen CH, Chen CJ. Consumption of alcoholic energy drinks is associated with work-related injury or disease among manual workers in Taiwan. Alcohol Alcohol 2015;50(4):458–462. 25780028.ArticlePubMed
- 15. Barnes AJ, Zimmerman FJ. Associations of occupational attributes and excessive drinking. Soc Sci Med 2013;92:35–42. 23849277.ArticlePubMedPMC
- 16. Lincoln AE, Smith GS, Amoroso PJ, Bell NS. The effect of cigarette smoking on musculoskeletal-related disability. Am J Ind Med 2003;43(4):337–349. 12645091.ArticlePubMedPMC
- 17. Lee JJ, Patel R, Biermann JS, Dougherty PJ. The musculoskeletal effects of cigarette smoking. J Bone Joint Surg Am 2013;95(9):850–859. 23636193.ArticlePubMed
- 18. Jang SW, Kim HC, Kim JH, Kim MS, Won Y, Ju H, et al. Association between nicotine dependency with occupational injury in Korean men. Ann Occup Environ Med 2021;33:e14. 34754475.ArticlePubMedPMCPDF
- 19. Lim SS, Vos T, Flaxman AD, Danaei G, Shibuya K, Adair-Rohani H, et al. A comparative risk assessment of burden of disease and injury attributable to 67 risk factors and risk factor clusters in 21 regions, 1990-2010: a systematic analysis for the Global Burden of Disease Study 2010. Lancet 2012;380(9859):2224–2260. 23245609.PubMedPMC
- 20. Bhattacherjee A, Chau N, Sierra CO, Legras B, Benamghar L, Michaely JP, et al. Relationships of job and some individual characteristics to occupational injuries in employed people: a community-based study. J Occup Health 2003;45(6):382–391. 14676418.ArticlePubMedPDF
- 21. Johns G. Presenteeism in the workplace: a review and research agenda. J Organ Behav 2010;31(4):519–542.ArticlePDF
- 22. Kim HC, Min JY, Min KB, Park SG. Job strain and the risk for occupational injury in small- to medium-sized manufacturing enterprises: a prospective study of 1,209 Korean employees. Am J Ind Med 2009;52(4):322–330. 19142960.ArticlePubMed
- 23. Bergström G, Bodin L, Hagberg J, Aronsson G, Josephson M. Sickness presenteeism today, sickness absenteeism tomorrow? A prospective study on sickness presenteeism and future sickness absenteeism. J Occup Environ Med 2009;51(6):629–638. 19448572.ArticlePubMed
REFERENCES
REFERENCES
Figure & Data
REFERENCES
Citations
Citations to this article as recorded by 
- Present but Overlooked: A Scoping Review of Instruments and Approaches for Measuring Presenteeism Related to Alcohol, Tobacco, and Drug Use
Kirrilly Thompson, Md Abdul Ahad, Gianluca Di Censo, Sonia Hines, Nicholas Rich, Alice McEntee, Jacqueline Bowden
Journal of Occupational Rehabilitation.2026; 36(1): 331. CrossRef - ‘Just part of the job’ – understanding work‐related injuries and safety culture in companion animal veterinary practices
J. S. P. Tulloch, I. Schofield, R. Jackson, M. Whiting
Journal of Small Animal Practice.2026; 67(3): 212. CrossRef - Can presenteeism predict future absenteeism? Evidence from the Korean Health Panel Study
Yoonjung Ji, Wonhee Baek, Ari Min
BMC Public Health.2026;[Epub] CrossRef - Number of side jobs and self-reported occupational injuries or diseases risk among young workers: a cross-sectional study in Japan
Takahiro Mori, Tomohisa Nagata, Kiminori Odagami, Koji Mori
Safety Science.2025; 192: 106982. CrossRef - Association between sickness presenteeism and depressive symptoms: a cross-sectional study using the 6th Korean working conditions survey
Myeong-Hun Lim, Min-Seok Kim, Seong-Uk Baek, Tae-Yeon Kim, Jong-Uk Won, Jin-Ha Yoon
International Archives of Occupational and Environmental Health.2024; 97(5): 537. CrossRef - Self-Esteem Trajectories After Occupational Injuries and Diseases and Their Relation to Changes in Subjective Health: Result From the Panel Study of Workers’ Compensation Insurance (PSWCI)
Seong-Uk Baek, Won-Tae Lee, Min-Seok Kim, Myeong-Hun Lim, Jin-Ha Yoon, Jong-Uk Won
Journal of Korean Medical Science.2023;[Epub] CrossRef
 Cite
CiteImpacts of presenteeism on work-related injury absence and disease absence
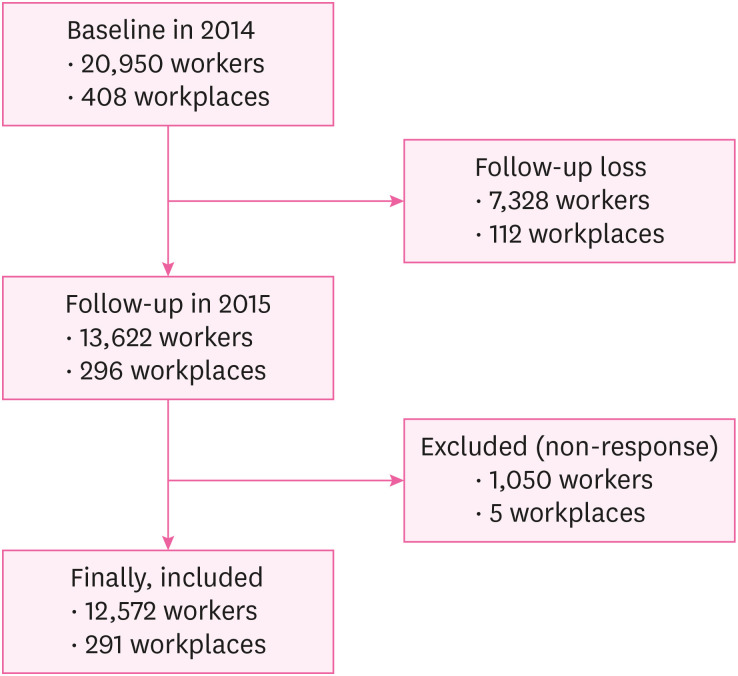
Fig. 1 Flow chart of the study population and follow-up.
Fig. 1
Impacts of presenteeism on work-related injury absence and disease absence
| Characteristics | Presenteeism | Total | ||||
|---|---|---|---|---|---|---|
| Yes | No | |||||
| No. of subject | 2,823 (22.5) | 9,749 (77.5) | 12,572 (100.0) | |||
| General characteristics | ||||||
| Sex | < 0.001 | |||||
| Male | 1,681 (17.7) | 7,841 (82.3) | 9,522 (100.0) | |||
| Female | 1,142 (37.4) | 1,908 (62.6) | 3,050 (100.0) | |||
| Age (yr) | < 0.001 | |||||
| < 30 | 606 (31.2) | 1,338 (68.8) | 1,944 (100.0) | |||
| 30–39 | 1,015 (27.2) | 2,722 (72.8) | 3,737 (100.0) | |||
| 40–49 | 728 (20.2) | 2,871 (79.8) | 3,599 (100.0) | |||
| 50–59 | 448 (14.7) | 2,595 (85.3) | 3,043 (100.0) | |||
| > 59 | 26 (10.4) | 223 (89.6) | 249 (100.0) | |||
| Chronic disease | 0.001 | |||||
| No | 2,406 (23.0) | 8,046 (77.0) | 10,452 (100.0) | |||
| Yes | 417 (19.7) | 1,703 (80.3) | 2,120 (100.0) | |||
| Smoking | < 0.001 | |||||
| Never smoker | 1,412 (26.7) | 3,880 (73.3) | 5,292 (100.0) | |||
| Former smoker | 443 (15.7) | 2,376 (84.3) | 2,819 (100.0) | |||
| Current smoker | 968 (21.7) | 3,493 (78.3) | 4,461 (100.0) | |||
| Alcohol consumption (time/week) | 0.208 | |||||
| 0–2 | 2,339 (22.6) | 8,033 (77.4) | 10,372 (100.0) | |||
| 3–4 | 391 (21.3) | 1,442 (78.7) | 1,833 (100.0) | |||
| 5–6 | 93 (25.3) | 274 (74.7) | 367 (100.0) | |||
| Occupational characteristics | ||||||
| Industry classification | < 0.001 | |||||
| Manufacturing | 1,150 (24.1) | 3,622 (75.9) | 4,772 (100.0) | |||
| Water, sewage and waste treatment, raw material recycling | 3 (15.0) | 17 (85.0) | 20 (100.0) | |||
| Construction industry | 2 (14.3) | 12 (85.7) | 14 (100.0) | |||
| Wholesale and retail | 32 (13.8) | 200 (86.2) | 232 (100.0) | |||
| Transport and warehousing | 387 (15.2) | 2,152 (84.8) | 2,539 (100.0) | |||
| Information and communication business | 41 (17.4) | 194 (82.6) | 235 (100.0) | |||
| Professional, scientific and technical services | 81 (23.8) | 260 (76.2) | 341 (100.0) | |||
| Business facility management, business support and rental service business | 468 (27.5) | 1,232 (72.5) | 1,700 (100.0) | |||
| Public administration, defense and social security administration | 25 (12.7) | 172 (87.3) | 197 (100.0) | |||
| Education service industry | 8 (21.1) | 30 (78.9) | 38 (100.0) | |||
| Health industry and social welfare service industry | 485 (40.3) | 717 (59.7) | 1,202 (100.0) | |||
| Associations and organizations, repair and other personal service businesses | 141 (11.0) | 1,141 (89.0) | 1,282 (100.0) | |||
| Size of the workplace | 0.506 | |||||
| Less than 300 | 912 (22.8) | 3,085 (77.2) | 3,997 (100.0) | |||
| 300 or more | 1,911 (22.3) | 6,664 (77.7) | 8,575 (100.0) | |||
| Characteristics | Injury absence | Total | ||||
|---|---|---|---|---|---|---|
| Yes | No | |||||
| No. of subject | 219 (1.7) | 12,353 (98.3) | 12,572 (100.0) | |||
| Presenteeism | < 0.001 | |||||
| No | 129 (1.3) | 9,620 (98.7) | 9,749 (100.0) | |||
| Yes | 90 (3.2) | 2,733 (96.8) | 2,823 (100.0) | |||
| General characteristics | ||||||
| Sex | < 0.001 | |||||
| Male | 194 (2.0) | 9,328 (98.0) | 9,522 (100.0) | |||
| Female | 25 (0.8) | 3,025 (99.2) | 3,050 (100.0) | |||
| Age (yr) | 0.087 | |||||
| < 30 | 26 (1.3) | 1,918 (98.7) | 1,944 (100.0) | |||
| 30–39 | 59 (1.6) | 3,678 (98.4) | 3,737 (100.0) | |||
| 40–49 | 60 (1.7) | 3,539 (98.3) | 3,599 (100.0) | |||
| 50–59 | 70 (2.3) | 2,973 (97.7) | 3,043 (100.0) | |||
| > 59 | 4 (1.6) | 245 (98.4) | 249 (100.0) | |||
| Chronic disease | 0.706 | |||||
| No | 180 (1.7) | 10,272 (98.3) | 10,452 (100.0) | |||
| Yes | 39 (1.8) | 2,081 (98.2) | 2,120 (100.0) | |||
| Smoking | < 0.001 | |||||
| Never smoker | 56 (1.1) | 5,236 (98.9) | 5,292 (100.0) | |||
| Former smoker | 45 (1.6) | 2,774 (98.4) | 2,819 (100.0) | |||
| Current smoker | 118 (2.6) | 4,434 (99.4) | 4,461 (100.0) | |||
| Alcohol consumption (time/week) | 0.297 | |||||
| 0–2 | 172 (1.7) | 10,200 (98.3) | 10,372 (100.0) | |||
| 3–4 | 39 (2.1) | 1,794 (97.9) | 1,833 (100.0) | |||
| 5–6 | 8 (2.2) | 359 (97.8) | 367 (100.0) | |||
| Occupational characteristics | ||||||
| Industry classification | < 0.001 | |||||
| Manufacturing | 112 (2.3) | 4,660 (97.7) | 4,772 (100.0) | |||
| Water, sewage and waste treatment, raw material recycling | 0 (0.0) | 20 (100.0) | 20 (100.0) | |||
| Construction industry | 0 (0.0) | 14 (100.0) | 14 (100.0) | |||
| Wholesale and retail | 2 (0.9) | 230 (99.1) | 232 (100.0) | |||
| Transport and warehousing | 56 (2.2) | 2,483 (97.8) | 2,539 (100.0) | |||
| Information and communication business | 0 (0.0) | 235 (100.0) | 235 (100.0) | |||
| Professional, scientific and technical services | 3 (0.9) | 338 (99.1) | 341 (100.0) | |||
| Business facility management, business support and rental service business | 31 (1.8) | 1,669 (98.2) | 1,700 (100.0) | |||
| Public administration, defense and social security administration | 2 (1.0) | 195 (99.0) | 197 (100.0) | |||
| Education service industry | 1 (2.6) | 37 (97.4) | 38 (100.0) | |||
| Health industry and social welfare service industry | 6 (0.5) | 1,196 (99.5) | 1,202 (100.0) | |||
| Associations and organizations, repair and other personal service businesses | 6 (0.5) | 1,276 (99.5) | 1,282 (100.0) | |||
| Size of the workplace | 0.011 | |||||
| Less than 300 | 87 (2.2) | 3,910 (97.8) | 3,997 (100.0) | |||
| 300 or more | 132 (1.5) | 8,443 (98.5) | 8,575 (100.0) | |||
| Characteristics | Disease absence | Total | ||||
|---|---|---|---|---|---|---|
| Yes | No | |||||
| No. of subject | 410 (3.3) | 12,162 (96.7) | 12,572 (100.0) | |||
| Presenteeism | < 0.001 | |||||
| No | 174 (1.8) | 9,575 (98.2) | 9,749 (100.0) | |||
| Yes | 236 (8.4) | 2,587 (91.6) | 2,823 (100.0) | |||
| General characteristics | ||||||
| Sex | 0.378 | |||||
| Male | 303 (3.2) | 9,219 (96.8) | 9,522 (100.0) | |||
| Female | 107 (3.5) | 2,943 (96.5) | 3,050 (100.0) | |||
| Age (yr) | 0.265 | |||||
| < 30 | 75 (3.9) | 1,869 (96.1) | 1,944 (100.0) | |||
| 30–39 | 126 (3.4) | 3,611 (96.6) | 3,737 (100.0) | |||
| 40–49 | 109 (3.0) | 3,490 (97.0) | 3,599 (100.0) | |||
| 50–59 | 96 (3.2) | 2,947 (96.8) | 3,043 (100.0) | |||
| > 59 | 4 (1.6) | 245 (98.4) | 249 (100.0) | |||
| Chronic disease | 0.639 | |||||
| No | 337 (3.2) | 10,115 (96.8) | 10,452 (100.0) | |||
| Yes | 73 (3.4) | 2,047 (96.6) | 2,120 (100.0) | |||
| Smoking | < 0.001 | |||||
| Never smoker | 146 (2.8) | 5,146 (97.2) | 5,292 (100.0) | |||
| Former smoker | 77 (2.7) | 2,742 (97.3) | 2,819 (100.0) | |||
| Current smoker | 187 (4.2) | 4,274 (95.8) | 4,461 (100.0) | |||
| Alcohol consumption (time/week) | 0.052 | |||||
| 0–2 | 320 (3.1) | 10,052 (96.9) | 10,372 (100.0) | |||
| 3–4 | 74 (4.0) | 1,759 (96.0) | 1,833 (100.0) | |||
| 5–6 | 16 (4.4) | 351 (95.6) | 367 (100.0) | |||
| Occupational characteristics | ||||||
| Industry classification | < 0.001 | |||||
| Manufacturing | 241 (5.1) | 4,531 (94.9) | 4,772 (100.0) | |||
| Water, sewage and waste treatment, raw material recycling | 0 (0.0) | 20 (100.0) | 20 (100.0) | |||
| Construction industry | 0 (0.0) | 14 (100.0) | 14 (100.0) | |||
| Wholesale and retail | 9 (3.9) | 223 (96.1) | 232 (100.0) | |||
| Transport and warehousing | 52 (2.0) | 2,487 (98.0) | 2,539 (100.0) | |||
| Information and communication business | 1 (0.4) | 234 (99.6) | 235 (100.0) | |||
| Professional, scientific and technical services | 17 (5.0) | 324 (95.0) | 341 (100.0) | |||
| Business facility management, business support and rental service business | 48 (2.8) | 1,652 (97.2) | 1,700 (100.0) | |||
| Public administration, defense and social security administration | 2 (1.0) | 195 (99.0) | 197 (100.0) | |||
| Education service industry | 2 (5.3) | 36 (94.7) | 38 (100.0) | |||
| Health industry and social welfare service industry | 26 (2.2) | 1,176 (97.8) | 1,202 (100.0) | |||
| Associations and organizations, repair and other personal service businesses | 12 (0.9) | 1,270 (99.1) | 1,282 (100.0) | |||
| Size of the workplace | 0.473 | |||||
| Less than 300 | 137 (3.4) | 3,860 (96.6) | 3,997 (100.0) | |||
| 300 or more | 273 (3.2) | 8,302 (96.8) | 8,575 (100.0) | |||
| Presenteeism | Injury absence | Disease absence | ||||
|---|---|---|---|---|---|---|
| Unadjusted OR (95% CI) | Adjusted ORa (95% CI) | Adjusted ORb (95% CI) | Unadjusted OR (95% CI) | Adjusted ORa (95% CI) | Adjusted ORb (95% CI) | |
| No | 1 | 1 | 1 | 1 | 1 | 1 |
| Yes | 2.456 (1.870–3.225) | 2.996 (2.260–3.971) | 2.705 (2.044–3.581) | 5.020 (4.108–6.135) | 5.176 (4.227–6.338) | 4.906 (3.996–6.024) |
| Variables | Men | Women | |||||
|---|---|---|---|---|---|---|---|
| Unadjusted OR (95% CI) | Adjusted ORa (95% CI) | Adjusted ORb (95% CI) | Unadjusted OR (95% CI) | Adjusted ORa (95% CI) | Adjusted ORb (95% CI) | ||
| Injury absence | |||||||
| Presenteeism | |||||||
| No | 1 | 1 | 1 | 1 | 1 | 1 | |
| Yes | 3.387 (2.532–4.530) | 3.204 (2.391–4.293) | 3.035 (2.258–4.081) | 1.115 (0.499–2.490) | 1.336 (0.588–3.032) | 1.322 (0.577–3.028) | |
| Disease absence | |||||||
| Presenteeism | |||||||
| No | 1 | 1 | 1 | 1 | 1 | 1 | |
| Yes | 5.990 (4.747–7.559) | 5.740 (4.543–7.253) | 5.508 (4.340–6.989) | 3.601 (2.388–5.430) | 3.629 (2.405–5.475) | 3.629 (2.405–5.475) | |
Table 1 Sociodemographic and occupational characteristics of the study subjects
Values are presented as number (%).
a
Table 2 Sociodemographic and occupational characteristics of the study subjects according to absence due to injury
Values are presented as number (%).
a
Table 3 Sociodemographic and occupational characteristics of the study subjects according to absence due to disease
Values are presented as number (%).
a
Table 4 Associations between presenteeism with or without adjustment for confounding variables and absence due to injury or disease
OR: odds ratio, CI: confidence interval.
aORs were calculated by logistic regression analysis for absence due to injury or disease after adjusting for sex, age, chronic disease, smoking, and alcohol consumption.
bORs were calculated by logistic regression analysis for absence due to injury or disease after adjusting for sex, age, chronic disease, smoking, alcohol consumption, industry classification, and workplace size.
Table 5 Associations between presenteeism and absence due to injury or disease in men and women with or without adjustment for confounding variables
OR: odds ratio, CI: confidence interval.
aORs were calculated by logistic regression analysis for absence due to injury or disease after adjusting for age, chronic disease, smoking, and alcohol consumption.
bORs were calculated by logistic regression analysis for absence due to injury or disease after adjustment for age, chronic disease, smoking, alcohol consumption, industry classification, and workplace size.

