
Articles
- Page Path
- HOME > Ann Occup Environ Med > Volume 34; 2022 > Article
- Original Article Population attributable fraction of indicators for musculoskeletal diseases: a cross-sectional study of fishers in Korea
-
Jaehoo Lee1,2
 , Bohyun Sim1,2, Bonggyun Ju1,2, Chul Gab Lee1, Ki-Soo Park3,4, Mi-Ji Kim3,4, Jeong Ho Kim5,6, Kunhyung Kim5,6, Hansoo Song1,2
 -
Annals of Occupational and Environmental Medicine 2022;34:e23.
DOI: https://doi.org/10.35371/aoem.2022.34.e23
Published online: September 7, 2022
1Department of Occupational and Environmental Medicine, Chosun University Hospital, Gwangju, Korea.
2Center for Fishermen’s Safety and Health, Chosun University Hospital, Gwangju, Korea.
3Department of Preventive Medicine, College of Medicine and Institute of Health Science, Gyeongsang National University, Jinju, Korea.
4Center for Fishermen’s Safety and Health, Gyeongsang National University Hospital, Jinju, Korea.
5Department of Occupational and Environmental Medicine & Institute of Environmental and Occupational Medicine, Inje University Busan Paik Hospital, Busan, Korea.
6Center for Fishermen’s Safety and Health, Inje University Busan Paik Hospital, Busan, Korea.
- Correspondence: Hansoo Song. Department of Occupational and Environmental Medicine, Chosun University Hospital, 365 Pilmun-daero, Dong-gu, Gwangju 61453, Korea. oemsong@chosun.ac.kr
• Received: April 22, 2022 • Revised: July 26, 2022 • Accepted: August 12, 2022
Copyright © 2022 Korean Society of Occupational & Environmental Medicine
This is an Open Access article distributed under the terms of the Creative Commons Attribution Non-Commercial License (https://creativecommons.org/licenses/by-nc/4.0/) which permits unrestricted non-commercial use, distribution, and reproduction in any medium, provided the original work is properly cited.
Abstract
-
Background The musculoskeletal disease (MSD) burden is an important health problem among Korean fishers. We aimed to investigate the indicators of the prevalence of MSD and contributions of significant indicators to MSD in Korean fishers.
-
Methods This cross-section study included 927 fishers (male, 371; female, 556) aged 40 to 79 years who were enrolled from 3 fishery safety and health centers. The outcome variable was one-year prevalence of MSD in 5 body parts (the neck, shoulder, hand, back, and knee). Independent variables were sex, age, educational attainment, household income, job classification, employment xlink:type, hazardous working environment (cold, heat, and noise), ergonomic risk by the 5 body parts, anxiety disorder, depression, hypertension, diabetes, and hyperlipidemia. The adjusted odds ratio of MSDs by the 5 body parts were calculated using multiple logistic regression analysis. We computed the population attributable fraction (PAF) for each indicators of MSDs using binary regression models.
-
Results The one-year prevalence of MSD in the neck, shoulder, hand, back, and knee was 7.8%, 17.8%, 7.8%, 27.2%, and 16.2% in males vs. 16.4%, 28.1%, 23.0%, 38.7%, and 30.0% in females, respectively. The ergonomic risk PAF according to the body parts ranged from 22.8%–59.6% in males and 22.8%–50.3% in female. Mental diseases showed a significant PAF for all body parts only among female (PAF 9.1%–21.4%). Cold exposure showed a significant PAF for the neck, shoulder, and hand MSD only among female (25.6%–26.8%). Age was not a significant indicator except for the knee MSD among female.
-
Conclusions Ergonomic risk contributed majorly as indicators of MSDs in both sexes of fishers. Mental disease and cold exposure were indicators of MSDs only among female fishers. This information may be important for determining priority risk groups for the prevention of work-related MSD among Korean fishers.
BACKGROUND
Although musculoskeletal disease (MSD) is non-fatal, it is an important public health problem because it accounts for a high proportion of the years lived with disability in South Korea.1 The direct and indirect costs of MSD was 9.0% of the Korean gross domestic product, and highest among the 20–64 years old working group.2 Therefore occupation-based approach is important for preventing MSD. Manufacturing, construction, hotel and restaurants, education, wholesale and retail, public administration and defense,3 and agricultural/fishery workers4 are high-risk work sector groups for MSD. However, the MSD among small-scale self-employed agricultural and fishery workers has received less attention compared to that among employed workers. In particular, in the fishery industry, MSD is relatively unknown, and the related research is few. However, some previous studies have shown that fisher’s MSD are very serious. In Sweden, the United States, United Kingdom, and Sri Lanka, the prevalence of low back pain of 50%–80% has been reported.5 A cohort study of MSD in Danish fishermen, using hospitalization data, reported a high incidence of knee arthrosis, thoracolumbar disc disease, carpal tunnel syndrome.6 In our previous study, the prevalence of collapsed lumbar disc in fishers aged 40–69 years was 23.7%.7 Fishers include those working in fishing vessel fishery, aquaculture, diving, and seafood processing. The fishers’ exposures vary in ergonomic stress, including net or line pulling, heavy manual lifting, and repetitive hand exertion. In addition, fishery is known as a very high-risk occupation with fatal and no-fatal injuries. Most of the previous studies on MSDs have focused only on relative risk, and few studies have revealed how much disease can be prevented when risk factors are remove.8,9 Therefore, this study aimed to determine the indicators of MSD among fishers, an occupation at high-risk of MSD, and identify the association between major indicators and MSD. Furthermore, we calculated the extent to which significant indicators contribute to MSD, to determine the priority of prevention.
METHODS
In this cross-sectional study, 957 fishers from 3 fishery safety and health centers funded by Ministry of Oceans and Fisheries voluntarily participated in a fisher’s health survey, from June 2018 to August 2020. The inclusion criteria were subjects aged 40–79 years whose occupation could be identified as fishery. Accordingly, 22, 3, 3, and 2 subjects aged < 40 years, > 80 years, with unclear occupations, and insufficient questionnaire details, respectively, were excluded. Finally, a total of 927 subjects were included in the study.
Data were collected through a questionnaire and medical examination. The dependent variable, MSD in 5 body parts (the neck, shoulders, hands, back, and knees), was defined as an experience of pain of > 1 week or > 1 per month, moderate pain intensity or higher, and an experience of medical care during the past 1 year using the musculoskeletal symptom questionnaire developed by the Korea Occupational Safety and Health Agency (KOSHA).10 Independent variables included sex, age, household income, employment xlink:type, job classification, cold exposure,11 noise exposure,11 heat exposure,11 ergonomic risk in the 5 body parts, mental disease (depression, anxiety) obtained by questionnaire (Supplementary Table 1), and chronic diseases (hypertension, diabetes mellitus, hyperlipidemia) obtained by medical examination and medication history. Household income was divided into quartiles. Employment was divided into owner (self-employed), owner’s household members, and employees. Cold, heat, and noise exposure were divided into either no exposure or 3 additional categories by counting the number of days of > 2 hours daily exposure, over the past year (Supplementary Data 1). Job classification were as follows: aquaculture (shellfish, fish, and seaweeds); and fishing vessel fishery (with trap gill net, long line, Haenyeo [Korean female sea divers], and oyster shucker). For comparison between job classifications, aquaculture (shellfish), with a higher income level and fishery mechanization rate, was used as the reference. Depression was defined using Patient Health Questionaire-9 (cut-off point 10).12 Anxiety disorder was defined using the Generalized Anxiety Disorder 7-item (cut-off point 6).13 Ergonomic risk was investigated using a structured face-to-face questionnaire. Ergonomic risk factors composed of the intensity of the task, average daily working hours, and number of working days during the recent year. We identified ergonomic risk for each of 5 body parts (the neck, shoulders, hands, back, knees). A total ergonomic risk score was calculated by the following formula: A Score (point) = The Intensity of the Task (mild = 0.5, moderate = 1.0, severe = 1.5) × Average Daily Working Hours (< 2 hours = 1, 2–3 hours = 2, 4–5 hours = 3, 6–7 hours = 4, ≥ 8 hours = 5) × number of working days during the recent year. A score of ≥ 250 was defined as a significant musculoskeletal burden task. A 250-point score implies that the fishers had continuously performed an average of 2 hours of work per day for the last year. Hypertension was defined based on a systolic blood pressure ≥ 140 mmHg or diastolic blood pressure ≥ 90 mmHg. Diabetes mellitus was defined based on hemoglobin A1c ≥ 6.5% or fasting blood glucose ≥ 126 mg/dL. Hyperlipidemia was defined based on a low-density lipoprotein cholesterol level ≥ 150 mg/dL or triglyceride ≥ 500 mg/dL or total cholesterol minus high-density lipoprotein ≥ 190 mg/dL. Patients with hypertension, diabetes mellitus, and hyperlipidemia included those who had been on medications.
A χ2 test was performed to evaluate the univariate association between ergonomic risk and MSDs. To find valuable and clear indicators for comparative analysis by MSDs xlink:type and sex, odds ratios (ORs) and 95% confidence intervals (CIs) were calculated for model 1 (adjusted for sex and age) and model 2 (adjusted for major variables) using binary multiple logistic regression analysis. To assess the population attributable risk (PAR) and 95% CI of significant indicators, we used STATA module as described by Newson to compute PARs from binary regression models.14 PAR was calculated as the difference in prevalence between scenario-0 (when exposed to all harmful factors) and scenario-1 (when each of the harmful factors was excluded). Furthermore, the prevalence was calculated for each condition, and PAR was obtained from the difference. The population attributable fraction (PAF) of each indicators of MSDs was calculated as follows.
For statistical analysis, STATA 16 version (StataCorp LLC., College Station, TX, USA) was used.
The protocol of this study was reviewed and approved by the Institutional Review Board of Chosun University Hospital (approval No. CHOSUN 2018-5-014). Informed consent was obtained in writing from the study subjects.
RESULTS
Table 1 shows the characteristics of the study subjects. A total of 927 subjects (mean age: 61.1, standard deviation: 8.0 years, with no significant difference by sex), 371 (40%) male, and 556 (60%) female were included in this analysis. By sex, there was a statistically significant difference in educational attainment, highest among high school male (47.4%) and elementary school female (42.6%); household income, with the highest of 40 million won among male (34.5%) than female (16.7%); employment xlink:type, highest among male owners (77.4%) and female household members (38.7%); and by job classification, Haenyeo were all female while the female proportion among oyster shucker was 87.3%. In the hazardous working environment, males are more exposed to cold (69.0%), heat (57.5%), and noise (35.8%) than their female counterparts. By sex, male and female differed significantly in diabetes mellitus (22.5% vs. 13.1%) and depression prevalence (8.9% vs. 16.7%), respectively.
Table 1
Characteristic of subjects
Values are presented as number (%). The p-value by χ2 test.
aA: Aquaculture (shellfish), B: Aquaculture (fish), C: Aquaculture (seaweeds), D: Fishing vessel fishery with trap gill net, E: Fishing vessel fishery with long line, F: Haenyeo (Korean female sea diver), G: Oyster shucker. bLow temperatures, whether indoors or outdoors. cNoise that is loud enough to raise your voice when speaking to others. dTemperatures high enough to make you sweat even when you are not working. eIf patient has hypertension and/or diabetes mellitus. fIf the patient has depression and/or anxiety disorder.
Table 2 shows the prevalence of MSDs by the 5 body parts according to each variable. Female showed a higher prevalence of MSDs in all body parts than male (p < 0.05 by χ2 test). By age, significant difference was observed in the knees MSD prevalence only (p < 0.05 by χ2 test), which was lowest in those aged 40–49 years (17.1%) and highest in those aged 60–69 years (27.3%). The prevalence of neck, back, and knees MSD decreased at higher educational attainment. As household income increased, the prevalence of MSDs decreased in all body parts except the neck. By employment xlink:type, the prevalence was lowest among owners in all body parts. As the ergonomic risk increased, the prevalence of MSD in all body parts increased significantly. As the duration of exposure to cold increased, the prevalence of MSD in the hands, back, and knees increased significantly. The effects of cold exposure may have been confounded by outdoor work.
Table 2
The association between variables and musculoskeletal disease of 5 body parts
The p-value by χ2 test in employment xlink:type, job classification, chronic disease, hypertension, diabetes mellitus, hyperlipidemia, mental disease, depression, anxiety disorder. The p-value by Cochran-Armitage trend test in age, educational attainment, household income, cold exposure, noise exposure, heat exposure.
aA: Aquaculture (shellfish), B: Aquaculture (fish), C: Aquaculture (seaweeds), D: Fishing vessel fishery with trap gill net, E: Fishing vessel fishery with long line, F: Haenyeo (Korean female sea diver), G: Oyster shucker. bIf patient has hypertension and/or diabetes mellitus. cIf patient has depression and/or anxiety disorder.
Therefore, we tried to confirm whether cold exposure was related to musculoskeletal disorders through sensitivity analysis including heat exposure. However, there was no dose-response association of noise and heat exposure with MSD. Chronic diseases including hypertension, diabetes mellitus, and hyperlipidemia were not associated with MSDs. On the contrary, the prevalence of the back and knees MSD was lower in patients with diabetes mellitus. Mental diseases including depression and anxiety disorder significantly increased the prevalence of MSDs in all body parts. We presented the results by sex in Supplementary Tables 2 and 3, respectively.
Table 3 shows the age and sex adjusted ORs and 95% CIs for MSDs of the 5 body parts using binary logistic regression (model 1). Educational attainment showed a significant relationship with back MSD. Fishers with lower educational attainment had higher OR of MSDs in the back. According to the job classification, neck MSD had significantly higher ORs in aquaculture (fish), fishing vessel fishery with long line, and oyster shucker, in hand MSD. Knees MSD had significantly higher OR in aquaculture (seaweeds) and fishing vessel fishery with long line. In particular, the fishing vessel fishery with trap gill net and Haenyeo showed a low OR overall. Ergonomic risk point grade showed a dose-response relationship with MSDs in all body parts. Mental diseases showed a significant association with MSDs in all body parts. Cold exposure showed an association with MSDs in neck and hands MSD. We presented the results by sex in Supplementary Tables 4 and 5, respectively.
Table 3
Age, sex adjusted multiple logistic regression analysis (model 1)
OR: odds ratio; CI: confidence interval.
aA: Aquaculture (shellfish), B: Aquaculture (fish), C: Aquaculture (seaweeds), D: Fishing vessel fishery with trap gill net, E: Fishing vessel fishery with long line, F: Haenyeo (Korean female sea diver), G: Oyster shucker. bIf patient has hypertension and/or diabetes mellitus. cIf patient has depression and/or anxiety disorder.
Table 4 shows the adjusted OR by ergonomic risk, age, educational attainment, mental diseases, and cold exposure for MSDs in the relevant body parts by sex, respectively (model 2). In both sexes, significant OR occurred in all body parts with ergonomic risk. The adjusted OR of the highest ergonomic risk point grade (≥ 750 points) in male occurred with the neck 6.28 (95% CI: 1.92–20.51); shoulders 6.18 (95% CI: 2.83–13.46); hands 4.05 (95% CI: 1.29–12.71); back 5.86 (95% CI: 2.83–12.10); and knees 3.07 (95% CI: 1.35–6.97). The OR of the highest ergonomic risk point grade (≥ 750 points) in female occurred with the neck 3.41 (95% CI: 1.77–6.57); shoulder 3.28 (95% CI: 1.87–5.77); hands 4.69 (95% CI: 2.64–8.34); back 4.06 (95% CI: 2.40–6.88); and knees 2.87 (95% CI: 1.66–4.96). The OR of mental diseases in female occurred with the neck 3.56 (95% CI: 2.07–6.12); shoulder 3.18 (95% CI: 1.96–5.15); hands 3.05 (95% CI: 1.83–5.10); back 2.58 (95% CI: 1.58–4.23); and knees 2.10 (95% CI: 1.31–3.39). The OR of cold exposure in female occurred with the neck 2.11 (95% CI: 1.04–4.29); shoulder 2.49 (95% CI: 1.38–4.51); and hands 3.31 (95% CI: 1.77–6.20). Knee MSD showed a significant association with educational attainment in male and age in female. MSDs showed no significant association with age, mental health, and cold exposure in male; and educational attainment in female.
Table 4
Adjusted OR of major 5 potential indicators by multiple logistic regression by sex (model 2)
Table 5 shows the PAR and PAF and their 95% CIs for MSDs in the relevant body parts, including the indicators according to sex, respectively. PAF of age in female was 48.0% (95% CI: 17.0–70.7) in the knees. PAF of educational attainment in male was 36.4% (95% CI: 13.2–50.2) in knee. PAF of ergonomic risk in male was 59.6% (95% CI: 2.2–7.1) in the neck, 40.2% (95% CI: 3.9–10.4) in shoulders, 48.6% (95% CI: 26.0–56.5) in hands, 50.3% (95% CI: 40.1–57.1) in back, and 22.8% (95% CI: 1.9–35.4) in knees. PAF of ergonomic risk in female was 35.6% (95% CI: 18.8–46.6) in neck, 24.1% (95% CI: 11.1–34.0) in shoulders, 42.2 (95% CI: 28.9–51.5) in hands, 33.7% (95% CI: 22.2–42.8) in back, and 15.9% (95% CI: 5.2–24.1) in knees. PAF of cold exposure in female was 26.8% (95% CI: 6.6–40.5) in neck, 25.6% (95% CI: 13.3–36.6) in shoulders, and 26.1 (95% CI:11.1–37.7) in hand. PAF of mental diseases in female was 21.4% (95% CI: 13.3–26.5) in neck, 14.9% (95% CI: 9.6–18.8) in shoulders, 15.0 (95% CI: 8.6–19.6) in hands, 9.1% (95% CI: 4.8–12.6) in back, and 9.2% (95% CI: 3.5–13.6) in knees.
Table 5
PAR and PAF of indicators for 5 body parts musculoskeletal diseases by sex
Fig. 1 shows the PAF of MSDs among fishers by sex. The colored bars refer to modifiable factors. In male with MSDs, a contribution of 40.2%–69.1% was shown according to body parts. In Female with MSDs, a contribution of 42.8%–83.8% was shown.
Fig. 1
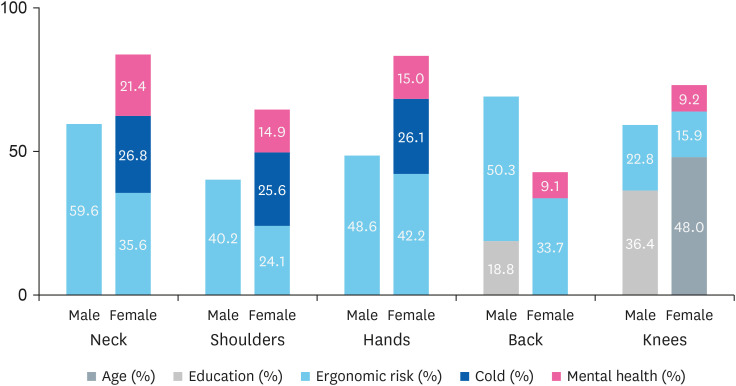
Population attributable fraction of indicators for MSD among fishers by sex. Subject number of MSD by sex (male, female): Neck (29, 91) Shoulder (66, 156) Hands (29, 128) Back (101, 215) Knees (60, 167). Colored bar: modifiable indicators. Grey bar: non-modifiable indicators.
MSD: musculoskeletal disease.
DISCUSSION
In sex and age-adjusted multiple logistic regression model, significant indicators associated with MSDs were educational attainment, job classification, ergonomic risk, cold exposure, heat exposure, and mental diseases (Table 4). In the final binary logistic regression and PAF estimation by sex, heat exposure had some significant results but was excluded because the OR of MSDs increased in the non-exposed group. We included ergonomic risk instead of job classification because 2 variables overlapped as ergonomic hazards and even Haenyeo included only female.
The major contributing factor of MSD in fishers was ergonomic risk. In our study, PAF according to body parts ranged from 22.8%–59.6% and 22.8%–50.3% in male and female, respectively. These results are similar to those of previous studies. Punnett et al.9 reported the attributable proportions of low back pain in ergonomic stress between 21%–41% depending on the region, and were higher in the less developed regions. This regional differences is explained by the labor force participation rate and population distribution of occupations, especially the proportion of farmers.15 Nambiema et al.8 showed an incident upper extremity musculoskeletal disorders associated with high physical exertion (PAF 30%) and working with arms above the shoulder level (PAF 7%), in a prospective study using the French Cosali cohort.
Mental diseases showed a significant PAF for MSDs in the neck, shoulder, hand, back, and knee regions in female only (PAF 9.1%–21.4% by body parts). Chronic pain is an important factor in the development of depression, and the coexistence of chronic pain and depression is commonly observed.9,16,17 Recent studies have shown that chronic pain and depression share similar neurological changes. For example, a study reported that the damage to dopamine activity in the limbic areas reduces the utilization of monoamine neurotransmitters.18 Another study showed that depression in the early stage of pain increases the possibility of prolonged pain.19 we recognized the reciprocal relationship between MSDs and mental diseases. Interestingly, we found sex difference in this relationship. In a study of sex differences in upper extremity MSD, female responded more strongly to psychological factors.20
Interestingly, we found gender differences in this relationship. A study by Treaster et al.20 on gender differences in upper extremity MSD showed that women responded more strongly to psychological factors. Higher pain sensitivity in female has been a consistent result of many studies.21 Zhang et al.22 analyzed gender differences in pain sensitivity in a functional MRI study of 450 healthy subjects. In this study, female had a lower pain threshold and a greater fear response to pain than male. The study presented sex differences in the volumes of amygdala subnuclei, which regulate responses to anxiety and fear.22
In this study, cold exposure showed a significant PAF for upper extremity MSD including the neck, shoulder, and hand only among female (25.6%–26.8%). Fishing has been reported as the most hazardous occupation, due to exposure to cold stress.23 Pienimäki24 explains that the occurrence of musculoskeletal symptoms increases as the duration of cold exposure increases. Working in a cold environment resulted in an elevated risk of OR: 2.2 (95% CI: 1.30–3.72) among male and OR: 1.6 (95% CI: 0.78–3.31) among female. Exposure to cold environment combined with repetitive work may have negative effect on muscle function, and fatigue may lead to strain injuries.25,26 The cause of the sex difference in the impact of cold exposure is unclear, and related studies are insufficient. However, Kaikaew et al.27 showed that female perceive the experience of cold and onset of shivering faster than male in an experimental study including voluntary subjects.
Interestingly, Age was not a significant variable of MSDs in fishers except with the knee MSD among female. In this study, MSD was defined based on health care visits and subjective symptoms, not based on objective findings such as radiological degenerative signs or disability. Fishers with severe degenerative MSD could adapt by avoiding physical work that induces pain. In heavy physical occupations such as fishing, having MSD with disability are the main reasons for early retirement. Paradoxically, health care use may be higher among younger fishers who are actively working. The exception to the knee MSD among female is assumed to be due to the high prevalence of knee osteoarthritis in female Korean farmers and fishers,4 and they can perform sedentary tasks despite the knee osteoarthritis.
By calculating PAR for multifactorial diseases, it is possible to know which factor contribute more to the prevalence of the disease. The proportion of harmful factors contributing to a disease is the PAF, which means that MSD can be prevented that the extent of that percentage, by improving the occurrence of harmful factors. In this study, significant and modifiable factors for MSDs included ergonomic risk, cold exposure, and mental diseases. Although the contribution of ergonomic risk and mental diseases to MSDs differed according to sex, the contribution of ergonomic risk to MSDs was greater in both sexes. This means that MSD can be prevented by improving ergonomic harmful factors. In particular, intervention to prevent such factors among female fishers are needed to prevent the development of mental diseases and cold exposure.
This study has several limitations. First, we investigated the association between a one-year prevalence and ergonomic risk using a cross-sectional study design. Therefore, unclear temporality and survival bias can act as systemic error. Second, the reliability and validity of the questionnaire used to obtain information for calculating ergonomic risk has not been previously verified. It may be insufficient for reflecting the atypical ergonomic factors among fishers and affected by recall bias. However, since it was impossible to evaluate the atypical and intermittent tasks of fishers in various regions, we accepted the subjective judgment by fishers as the best possible. Third, there is the possibility that fishers who were more interested in their health status participated in this study. Therefore, the prevalence of MSDs may have been overestimated. Fifth, as potential factors, history of injury, whole-body vibration, and hand-arm vibration may be considered, but they were not included in the analysis. Nevertheless, there are strengths to this study. First, this was a relatively large-scale study targeting fishers among whom research on occupational diseases were lacking, despite their high-risk occupations. Second, we adjusted for almost all potential variables to evaluate the associations of ergonomic risk, mental diseases, and cold exposure with MSDs. Third, we calculated the integrated ergonomic risk reflecting the elements of ergonomic hazard: strength, time, for each of the 5 body parts.
CONCLUSIONS
In this study, significant modifiable indicators of MSDs among fishers were ergonomic risk, mental diseases, and exposure to cold. Ergonomic risk contributed the most to the prevalence of MSDs. These results suggest that MSD can be reduced through improvement of ergonomic risk. Since mental diseases and cold exposure contributed more to MSDs among female than in male, sex differences should be considered in preventive interventions. We believe that the results of this study may provide the basis for the prevention of occupational diseases among fishers.
Acknowledgements
The authors thank the Ministry of Oceans and Fisheries Affairs of the Republic of Korea.
Abbreviations
CI
confidence interval
KOSHA
Korea Occupational Safety and Health Agency
MSD
musculoskeletal disease
PAF
population attributable fraction
PAR
population attributable risk
OR
odds ratio
-
Funding: This study was supported by research funds from the Ministry of Oceans and Fisheries Affairs of the Republic of Korea.
-
Competing interests: The authors declare that they have no competing interests.
-
Author contributions:
Conceptualization: Song H.
Data curation: Song H, Lee J.
Formal analysis: Song H.
Funding acquisition: Song H.
Investigation: Song H, Lee CG, Lee J, Sim B, Joo B, Park KS, Kim MJ, Kim JH, Kim K.
Methodology: Song H, Lee CG.
Software: Lee J.
Validation: Song H, Lee J.
Visualization: Song H.
Writing - original draft: Lee J.
Writing - review & editing: Song H, Park KS, Kim J, Lee CG.
NOTES
SUPPLEMENTARY MATERIALS
Supplementary Table 1
Face-to-face questionnaire for the assessment of ergonomic risk
Supplementary Table 2
The association between variables and musculoskeletal disease of 5 body sites among male
Supplementary Table 3
The association between variables and musculoskeletal disease of 5 body sites among female
Supplementary Table 4
Adjusted OR of variable by multiple logistic regression among male
Supplementary Table 5
Adjusted OR of variable by multiple logistic regression among female
- 1. Kim YE, Park H, Jo MW, Oh IH, Go DS, Jung J, et al. Trends and patterns of burden of disease and injuries in Korea using disability-adjusted life years. J Korean Med Sci 2019;34(Suppl 1):e75. 30923488.ArticlePubMedPMCPDF
- 2. Oh IH, Yoon SJ, Seo HY, Kim EJ, Kim YA. The economic burden of musculoskeletal disease in Korea: a cross sectional study. BMC Musculoskelet Disord 2011;12(1):157. 21749727.ArticlePubMedPMCPDF
- 3. Park J, Kim Y, Han B. Work sectors with high risk for work-related musculoskeletal disorders in Korean men and women. Saf Health Work 2018;9(1):75–78. 30363078.ArticlePubMedPMC
- 4. Seok H, Choi SJ, Yoon JH, Song GG, Won JU, Kim JH, et al. the association between osteoarthritis and occupational clusters in the Korean population: a nationwide study. PLoS One 2017;12(1):e0170229. 28099527.ArticlePubMedPMC
- 5. Berg-Beckhoff G, Østergaard H, Jepsen JR. Prevalence and predictors of musculoskeletal pain among Danish fishermen - results from a cross-sectional survey. J Occup Med Toxicol 2016;11(1):51. 27891170.ArticlePubMedPMCPDF
- 6. Kaerlev L, Jensen A, Hannerz H. Surveillance of hospital contacts among Danish seafarers and fishermen with focus on skin and infectious diseases-a population-based cohort study. Int J Environ Res Public Health 2014;11(11):11931–11949. 25411726.ArticlePubMedPMC
- 7. Hong C, Lee CG, Song H. Characteristics of lumbar disc degeneration and risk factors for collapsed lumbar disc in Korean farmers and fishers. Ann Occup Environ Med 2021;33:e16. 34754477.ArticlePubMedPMCPDF
- 8. Nambiema A, Bertrais S, Bodin J, Fouquet N, Aublet-Cuvelier A, Evanoff B, et al. Proportion of upper extremity musculoskeletal disorders attributable to personal and occupational factors: results from the French Pays de la Loire study. BMC Public Health 2020;20(1):456. 32252693.ArticlePubMedPMCPDF
- 9. Punnett L, Prüss-Utün A, Nelson DI, Fingerhut MA, Leigh J, Tak S, et al. Estimating the global burden of low back pain attributable to combined occupational exposures. Am J Ind Med 2005;48(6):459–469. 16299708.ArticlePubMed
- 10. Korea Occupational Safety and Health Agency. Guidelines for risk factor survey on tasks with musculoskeletal burden of the KOSHA (H-9-2018). Updated 2018]. Accessed April 4, 2022]. https://kosha.or.kr/kosha/data/musculoskeletalPreventionData_G.do?mode=download&articleNo=296739&attachNo=230707 .
- 11. European Working Conditions Surveys. EWCTS 2021 – Questionnaire. Updated 2021]. Accessed September 6, 2022]. https://www.eurofound.europa.eu/surveys/european-working-conditions-surveys/european-working-conditions-survey-2021/ewcs-2021-questionnaire .
- 12. Moriarty AS, Gilbody S, McMillan D, Manea L. Screening and case finding for major depressive disorder using the Patient Health Questionnaire (PHQ-9): a meta-analysis. Gen Hosp Psychiatry 2015;37(6):567–576. 26195347.ArticlePubMed
- 13. Spitzer RL, Kroenke K, Williams JB, Löwe B. A brief measure for assessing generalized anxiety disorder: the GAD-7. Arch Intern Med 2006;166(10):1092–1097. 16717171.ArticlePubMed
- 14. Newson R. REGPAR: Stata module to compute population attributable risks from binary regression models. Updated 2015]. Accessed September 6, 2022]. https://econpapers.repec.org/scripts/search.pf?ft=REGPAR .
- 15. Nelson DI, Concha-Barrientos M, Driscoll T, Steenland K, Fingerhut M, Punnett L, et al. The global burden of selected occupational diseases and injury risks: methodology and summary. Am J Ind Med 2005;48(6):400–418. 16299700.ArticlePubMed
- 16. Haukka E, Leino-Arjas P, Ojajärvi A, Takala EP, Viikari-Juntura E, Riihimäki H. Mental stress and psychosocial factors at work in relation to multiple-site musculoskeletal pain: a longitudinal study of kitchen workers. Eur J Pain 2011;15(4):432–438. 20932789.ArticlePubMedPDF
- 17. Kroenke K, Wu J, Bair MJ, Krebs EE, Damush TM, Tu W. Reciprocal relationship between pain and depression: a 12-month longitudinal analysis in primary care. J Pain 2011;12(9):964–973. 21680251.ArticlePubMedPMC
- 18. Sheng J, Liu S, Wang Y, Cui R, Zhang X. The link between depression and chronic pain: neural mechanisms in the brain. Neural Plast 2017;2017:9724371. 28706741.ArticlePubMedPMCPDF
- 19. Linton SJ, Bergbom S. Understanding the link between depression and pain. Scand J Pain 2011;2(2):47–54. 29913734.ArticlePubMed
- 20. Treaster DE, Burr D. Gender differences in prevalence of upper extremity musculoskeletal disorders. Ergonomics 2004;47(5):495–526. 15204301.ArticlePubMed
- 21. Mogil JS. Sources of individual differences in pain. Annu Rev Neurosci 2021;44(1):1–25. 34236890.ArticlePubMed
- 22. Zhang H, Bi Y, Hou X, Lu X, Tu Y, Hu L. The role of negative emotions in sex differences in pain sensitivity. Neuroimage 2021;245:118685. 34740794.ArticlePubMed
- 23. Sandsund M, Øren A, Thorvaldsen T, Holmen I, Sønvisen S, Heidelberg CT, et al. Musculoskeletal symptoms among workers in the commercial fishing fleet of Norway. Int Marit Health 2019;70(2):100–106. 31237669.ArticlePubMed
- 24. Pienimäki T. Cold exposure and musculoskeletal disorders and diseases. A review. Int J Circumpolar Health 2002;61(2):173–182. 12078965.ArticlePubMed
- 25. Oksa J, Ducharme MB, Rintamäki H. Combined effect of repetitive work and cold on muscle function and fatigue. J Appl Physiol (1985) 2002;92(1):354–361. 11744678.ArticlePubMed
- 26. Chiang HC, Chen SS, Yu HS, Ko YC. The occurrence of carpal tunnel syndrome in frozen food factory employees. Gaoxiong Yi Xue Ke Xue Za Zhi 1990;6(2):73–80. 2352318.PubMed
- 27. Kaikaew K, van den Beukel JC, Neggers SJ, Themmen AP, Visser JA, Grefhorst A. Sex difference in cold perception and shivering onset upon gradual cold exposure. J Therm Biol 2018;77:137–144. 30196892.ArticlePubMed
REFERENCES
REFERENCES
Figure & Data
REFERENCES
Citations
Citations to this article as recorded by 
- Development of criteria for health examination of high-risk occupational groups and application to female fishers: Delphi study
Hye-min Kim, Jungwon Kim, Kunhyung Kim, Hansoo Song
Annals of Occupational and Environmental Medicine.2026; 38: e2. CrossRef - Sex difference in musculoskeletal disabilities among Korean fishers: a cross-sectional study
Hye-min Kim, Soo Hyeong Park, Bong Gyun Joo, Ki-Soo Park, Jeong Ho Kim, Hansoo Song
Annals of Occupational and Environmental Medicine.2025; 37: e18. CrossRef
 Cite
CitePopulation attributable fraction of indicators for musculoskeletal diseases: a cross-sectional study of fishers in Korea

Fig. 1 Population attributable fraction of indicators for MSD among fishers by sex. Subject number of MSD by sex (male, female): Neck (29, 91) Shoulder (66, 156) Hands (29, 128) Back (101, 215) Knees (60, 167). Colored bar: modifiable indicators. Grey bar: non-modifiable indicators.MSD: musculoskeletal disease.
Fig. 1
Population attributable fraction of indicators for musculoskeletal diseases: a cross-sectional study of fishers in Korea
| Variables | Male (n = 371, 40.0) | Female (n = 556, 60.0) | Total | |||
|---|---|---|---|---|---|---|
| Age (yr) | 40–49 | 50 (13.5) | 55 (9.9) | 105 (11.3) | 0.052 | |
| 50–59 | 112 (30.2) | 212 (38.1) | 324 (35.0) | |||
| 60–69 | 160 (43.1) | 228 (41.0) | 388 (41.9) | |||
| 70–79 | 49 (13.2) | 61 (11.0) | 110 (11.9) | |||
| Mean ± SD | 60.2 ± 8.4 | 60.0 ± 7.8 | 61.1 ± 8.0 | |||
| Educational attainment | High | 176 (47.4) | 158 (28.4) | 334 (36.0) | < 0.001 | |
| Middle | 119 (32.1) | 161 (29.0) | 280 (30.2) | |||
| Elementary | 76 (20.5) | 237 (42.6) | 313 (33.8) | |||
| Household income (10,000 won) | < 1,500 | 63 (17.0) | 147 (26.4) | 210 (22.7) | < 0.001 | |
| 1,500–2,399 | 66 (17.8) | 131 (23.6) | 197 (21.3) | |||
| 2,400–4,000 | 94 (25.3) | 139 (25.0) | 233 (25.1) | |||
| > 4,000 | 128 (34.5) | 93 (16.7) | 221 (23.8) | |||
| No answer | 20 (5.4) | 46 (8.3) | 66 (7.1) | |||
| Employment xlink:type | Owner | 287 (77.4) | 145 (26.1) | 432 (46.6) | < 0.001 | |
| Household member | 28 (7.5) | 215 (38.7) | 243 (26.2) | |||
| Employee | 56 (15.1) | 196 (35.3) | 252 (27.2) | |||
| Job classificationa | A | 51 (13.7) | 51 (9.2) | 102 (11.0) | < 0.001 | |
| B | 14 (3.8) | 17 (3.1) | 31 (3.3) | |||
| C | 82 (22.1) | 62 (11.2) | 144 (15.5) | |||
| D | 137 (36.9) | 114 (20.5) | 251 (27.1) | |||
| E | 62 (16.7) | 42 (7.6) | 104 (11.2) | |||
| F | 0 (0.0) | 98 (17.6) | 98 (10.6) | |||
| G | 25 (6.7) | 172 (30.9) | 197 (21.3) | |||
| Cold exposureb (days/1 year) | No | 115 (31.0) | 212 (38.1) | 327 (35.3) | 0.003 | |
| 1–60 | 151 (40.7) | 167 (30.0) | 318 (34.3) | |||
| 61–119 | 66 (17.8) | 95 (17.1) | 161 (17.4) | |||
| ≥ 120 | 39 (10.5) | 82 (14.7) | 121 (13.1) | |||
| Noise exposurec (days/1 year) | No | 238 (64.2) | 371 (66.7) | 609 (65.7) | 0.012 | |
| 1–60 | 66 (17.8) | 60 (10.8) | 126 (13.6) | |||
| 61–199 | 46 (12.4) | 93 (16.7) | 139 (15.0) | |||
| ≥ 200 | 21 (5.7) | 32 (5.8) | 53 (5.7) | |||
| Heat exposured (days/1 year) | No | 157 (42.5) | 276 (63.7) | 433 (46.9) | 0.126 | |
| 1–29 | 92 (24.9) | 112 (54.9) | 204 (22.1) | |||
| 30–89 | 68 (18.4) | 87 (56.1) | 155 (16.8) | |||
| ≥ 90 | 52 (14.1) | 80 (60.6) | 132 (14.3) | |||
| Chronic diseasee | No | 138 (39.3) | 218 (40.1) | 356 (39.8) | 0.821 | |
| Yes | 213 (60.7) | 326 (59.9) | 539 (60.2) | |||
| Hypertension | No | 217 (61.8) | 335 (61.6) | 552 (61.7) | 0.942 | |
| Yes | 134 (38.2) | 209 (38.4) | 343 (38.3) | |||
| Diabetes mellitus | No | 272 (77.5) | 473 (86.9) | 745 (83.2) | < 0.001 | |
| Yes | 79 (22.5) | 71 (13.1) | 150 (16.8) | |||
| Hyperlipidemia | No | 281 (80.1) | 418 (76.8) | 699 (78.1) | 0.256 | |
| Yes | 70 (19.9) | 126 (23.2) | 196 (21.9) | |||
| Mental diseasef | No | 338 (91.1) | 463 (83.3) | 801 (86.4) | 0.001 | |
| Yes | 33 (8.9) | 93 (16.7) | 126 (13.6) | |||
| Depression | No | 354 (95.4) | 524 (94.2) | 878 (94.7) | 0.434 | |
| Yes | 17 (4.6) | 32 (5.8) | 49 (5.3) | |||
| Anxiety disorder | No | 341 (91.9) | 469 (84.4) | 810 (87.4) | 0.001 | |
| Yes | 30 (8.1) | 87 (15.6) | 117 (12.6) | |||
| Variables | Neck | Shoulder | Hand | Back | Knee | |||||||
|---|---|---|---|---|---|---|---|---|---|---|---|---|
| % | % | % | % | % | ||||||||
| Sex | Male | 7.8 | < 0.001 | 17.8 | < 0.001 | 7.8 | < 0.001 | 27.2 | < 0.001 | 16.2 | < 0.001 | |
| Female | 16.4 | 28.1 | 23.0 | 38.7 | 30.0 | |||||||
| Age (years) | 40–49 | 13.3 | 0.197 | 24.8 | 0.753 | 21.9 | 0.141 | 23.8 | 0.077 | 17.1 | 0.039 | |
| 50–59 | 13.9 | 23.8 | 17.3 | 32.7 | 22.8 | |||||||
| 60–69 | 13.9 | 24.5 | 16.0 | 39.2 | 27.3 | |||||||
| 70–79 | 6.4 | 21.8 | 14.5 | 30.0 | 26.4 | |||||||
| Education | High | 12.9 | 0.255 | 23.7 | 0.309 | 17.1 | 0.709 | 25.4 | < 0.001 | 18.6 | < 0.001 | |
| Middle | 9.6 | 20.7 | 15.4 | 35.4 | 23.9 | |||||||
| Elementary | 16.0 | 27.2 | 18.2 | 42.2 | 31.3 | |||||||
| Household income (10,000 won) | < 1,500 | 16.7 | 0.011 | 26.7 | < 0.001 | 17.6 | 0.004 | 43.3 | < 0.001 | 32.9 | < 0.001 | |
| 1,500–2,399 | 14.2 | 27.4 | 21.8 | 38.6 | 26.4 | |||||||
| 2,400–4,000 | 11.2 | 25.8 | 19.3 | 32.6 | 22.7 | |||||||
| > 4,000 | 13.1 | 21.7 | 13.1 | 31.7 | 23.1 | |||||||
| No answer | 3.0 | 6.1 | 4.5 | 4.5 | 3.0 | |||||||
| Employment | Owner | 10.2 | 0.024 | 20.4 | 0.049 | 11.8 | < 0.001 | 30.1 | 0.015 | 21.1 | 0.069 | |
| Member | 13.2 | 25.9 | 20.6 | 41.2 | 28.4 | |||||||
| Employee | 17.5 | 28.2 | 22.2 | 34.1 | 26.6 | |||||||
| Job classificationa | A | 11.8 | 0.001 | 21.6 | 0.005 | 9.8 | < 0.001 | 34.3 | 0.001 | 20.6 | < 0.001 | |
| B | 29.0 | 29.0 | 38.7 | 45.2 | 19.4 | |||||||
| C | 17.4 | 27.8 | 16.0 | 40.3 | 32.6 | |||||||
| D | 6.4 | 14.7 | 11.2 | 23.9 | 15.1 | |||||||
| E | 14.4 | 29.8 | 18.3 | 46.2 | 32.7 | |||||||
| F | 11.2 | 26.5 | 15.3 | 35.7 | 31.6 | |||||||
| G | 16.2 | 28.9 | 25.4 | 33.5 | 25.4 | |||||||
| Ergonomic risk by each body parts | < 250 | 7.0 | < 0.001 | 16.3 | < 0.001 | 8.8 | < 0.001 | 19.8 | < 0.001 | 19.7 | < 0.001 | |
| 250–499 | 14.4 | 28.7 | 19.8 | 35.4 | 25.0 | |||||||
| 500–749 | 20.0 | 23.4 | 21.6 | 47.3 | 29.1 | |||||||
| ≥ 750 | 27.5 | 44.3 | 30.9 | 53.8 | 40.7 | |||||||
| Cold exposure (days/1 year) | No | 11.6 | 0.053 | 22.3 | 0.030 | 15.3 | 0.004 | 36.4 | 0.246 | 25.7 | 0.127 | |
| 1–60 | 11.3 | 20.8 | 14.2 | 26.4 | 18.9 | |||||||
| 61–119 | 14.9 | 28.6 | 17.4 | 39.8 | 26.7 | |||||||
| ≥ 120 | 18.2 | 30.6 | 28.1 | 40.5 | 33.1 | |||||||
| Noise exposure (days/1 year) | No | 12.6 | 0.686 | 23.6 | 0.686 | 17.1 | 0.618 | 35.5 | 0.091 | 25.6 | 0.471 | |
| 1–60 | 16.7 | 28.6 | 17.5 | 37.3 | 22.2 | |||||||
| 61–199 | 12.9 | 23.0 | 18.0 | 26.6 | 20.1 | |||||||
| ≥ 200 | 7.5 | 18.9 | 11.3 | 30.2 | 28.3 | |||||||
| Heat exposure (days/1 year) | No | 12.5 | 0.432 | 24.2 | 0.760 | 17.1 | 0.324 | 26.3 | 0.212 | 26.3 | 0.468 | |
| 1–29 | 11.3 | 21.6 | 13.7 | 25.0 | 17.6 | |||||||
| 30–89 | 16.1 | 25.8 | 16.8 | 28.4 | 21.3 | |||||||
| ≥ 90 | 13.6 | 25.0 | 22.0 | 48.5 | 33.3 | |||||||
| Chronic diseaseb | No | 12.1 | 0.427 | 24.4 | 0.913 | 16.6 | 0.791 | 34.6 | 0.721 | 21.9 | 0.148 | |
| Yes | 13.9 | 24.1 | 17.3 | 33.4 | 26.2 | |||||||
| Hypertension | No | 13.4 | 0.804 | 25.5 | 0.250 | 17.6 | 0.551 | 33.9 | 0.986 | 23.7 | 0.515 | |
| Yes | 12.8 | 22.2 | 16.0 | 33.8 | 25.7 | |||||||
| Diabetes mellitus | No | 14.0 | 0.127 | 25.2 | 0.124 | 17.6 | 0.286 | 35.3 | 0.041 | 25.8 | 0.043 | |
| Yes | 9.3 | 19.3 | 14.0 | 26.7 | 18.0 | |||||||
| Hyperlipidemia | No | 12.3 | 0.141 | 24.0 | 0.780 | 16.7 | 0.712 | 34.0 | 0.817 | 23.3 | 0.131 | |
| Yes | 16.3 | 25.0 | 17.9 | 33.2 | 28.6 | |||||||
| Mental diseasec | No | 10.4 | < 0.001 | 20.6 | < 0.001 | 14.5 | < 0.001 | 31.2 | < 0.001 | 22.1 | < 0.001 | |
| Yes | 29.4 | 45.2 | 32.5 | 52.4 | 39.7 | |||||||
| Depression | No | 12.1 | 0.001 | 22.8 | < 0.001 | 16.2 | 0.009 | 33.3 | 0.024 | 23.9 | 0.088 | |
| Yes | 28.6 | 44.9 | 30.6 | 49.0 | 34.7 | |||||||
| Anxiety disorder | No | 10.4 | < 0.001 | 20.6 | < 0.001 | 14.6 | < 0.001 | 31.1 | < 0.001 | 22.0 | < 0.001 | |
| Yes | 30.8 | 47.0 | 33.3 | 54.7 | 41.9 | |||||||
| Total | 12.9 | 23.9 | 16.9 | 34.1 | 24.5 | |||||||
| Variable | Neck | Shoulder | Hand | Back | Knee | ||||||
|---|---|---|---|---|---|---|---|---|---|---|---|
| OR | 95% CI | OR | 95% CI | OR | 95% CI | OR | 95% CI | OR | 95% CI | ||
| Educational attainment | |||||||||||
| High | 1.00 | 1.00 | 1.00 | 1.00 | 1.00 | ||||||
| Middle | 0.22 | 0.40–1.24 | 0.80 | 0.52–1.23 | 0.88 | 0.53–1.45 | 1.46 | 0.99–2.16 | 1.17 | 0.75–1.81 | |
| Elementary | 0.40 | 0.72–2.27 | 1.06 | 0.67–1.67 | 0.90 | 0.53–1.56 | 1.93 | 1.26–2.94 | 1.46 | 0.92–2.34 | |
| Household income | |||||||||||
| < 1,500 | 1.00 | 1.00 | 1.00 | 1.00 | 1.00 | ||||||
| 1,500–2,399 | 0.80 | 0.46–1.39 | 1.09 | 0.69–1.70 | 1.36 | 0.82–2.26 | 0.89 | 0.59–1.33 | 0.83 | 0.53–1.29 | |
| 2,400–4,000 | 0.62 | 0.35–1.09 | 1.04 | 0.67–1.63 | 1.21 | 0.72–2.02 | 0.74 | 0.50–1.12 | 0.76 | 0.49–1.19 | |
| > 4,000 | 0.85 | 0.46–1.54 | 0.94 | 0.57–1.54 | 0.89 | 0.49–1.62 | 0.86 | 0.56–1.35 | 1.01 | 0.62–1.64 | |
| No answer | 0.17 | 0.04–0.74 | 0.17 | 0.06–0.50 | 0.21 | 0.06–0.71 | 0.06 | 0.02–0.21 | 0.06 | 0.01–0.25 | |
| Employment xlink:type | |||||||||||
| Owner | 1.00 | 1.00 | 1.00 | 1.00 | 1.00 | ||||||
| Member | 0.76 | 0.43–1.33 | 1.02 | 0.66–1.58 | 1.07 | 0.65–1.76 | 1.32 | 0.89–1.95 | 1.07 | 0.70–1.65 | |
| Employee | 1.14 | 0.68–1.90 | 1.20 | 0.80–1.81 | 1.31 | 0.82–2.12 | 0.98 | 0.67–1.42 | 1.01 | 0.67–1.54 | |
| Job classificationa | |||||||||||
| A | 1.00 | 1.00 | 1.00 | 1.00 | 1.00 | ||||||
| B | 2.90 | 1.06–7.97 | 1.41 | 0.56–3.55 | 6.68 | 2.41–18.5 | 1.24 | 0.53–2.88 | 0.73 | 0.26–2.07 | |
| C | 1.70 | 0.80–3.63 | 1.42 | 0.77–2.61 | 1.91 | 0.85–4.32 | 1.25 | 0.73–2.16 | 1.88 | 1.02–3.48 | |
| D | 0.54 | 0.24–1.20 | 0.61 | 0.34–1.23 | 1.22 | 0.56–2.70 | 0.51 | 0.30–0.86 | 0.58 | 0.31–1.08 | |
| E | 1.36 | 0.59–3.11 | 1.63 | 0.86–3.10 | 2.59 | 1.11–6.04 | 1.60 | 0.90–2.86 | 1.95 | 1.02–3.75 | |
| F | 0.77 | 0.29–2.11 | 0.89 | 0.41–1.91 | 0.87 | 0.32–2.35 | 0.55 | 0.28–1.09 | 0.76 | 0.36–1.62 | |
| G | 1.05 | 0.50–2.20 | 1.17 | 0.65–2.10 | 2.23 | 1.05–4.74 | 0.64 | 0.38–1.10 | 0.84 | 0.46–1.54 | |
| Ergonomic risk | |||||||||||
| < 250 | 1.00 | 1.00 | 1.00 | 1.00 | 1.00 | ||||||
| 250–499 | 2.00 | 1.18–3.40 | 2.04 | 1.38–3.01 | 2.34 | 1.42–3.85 | 2.17 | 1.50–3.15 | 1.32 | 0.89–1.96 | |
| 500–749 | 2.94 | 1.63–5.30 | 1.46 | 0.86–2.47 | 2.75 | 1.54–4.91 | 3.76 | 2.43–5.83 | 1.89 | 1.11–3.20 | |
| ≥ 750 | 4.44 | 2.57–7.66 | 4.09 | 2.64–6.32 | 4.09 | 2.53–6.61 | 4.77 | 3.16–7.18 | 3.06 | 1.98–4.74 | |
| Noise exposure (days/1 year) | |||||||||||
| No | 1.00 | 1.00 | 1.00 | 1.00 | 1.00 | ||||||
| 1–60 | 1.44 | 0.84–2.47 | 1.40 | 0.90–2.19 | 1.15 | 0.68–1.96 | 1.22 | 0.81–1.84 | 0.99 | 0.61–1.59 | |
| 61–199 | 0.92 | 0.53–1.61 | 0.93 | 0.60–1.45 | 1.00 | 0.61–1.64 | 0.62 | 0.41–0.95 | 0.71 | 0.45–1.13 | |
| ≥ 200 | 0.55 | 0.19–1.58 | 0.76 | 0.37–1.57 | 0.62 | 0.25–1.51 | 0.81 | 0.44–1.51 | 1.22 | 0.64–2.32 | |
| Cold exposure (days/1 year) | |||||||||||
| No | 1.00 | 1.00 | 1.00 | 1.00 | 1.00 | ||||||
| 1–60 | 1.14 | 0.70–1.88 | 0.99 | 0.68–1.45 | 1.06 | 0.68–1.66 | 0.67 | 0.47–0.95 | 0.72 | 0.49–1.06 | |
| 61–199 | 1.54 | 0.88–2.70 | 1.48 | 0.95–2.30 | 1.32 | 0.78–2.24 | 1.17 | 0.78–1.74 | 1.04 | 0.67–1.62 | |
| ≥ 120 | 1.80 | 1.01–3.22 | 1.54 | 0.96–2.47 | 2.26 | 1.35–3.78 | 1.17 | 0.76–1.81 | 1.36 | 0.86–2.17 | |
| Heat exposure (days/1 year) | |||||||||||
| No | 1.00 | 1.00 | 1.00 | 1.00 | 1.00 | ||||||
| 1–29 | 1.06 | 0.62–1.80 | 0.91 | 0.61–1.37 | 0.85 | 0.52–1.39 | 0.63 | 0.43–0.93 | 0.62 | 0.41–0.96 | |
| 30–89 | 1.52 | 0.90–2.56 | 1.15 | 0.75–1.76 | 1.08 | 0.65–1.78 | 0.74 | 0.49–1.10 | 0.79 | 0.51–1.24 | |
| ≥ 90 | 1.28 | 0.71–2.30 | 1.08 | 0.68–1.72 | 1.54 | 0.93–2.55 | 1.68 | 1.12–2.53 | 1.36 | 0.88–2.10 | |
| Chronic diseaseb | |||||||||||
| No | 1.00 | 1.00 | 1.00 | 1.00 | 1.00 | ||||||
| Yes | 1.22 | 0.81–1.83 | 1.00 | 0.73–1.37 | 1.10 | 0.76–1.60 | 0.94 | 0.70–1.25 | 1.25 | 0.91–1.73 | |
| Mental diseasec | |||||||||||
| No | 1.00 | 1.00 | 1.00 | 1.00 | 1.00 | ||||||
| Yes | 3.25 | 2.06–5.12 | 3.00 | 2.02–4.46 | 2.60 | 1.68–4.02 | 2.18 | 1.48–3.21 | 2.06 | 1.38–3.08 | |
| Variables | Neck | Shoulder | Hand | Back | Knee | |||||||
|---|---|---|---|---|---|---|---|---|---|---|---|---|
| OR | 95% CI | OR | 95% CI | OR | 95% CI | OR | 95% CI | OR | 95% CI | |||
| Male | ||||||||||||
| Age (years) | ||||||||||||
| 40–49 | 1.00 | 1.00 | 1.00 | 1.00 | 1.00 | |||||||
| 50–59 | 0.73 | 0.19–2.83 | 0.83 | 0.31–2.21 | 0.57 | 0.17–1.89 | 0.69 | 0.30–1.62 | 0.42 | 0.15–1.17 | ||
| 60–69 | 1.00 | 0.22–4.52 | 1.04 | 0.36–2.98 | 0.31 | 0.07–1.30 | 0.72 | 0.29–1.77 | 0.41 | 0.14–1.21 | ||
| ≥ 70 | 0.52 | 0.06–4.23 | 1.46 | 0.39–5.44 | 1.65 | 0.34–7.95 | 0.98 | 0.33–2.97 | 0.64 | 0.18–2.27 | ||
| Educational attainment | ||||||||||||
| High | 1.00 | 1.00 | 1.00 | 1.00 | 1.00 | |||||||
| Middle | 1.26 | 0.38–4.18 | 1.10 | 0.51–2.37 | 0.68 | 0.56–5.04 | 0.67 | 0.85–3.29 | 2.35 | 1.03–5.37 | ||
| Elementary | 2.72 | 0.80–9.30 | 1.03 | 0.43–2.45 | 0.90 | 0.23–3.57 | 1.86 | 0.87–3.95 | 3.13 | 1.25–7.84 | ||
| Ergonomic risk | ||||||||||||
| < 250 | 1.00 | 1.00 | 1.00 | 1.00 | 1.00 | |||||||
| 250–499 | 4.35 | 1.45–13.06 | 2.88 | 1.44–5.79 | 4.62 | 1.70–12.57 | 3.07 | 1.63–5.77 | 1.19 | 0.53–2.66 | ||
| 500–749 | 7.02 | 2.17–22.77 | 1.97 | 0.65–5.94 | 2.70 | 0.77–9.55 | 6.21 | 3.01–12.81 | 2.29 | 0.96–5.49 | ||
| ≥ 750 | 6.28 | 1.92–20.51 | 6.18 | 2.83–13.46 | 4.05 | 1.29–12.71 | 5.86 | 2.83–12.10 | 3.07 | 1.35–6.97 | ||
| Cold exposure (days/1 year) | ||||||||||||
| No | 1.00 | 1.00 | 1.00 | 1.00 | 1.00 | |||||||
| 1–60 | 1.22 | 0.48–3.07 | 0.65 | 0.32–1.28 | 1.02 | 0.39–2.68 | 0.62 | 0.34–1.13 | 0.50 | 0.24–1.04 | ||
| 61–119 | 0.31 | 0.06–1.55 | 0.91 | 0.41–2.05 | 0.65 | 0.18–2.38 | 0.87 | 0.42–1.77 | 0.73 | 0.31–1.69 | ||
| ≥ 120 | 1.17 | 0.32–4.29 | 0.71 | 0.27–1.92 | 1.30 | 0.39–4.39 | 0.90 | 0.39–2.07 | 1.37 | 0.57–3.31 | ||
| Mental diseasea | ||||||||||||
| No | 1.00 | 1.00 | 1.00 | 1.00 | 1.00 | |||||||
| Yes | 1.38 | 0.40–4.73 | 2.01 | 0.85–4.77 | 1.51 | 0.40–5.75 | 1.08 | 0.45–2.55 | 1.14 | 0.42–3.12 | ||
| Female | ||||||||||||
| Age (years) | ||||||||||||
| 40–49 | 1.00 | 1.00 | 1.00 | 1.00 | 1.00 | |||||||
| 50–59 | 0.96 | 0.40–2.28 | 0.64 | 0.31–1.33 | 0.60 | 0.28–1.28 | 1.49 | 0.68–3.25 | 2.09 | 0.90–4.84 | ||
| 60–69 | 0.83 | 0.31–2.24 | 0.59 | 0.26–1.35 | 0.61 | 0.26–1.44 | 1.85 | 0.79–4.33 | 3.17 | 1.27–7.91 | ||
| ≥ 70 | 0.45 | 0.11–1.76 | 0.53 | 0.19–1.49 | 0.49 | 0.16–1.53 | 1.21 | 0.43–3.42 | 2.77 | 0.94–8.22 | ||
| Educational attainment | ||||||||||||
| High | 1.00 | 1.00 | 1.00 | 1.00 | 1.00 | |||||||
| Middle | 0.59 | 0.29–1.23 | 0.85 | 0.47–1.55 | 0.79 | 0.41–1.49 | 1.45 | 0.83–2.54 | 0.76 | 0.43–1.35 | ||
| Elementary | 1.01 | 0.49–2.08 | 1.12 | 0.60–2.10 | 0.94 | 0.48–1.83 | 1.68 | 0.94–3.01 | 0.87 | 0.48–1.56 | ||
| Ergonomic risk | ||||||||||||
| < 250 | 1.00 | 1.00 | 1.00 | 1.00 | 1.00 | |||||||
| 250–499 | 1.92 | 1.01–3.68 | 1.78 | 1.09–2.93 | 1.87 | 1.03–3.38 | 1.80 | 1.11–2.92 | 1.28 | 0.80–2.07 | ||
| 500–749 | 2.46 | 1.17–5.16 | 2.12 | 0.64–2.26 | 2.60 | 1.30–5.21 | 2.78 | 1.57–4.93 | 1.41 | 0.71–2.82 | ||
| ≥ 750 | 3.41 | 1.77–6.57 | 3.28 | 1.87–5.77 | 4.69 | 2.64–8.34 | 4.06 | 2.40–6.88 | 2.87 | 1.66–4.96 | ||
| Cold exposure (days/1 year) | ||||||||||||
| No | 1.00 | 1.00 | 1.00 | 1.00 | 1.00 | |||||||
| 1–60 | 1.53 | 0.80–2.90 | 1.67 | 1.01–277 | 1.60 | 0.92–2.78 | 1.02 | 0.64–1.62 | 1.04 | 0.64–1.69 | ||
| 61–119 | 2.27 | 1.15–4.49 | 2.04 | 1.15–3.62 | 1.75 | 0.94–3.28 | 1.64 | 0.95–2.81 | 1.23 | 0.71–2.12 | ||
| ≥ 120 | 2.11 | 1.04–4.29 | 2.49 | 1.38–4.51 | 3.31 | 1.77–6.20 | 1.61 | 0.92–2.81 | 1.45 | 0.82–2.57 | ||
| Mental diseasea | ||||||||||||
| No | 1.00 | 1.00 | 1.00 | 1.00 | 1.00 | |||||||
| Yes | 3.56 | 2.07–6.12 | 3.18 | 1.96–5.15 | 3.05 | 1.83–5.10 | 2.58 | 1.58–4.23 | 2.10 | 1.31–3.39 | ||
| Variables | Neck | Shoulder | Hand | Back | Knee | |||||||
|---|---|---|---|---|---|---|---|---|---|---|---|---|
| % or %p | 95% CI | % or %p | 95% CI | % or %p | 95% CI | % or %p | 95% CI | % or %p | 95% CI | |||
| Male | ||||||||||||
| All | 7.8 | 5.6–10.8 | 17.8 | 14.4–21.8 | 7.8 | 5.6–10.9 | 27.2 | 23.2–31.6 | 16.2 | 12.9–20.1 | ||
| PAR | ||||||||||||
| Age | −1.1 | −9.0–6.8 | 0.1 | −10.5–10.6 | −4.2 | −13.7–5.3 | −4.6 | −17.4–8.4 | −10.5 | −24.6–4.0 | ||
| Educational attainment | 1.9 | −0.8–4.7 | 0.5 | −4.6–5.5 | 0.9 | −2.3–4.2 | 5.1 | 0.0–10.2 | 5.9 | 1.7–10.1 | ||
| Ergonomic risk | 4.7 | 2.2–7.1 | 7.1 | 3.9–10.4 | 3.8 | 1.4–6.2 | 13.7 | 9.3–18.0 | 3.7 | 0.2–7.1 | ||
| Cold exposure | −0.4 | −4.1–3.4 | −3.0 | −8.7–2.8 | −0.3 | −3.7–3.2 | −3.8 | −10.2–2.6 | −3.3 | −8.9–2.2 | ||
| Mental disease | 0.2 | −0.8–1.3 | 1.0 | −0.3–2.4 | −0.2 | −4.5–4.1 | 0.1 | −1.2–1.5 | 0.2 | −1.1–1.4 | ||
| PAF | ||||||||||||
| Educational attainment | 18.8 | 0.0–32.3 | 36.4 | 13.2–50.2 | ||||||||
| Ergonomic risk | 59.6 | 39.5–65.6 | 40.2 | 27.2–47.5 | 48.6 | 26.0–56.5 | 50.3 | 40.1–57.1 | 22.8 | 1.9–35.4 | ||
| Female | ||||||||||||
| All | 16.4 | 13.7–19.5 | 28.1 | 24.7–31.7 | 23.0 | 19.9–26.5 | 38.7 | 35.0–42.5 | 30.0 | 26.5–33.8 | ||
| PAR | ||||||||||||
| Age | −2.1 | −12.9–8.7 | −8.9 | −22.3–4.9 | −8.1 | −21.4–5.5 | 8.8 | −4.9–22.0 | 14.4 | 4.5–23.9 | ||
| Educational attainment | −1.7 | −7.5–4.2 | 0.1 | −6.9–7.1 | −1.5 | −8.6–5.6 | 6.9 | −0.7–14.4 | −2.9 | −10.9–5.2 | ||
| Ergonomic risk | 5.8 | 2.6–9.1 | 6.8 | 2.7–10.8 | 9.7 | 5.7–13.6 | 13.0 | 7.8–18.2 | 4.8 | 1.4–8.2 | ||
| Cold exposure | 4.4 | 0.9–7.9 | 7.2 | 2.8–11.6 | 6.1 | 2.2–10.0 | 3.4 | −1.5–8.2 | 2.0 | −2.7–6.8 | ||
| Mental disease | 3.5 | 1.8–5.2 | 4.2 | 2.4–6.0 | 3.4 | 1.7–5.2 | 3.5 | 1.7–5.4 | 2.8 | 0.9–4.6 | ||
| PAF | ||||||||||||
| Age | 48.0 | 17.0–70.7 | ||||||||||
| Ergonomic risk | 35.6 | 18.8–46.6 | 24.1 | 11.1–34.0 | 42.2 | 28.9–51.5 | 33.7 | 22.2–42.8 | 15.9 | 5.2–24.1 | ||
| Cold exposure | 26.8 | 6.6–40.5 | 25.6 | 13.3–36.6 | 26.1 | 11.1–37.7 | ||||||
| Mental disease | 21.4 | 13.3–26.5 | 14.9 | 9.6–18.8 | 15.0 | 8.6–19.6 | 9.1 | 4.8–12.6 | 9.2 | 3.5–13.6 | ||
Table 1 Characteristic of subjects
Values are presented as number (%). The
aA: Aquaculture (shellfish), B: Aquaculture (fish), C: Aquaculture (seaweeds), D: Fishing vessel fishery with trap gill net, E: Fishing vessel fishery with long line, F: Haenyeo (Korean female sea diver), G: Oyster shucker. bLow temperatures, whether indoors or outdoors. cNoise that is loud enough to raise your voice when speaking to others. dTemperatures high enough to make you sweat even when you are not working. eIf patient has hypertension and/or diabetes mellitus. fIf the patient has depression and/or anxiety disorder.
Table 2 The association between variables and musculoskeletal disease of 5 body parts
The
aA: Aquaculture (shellfish), B: Aquaculture (fish), C: Aquaculture (seaweeds), D: Fishing vessel fishery with trap gill net, E: Fishing vessel fishery with long line, F: Haenyeo (Korean female sea diver), G: Oyster shucker. bIf patient has hypertension and/or diabetes mellitus. cIf patient has depression and/or anxiety disorder.
Table 3 Age, sex adjusted multiple logistic regression analysis (model 1)
OR: odds ratio; CI: confidence interval.
aA: Aquaculture (shellfish), B: Aquaculture (fish), C: Aquaculture (seaweeds), D: Fishing vessel fishery with trap gill net, E: Fishing vessel fishery with long line, F: Haenyeo (Korean female sea diver), G: Oyster shucker. bIf patient has hypertension and/or diabetes mellitus. cIf patient has depression and/or anxiety disorder.
Table 4 Adjusted OR of major 5 potential indicators by multiple logistic regression by sex (model 2)
OR: odds ratio; CI: confidence interval.
aIf the patient has depression and/or anxiety disorder.
Table 5 PAR and PAF of indicators for 5 body parts musculoskeletal diseases by sex
All: prevalence (%) of each musculoskeletal disease and 95% confidence interval. PAR: %p and 95% confidence interval. PAF: proportion (%) and 95% confidence interval.
PAF: population attributable fraction; PAR: population attributable risk.

