
Articles
- Page Path
- HOME > Ann Occup Environ Med > Volume 33; 2021 > Article
- Review Tuberculosis infection status and risk factors among health workers: an updated systematic review
-
Sanga Lee1
 , Wanhyung Lee2, Seong-Kyu Kang2
 -
Annals of Occupational and Environmental Medicine 2021;33:e17.
DOI: https://doi.org/10.35371/aoem.2021.33.e17
Published online: May 28, 2021
1Gachon University College of Medicine, Incheon, Korea.
2Department of Occupational and Environmental Medicine, Gil Medical Center, Gachon University College of Medicine, Incheon, Korea.
- Correspondence: Seong-Kyu Kang. Department of Occupational and Environmental Medicine, Gil Medical Center, Gachon University College of Medicine, 21 Namdong-daero 774beon-gil, Namdong-gu, Incheon 21565, Korea. sk.kang@gachon.ac.kr
• Received: June 19, 2020 • Accepted: May 14, 2021
Copyright © 2021 Korean Society of Occupational & Environmental Medicine
This is an Open Access article distributed under the terms of the Creative Commons Attribution Non-Commercial License (https://creativecommons.org/licenses/by-nc/4.0/) which permits unrestricted non-commercial use, distribution, and reproduction in any medium, provided the original work is properly cited.
Abstract
- Tuberculosis (TB) infection is a common occupational risk for health workers (HWs) and poses a threat to the patients under their care and to other HWs. Hence, the development of a prevention strategy is crucial. We conducted a study to understand the status and risk factors of TB infection among HWs. The existing literature was searched for all published reports from 1 August 2010 to 31 December 2018, related to TB among HWs according to the Preferred Reporting Items for Systematic Reviews and Meta-Analyses guidelines. The inclusion criteria were: (1) study participants working in a health care facility; (2) TB cases diagnosed by medical professionals; (3) original research articles; and (4) English reports in a peer-reviewed journal. We finally included 61 studies from 642 articles searched initially. The TB infection rate in HWs was higher than that of the general population. Based on 39 studies, the prevalence of TB in HWs (tuberculin skin test positive) was 29.94%. In contrast, the global burden of latent TB infection was 23.0% (95% uncertainty interval: 20.4%–26.4%) in 2014. The risk factors of TB among HWs were aging, long duration of employment, nursing professionals, lack of Bacillus Calmette-Guerin vaccination, and low body mass index. HWs have an increased risk for TB infection, which can cause secondary infections in patients or other HWs. An effective prevention strategy must be developed to enable early diagnosis and prompt treatment.
BACKGROUND
Health workers (HWs) are routinely exposed to infected blood and body fluids at their workplaces. One third of the world population has been infected by tuberculosis (TB), including the latent TB infection (LTBI), and the highest risk of TB transmission has been reported in HWs [1,2]. HWs are frequently exposed to patients with undiagnosed or untreated TB at work [3]. A HW infected with TB can act as a carrier and poses a threat to other patients or fellow HWs. Thus, TB infection of HWs at work is a major concern not only in the domain of occupational health but also in public health. Despite the large number of studies on TB infection among HWs, there is a lack of clarity regarding its prevalence in different countries and its risk factors in occupational settings.
Baussano et al. [4] conducted an in-depth review of the research on the TB status among HWs. From January 2005 to July 2010, forty-three eligible studies were included. These accounted for 1,176 cases of LTBI among HWs with 49,576 person-years of follow-up and for 1,942 TB cases with > 1,010,047 person-years of follow-up. Cases of LTBI and TB among HWs were reported in 25 and 18 studies, respectively. Since then, the literature on the TB status among HWs has reported a significant increase. Thus, we conducted an updated systematic literature review for TB infection among HWs from August 2010. The aim of this review was to comprehensively and critically assess the literature regarding the intercontinental prevalence, risk factors, and the type of TB among HWs, and to gain a better understanding of TB among HWs for guiding the future research.
METHODS
This study systematically reviewed the TB infection status and risk factors for HWs, providing the academic evidence and a strategy to prevent HWs from TB. The main problem in the current review study was TB exposure to HWs. The TB infection status and risk factors were compared with the general population or non-HWs, outcomes were demonstrated with prevalence, incidence, or odds ratio (OR).
A systematic search was conducted on the databases of PubMed and Google Scholar for all published reports on TB among HWs according to the Preferred Reporting Items for Systematic reviews and Meta-Analyses guidelines. The search term used was: “TB” OR “tuberculosis” OR “LTBI” OR “latent tuberculosis infection” AND work* OR occupation* OR industry* OR employee*. All the relevant published articles from 1 August 2010 to 31 December 2018 were identified, as the previous review had already included the 43 studies pertaining to TB among HWs published from 1 January 2005 to 31 July 2010 [4].
We included all studies that satisfied the following criteria: (1) study participants working in a health care facility; (2) TB patients diagnosed by medical professionals; (3) original research articles; and (4) English reports in a peer-reviewed journal.
Studies were excluded if they were: (1) reviews, notes, case reports, commentaries, or editorials; (2) non-human focused researches; (3) articles describing only guidance of clinical treatment or other similar study designs.
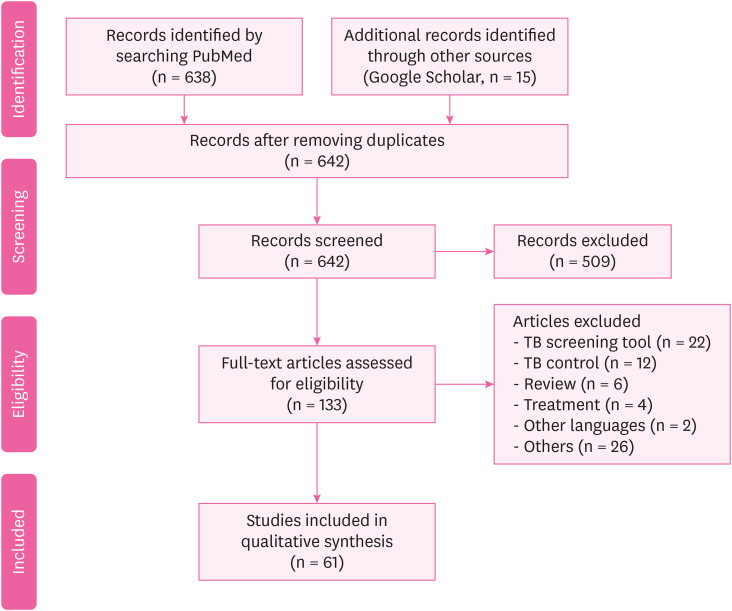
After the search, the duplicates were removed. The titles and abstracts of the remaining articles were then screened, based on the inclusion and exclusion criteria. Thereafter, the screened articles were checked for eligibility by reviewing a random sample of the included and excluded studies. Full text screening was also performed to assess the articles against the inclusion criteria to complete the process of selection and organization. A flow chart of the process is demonstrated in Fig. 1. Finally, the selected articles were organized based on them pertaining to the following two aspects; (1) the status (prevalence or incidence) of TB among HWs; and (2) the risk factors of TB among HWs.
RESULTS AND DISCUSSION
We identified a total of 638 potentially relevant citations from the PubMed data base, and 15 from the other sources (Google Scholar). The article screening and selection were conducted by three authors. Five hundreds and nine articles were excluded by the initial screening because the quality and scope of these studies did not fit those of the current study. Finally, 61 studies were included by excluding 72 studies. The included studies were divided into two categories based on them pertaining to either the status of TB among HWs or the risk factors of TB among HWs. Fig. 1 demonstrated the article selection flow.
The detailed description of the studies included in each type is as follows. The proportions and numbers of the major studies according to the geographic locations were: America 5%; Europe 23%; Asia 49%; and Africa 23%. The test methods used for the diagnosis of TB included interferon-gamma releasing assay (IGRA), 12%; tuberculin skin test (TST), 23%; survey questionnaire, 13%; and others/multiple tests, 50%. The test methods in the latter category included acid fast bacilli (AFB) stains, chest X-ray (CXR), genotyping data, and several studies used TST and IGRA together.
Both TST and QuantiFERON-TB Gold-In-Tube (QFT-GIT) are immunoassay tests used to determine whether the TB infection is latent or active. TST is considered positive if the skin over the injected portion is swollen (> 10 mm) within 48–72 hours after injecting it with Mycobacterium tuberculosis purified protein derivative. QFT-GIT is a cytokine release test, and interferon-gamma is higher than a certain level in patients with TB infection (including LTBI and active TB).
Table 1 showed the TB infection status among HWs. Based on the results of 39 studies, 29.94% of the HWs were found to be positive for TB. We compared the prevalence by the geographical location, gender, and screening test. Most of the European countries, except Italy, had about 30% positive cases. In Italy, 6.1% (TST positive) of the cases were positive in 2017 [5] compared to 4.3% in 2014 [6]. Infection rates in the other countries and the corresponding years were as follows, 27% (UK, 2017) [7]; 55.3% (Norway, 2013) [8]; QuantiFERON-TB (QFT) positive: 3.4%, TST positive: 55.3% (≥ 6 mm), 13.7% (≥ 15 mm), TST, QFT both positive: 4.7% (Georgia, 2013) [9]; 20.6% (Germany, 2011) [10]; 24.0% (Germany, 2010) [11]; and 16.2% (Portugal, 2011) [12]. Asia, like Europe, had an average of about 30% positive cases. However, Taiwan and Thailand had particularly higher rates, as follows: 24.4% (Taiwan, 2015, AFB staining) [13]; 88.8% (Taiwan, 2015, TST) [14]; 66.3% (Thailand, 2012, AFB staining) [15]. In China, the rates decreased slightly in 2015 (11.4%) [16] but again increased to 33.9% in 2019 [17], similar to the trend seen in 2013 (33.6%) [18]. In Korea, the infection rate showed a decreasing trend: 26.9% (2017) [19]; 41.4% (2013) [20]; and 33.3% (2011) [21]. Nepal and Malaysia had lower prevalence rates of 10.4% (2017) [22] and 10.6% (2011), respectively [23], while India's rate in 2017 was 36.8% [24]. In the American continent, the reported prevalence was 39.4% (Brazil, 2017) [25]; 56% (Peru, 2010) [26]; 4.2% (USA, 2014) [27]; 3% (USA, 2012) [28]; 5.7% (Canada, 2012) [29]; and 15.4% (Cuba, 2011) [30].
Table 1
Summary of published studies meeting inclusion criteria for the TB among HWs
| Number | Author | Publication year | Country | Study design | Participants | Tuberculosis assessment | Prevalence or incidence |
|---|---|---|---|---|---|---|---|
| 1 | Chen et al. [16] | 2019 | China | Cross-sectional study | 487 | Questionnaire and IGRA for TB | IGRA positive: 33.9% |
| 2 | Nichimura et al. [51] | 2018 | Japan | Prospective cohort study | 328 | IGRA for TB | HW: 0.149/100 person-years |
| Nursing student: 0.0825/100 person-years | |||||||
| 3 | Bukhary et al. [52] | 2018 | Saudi Arabia | Cross-sectional study | 520 | IGRA for TB | QFT-GIT positive: 56/520 (10.8%) |
| 4 | Henderson et al. [7] | 2017 | UK | Cross-sectional study | 587 | IGRA for TB | IGRA positive: 27% |
| 5 | Shrestha et al. [22] | 2017 | Nepal | Cross-sectional study | 560 | Self-administered questionnaire and CXR | Direct contact with patients: 76.8% |
| Cough > 2 weeks: 10.4% | |||||||
| Chest radiography: 20.0% | |||||||
| 6 | Lacerda et al. [25] | 2017 | Brazil | Cross-sectional study | 708 | Questionnaire and IGRA | LTBI prevalence: 27% (n = 196; 95% CI: 24%–31%) |
| 7 | Lacerda et al. [25] | 2017 | Brazil | Cross-sectional study | 218 | TST | TST positive: 39.4% (95% CI: 32.9–45.9) and 54.1% (95% CI: 47.4–60.7) |
| 8 | Yoon et al. [32] | 2017 | Korea | Cross-sectional study | 902 | TST, IGRA | TB patient care ≥ 1 year or more: 19.5% (176/902) |
| TST positive: 26.9% (243/902) | |||||||
| LTBI: 5.8% (52/902) | |||||||
| 9 | Janagond et al. [24] | 2017 | India | Prospective cohort study | 206 | Questionnaires, TST | TST positive: 36.8% (76/206) |
| 10 | Napoli et al. [5] | 2017 | Italy | Cross-sectional study | 2,290 | QFT, TST | TST positive: 141 (6.1%) |
| QFT positive: 16.4% | |||||||
| 11 | Gehanno et al. [40] | 2017 | France | Retrospective study | 233,389 | Questionnaires | Nurse, health care assistants: 5.7/100,000 |
| Administrative staff: 1.27/100,000 | |||||||
| 12 | Pan et al. [13] | 2015 | Taiwan | Matched cohort study | 44 | AFB staining | Smear positive: 26.8% (11/41) |
| Culture proven: 70.7% (29/41) | |||||||
| Pathologically diagnosed: 9.8% (4/41) | |||||||
| Clinically diagnosed: 24.4% (10/41) | |||||||
| 13 | He et al. [17] | 2015 | China | Longitudinal study | 880 | TST, QFT | TST positive: 11.4% |
| QFT-GIT: 19.1% (OR: 142.62, 95% CI: 1.39–4.97) | |||||||
| BCG scar: OR: 0.53, 95% CI: 0.28–1.00 | |||||||
| 14 | Adams et al. [33] | 2015 | South Africa | Prospective cohort study | 764 | TST, QFT, CXR | TST positive: 38% |
| QFT-GIT positive: 13%–22% | |||||||
| 15 | Hung et al. [14] | 2015 | Taiwan | Prospective cross-sectional study | 193 | QFT-G, TST | TST positive: 88.8% |
| QFT-GIT positive: 14.5% | |||||||
| Multivariable logistic regression: only the QFT-G test was associated with age (35 years or greater) (adjusted OR: 2.53, p = 0.03) | |||||||
| 16 | Chen et al. [31] | 2014 | China | Retrospective study | 996 | Sputum smear | TB: females > males (58.0% > 42.0%) |
| TB positive: males > females (88.5% > 83.4%, p = 0.031) | |||||||
| 17 | Garcell et al. [34] | 2014 | Qatar | Cross-sectional study | 202 | TST, QFT-G | TST positive: 6.9% |
| QFT-G positive: 3.0% | |||||||
| TB positive is older than negative (44.5 vs. 38.9 years) | |||||||
| More experience as HWs (21.7 vs. 16.8 years) | |||||||
| Direct contact with Tb patients (83.3% vs. 25%) | |||||||
| 18 | Szep et al. [27] | 2014 | USA | Cross-sectional study | 95 | TST | TST positive: 4.2% or 6.87 per 1,000 person weeks (95% CI: 1.87–17.60). |
| 19 | Muzzi et al. [6] | 2014 | Italy | Cross-sectional study | 388 | TST | TST at T1 was positive: 11 (4.3%). ARTI was 1.6 (95% CI: 0.9–2.9) per 100 person-years |
| TST at T2 was positive: 9 (3.7%) | |||||||
| HWs PEARTI was 26 (95% CI 13.6–50) per 100 person-years | |||||||
| 20 | Wei et al. [18] | 2013 | China | Observational study | 210 | IGRA, TST | QFT-GIT positive: 161 (76.7%) |
| QFT-GIT negative: 10 (19.01%) | |||||||
| Indeterminate results: 9 (4.3%) | |||||||
| (κ = 0.456, p < 0.001) | |||||||
| 21 | Gran et al. [8] | 2013 | Norway | Cross-sectional study | 387 | QFT, TST | QFT-GIT positive: 3.4% |
| TST (≥ 6 mm): 214 (55.3%) | |||||||
| TST (≥ 15 mm): 53 (13.7%) | |||||||
| QFT, TST positive: 10 (4.7%) | |||||||
| 22 | Whitaker et al. [9] | 2013 | Georgia | Prospective longitudinal study | 319 | TST, QFT-GIT | HWs from TB unit had higher prevalence of positive QFT-GIT and TST than those from non-TB unit: 107/194 (55%) vs. 30/125 (31%) QFT-GIT positive (p < 0.0001) and 128/189 (69%) vs. 64/119 (54%) TST positive (p = 0.01) |
| 23 | Kiertiburanakul et al. [15] | 2012 | Thailand | Prospective study | 1,438 | TST | TST positive: 66.3% |
| TST conversion: 4.8 per 100 HCP-year | |||||||
| 9 (0.6%) HCP were diagnosed with active TB | |||||||
| 24 | Larcher et al. [53] | 2012 | Italy | Cross-sectional study | 621 | TST, QFT | TST positive: 29.1% |
| QFT positive: 18.5% | |||||||
| 25 | Zwerling et al. [29] | 2012 | Canada | Prospective longitudinal study | 388 | TST, QFT | TST positive: 5.7% (22/388, 95% CI: 3.6%–8.5%) |
| QFT positive: 6.2% (24/388, 95% CI: 4%–9.1%) | |||||||
| 26 | Borroto et al. [30] | 2011 | Cuba | Cross-sectional study | 350 | TST | LTBI prevalence: 15.4%: it was highest in professionals (20.6%); 60.3% were non-reactors, and at the second test a year later 1.4% were converters |
| 27 | Moon et al. [21] | 2011 | Korea | Cross-sectional study | 173 | TST, QFT | QFT-GIT positive: 21.4% |
| TST positive: 33.3% | |||||||
| κ = 0.234 | |||||||
| 28 | Sherman et al. [10] | 2011 | Germany | Retrospective cohort study | 450 | TST | TST conversion: 93 |
| 29 | Kehinde et al. [54] | 2011 | Nigeria | Descriptive study | 271 | Pre-tested questionnaire | AFB stain positive: 9 (3.3%) |
| Culture positive: 6 (2.2%) | |||||||
| The culture contamination: 1.8 per cent | |||||||
| 30 | Costa et al. [12] | 2011 | Portugal | Cross-sectional study | 376 | QFT, TST | TST positive: 61 |
| 31 | Rafiza et al. [23] | 2011 | Malaysia | Cross-sectional study | 954 | QFT, TST | The overall prevalence of latent tuberculosis infection among Health workers was 10.6% (CI: 8.6%–12.6%) |
| 32 | Park et al.[55] | 2010 | Korea | Prospective study | 322 | QFT, TST | Both positive: 25 subjects (8%) |
| Follow-up after 1 year | |||||||
| QFT-GIT positive: between 3.3% and 5.7% | |||||||
| 33 | Cadmus et al. [56] | 2010 | Nigeria | Retrospective study | 101 | AFB | AFB positive: 10 (13%) |
| 34 | Escombe et al. [26] | 2010 | Peru | Cross-sectional study | 845 | QFT | QFT-GIT positive: 39 (56%) |
| 35 | Lambert et al. [28] | 2012 | USA | Cross-sectional study | 200,744 | TST | TST positive: 6,049 (3%) |
| 36 | Schablon et al. [11] | 2010 | Germany | Cross-sectional study | 2,028 | IGRA | QFT-GIT positive: 198 (9.9%) |
| TST positive: 480 (24.0%) | |||||||
| 37 | Jo et al. [20] | 2013 | Korea | Cross-sectional study | 493 | TST, QFT | Doctors (n = 99): TST positive: 63 (41.4%)/QFT-GIT positive: 36 (23.7%) |
| Nurse (n = 168): TST positive: 119 (34.9%)/QFT-positive: 49 (14.4%) |
TB: tuberculosis; HW: health worker; IGRA: interferon-gamma releasing assay; QFT-GIT: QuantiFERON-TB Gold-In-Tube; CXR: chest X-ray; LTBI: latent TB infection; CI: confidence interval; TST: tuberculin skin test; QFT: QuantiFERON-TB; AFB: acid fast bacilli; BCG: Bacillus Calmette-Guerin; QFT-G: QuantiFERON-TB Gold; PEARTI: post-exposure rate of tuberculosis infection.
There were 4 articles reported the prevalence of LTBI from thirty-eight articles about TB infection status. The status of LTBI was different by countries, in Korea 5.8% [19]; in Malaysia 10.6% [23]; in Cuba 15.4% [30]; in Brazil 27.0% [25].
Higher TB infection rates were identified in women (women, 58.0% and men, 42.0%) [31]. The positive rates with the QFT-GIT test (5.8%, 52/902) were lower than those with the TST (26.9%, 243/902) for LTBI [32]. Several other studies showed a similar trend as follows: TST: 38% and QFT: 13%–22% [33]; TST: 88.8% and QFT: 14.5% [14]; TST: 6.9% and QFT: 3.0% [34]; and TST: 55.3% and QFT: 3.4% [8].
Table 2 showed TB infection related risk factors status among HWs. Risk factors such as old age, long work-duration, lack of Bacillus Calmette-Guerin (BCG) vaccination, nursing professionals, TB contacts, and lower body mass index (BMI) were identified. Patients older than 51 years showed a higher TB infection rate (OR: 6.17, 95% confidence interval [CI]: 1.35–28.28) [35]. Age > 30 years was associated with a positive TST (p = 0.02 [19]; age ≥ 30 years, OR: 18.88, 95% CI: 1.52–234.36 [36]; being older, OR: 1.10, 95% CI: 1.06–1.13, p < 0.001 [37]).
Table 2
Summary of published studies meeting inclusion criteria for risk factors of TB among HWs
| Number | Author | Year | Country | Study design | Participants | Tuberculosis assessment | Estimate of risk |
|---|---|---|---|---|---|---|---|
| 1 | Wang et al. [35] | 2018 | China | Cross-sectional study | 212 | Positive sputum acid-fast stains | TB: 760/100,000, RF: 51 years and above (aOR: 6.17, 95% CI: 1.35–28.28), being a nurse (aOR: 3.09, 95% CI: 1.15–8.32) |
| 2 | Kim et al. [19] | 2017 | Korea | Prospective cohort study | 872 | TST, CXR | Age over 30 years: (p = 0.02), LTBI point prevalence: 6.6%, LTBI incidence: 2.4 per 100 HWs |
| 3 | Davidson et al. [57] | 2017 | UK | Retrospective cohort study | 2,320 | TB surveillance, genotyping data | HWs: 23.4 (95% CI: 22.5–24.4), non-HWs: 16.2 (95% CI: 16.0–16.3) |
| 4 | Belo et al. [38] | 2017 | Mozambique | Cross-sectional study | 316 | Symptom screening questionnaire | LTBI: 34.4%, working > 8 years: 39.3%, no BCG vaccine: 39.6%, immunocompromised: 78.1% |
| 5 | Du et al. [48] | 2017 | China | Cross-sectional study | 186 | Questionnaires | Medical professionals (PR = 2.40), laboratory technicians (PR = 2.17), other hospital staff (PR = 1.04) |
| 6 | Bonini et al. [39] | 2017 | Italy | Cross-sectional study | 580 | Questionnaires, TST | Previous BCG vaccination: OR: 344, CI: 43.72–2,718.41, p < 0.001, origin in high-risk countries: OR: 401.68, CI: 50.60–3,188.69, p < 0.001 |
| 7 | Weng et al. [58] | 2016 | Swaziland | Cross-sectional study | 186 | Questionnaires | Nurses (OR: 39.87, 95% CI: 2.721–584.3), other HWs (OR: 99.34, 95% CI: 7.469–1,321) |
| 8 | Nonghanphithak et al. [36] | 2016 | Thailand | Cross-sectional study | 112 | QFT, questionnaires | Age ≥ 30 years (OR: 18.88, 95% CI: 1.52–234.36), nurse (OR: 2.78, 95% CI: 1.19–6.49), job for ≥ 10 years (OR: 8.78, 95% CI: 1.26–61.29) |
| 9 | Tudor et al. [43] | 2016 | South Africa | Case-control study | 307 | Questionnaires | HWs living with HIV (OR: 6.35, 95% CI: 3.54–11.37) spent time working in areas with patients (OR: 2.24; 95% CI: 1.40–3.59) |
| 10 | Ito et al. [41] | 2016 | Japan | Retrospective study | 875 | IGRA, CXR | Multivariate analysis (OR: 8.2, 95% CI: 1.3–78.3, p = 0.03), longer duration of contact (> 7 days, 12/12 [100%], vs. ≤ 7 days, 18/43 [41.9%]; p = 0.0002), fewer symptoms (> 7 days, 5/12 [41.7%] vs. ≤ 7 days, 35/43 [81.4%]; p = 0.01). |
| 11 | Tsang et al. [59] | 2015 | Hong Kong | Prospective cohort study | 279 | IGRA, QFT | QFT-GIT positive: (exposed: 19.5%, non-exposed: 20.8%, RR = 0.96, 95% CI: 0.74–1.25, p > 0.05) |
| 12 | Agaya et al. [60] | 2015 | Kenya | Cross-sectional survey | 1,416 | Standardized questionnaire | LTBI prevalence: (p = 0.72), work year: p < 0.01 |
| 13 | McCarthy et al. [61] | 2015 | South Africa | Cross-sectional study | 199 | IGRA, TST | Incident LTBI (IGRA): 25/97 (26%; incident rate 29 cases/100 person-years, 95% CI: 20–44), TST: 25/93 (27%; incident rate 29 cases/100 person-years, 95% CI: 19–42) |
| 14 | Rutanga et al. [62] | 2015 | Rwanda | Cross-sectional study | 1,131 | TST | LTBI prevalence: (62.1%), TST positive odds TST: 2.71 times greater (95% CI: 2.01–3.67), work year odds: increasing 4% (aOR: 1.04, 95% CI: 1.02%–1.05%) per year |
| 15 | Chu et al. [63] | 2014 | Taiwan | Population-based cohort study | 11,811 | Chart review | TB incidence: HWs vs matched subjects (61.08 vs. 37.81 per 100,000 person-years) |
| Risk of TB: HWs (aHR: 1.62, 95% CI: 1.08–2.43) | |||||||
| 16 | Tudor et al. [43] | 2014 | South Africa | Retrospective cohort study | 1,313 | Chart review | HWs living with HIV had a greater incidence of TB (IRR: 3.2, 95% CI: 1.54–6.66) than HIV-negative HWs |
| 17 | Zhou et al. [64] | 2014 | China | Cross-sectional study | 712 | TST | TB hospital: 58.0% (n = 127), non-TB hospital: 33.9% (n = 105) (OR: 2.40, 95% CI:1.59–3.62), (6–10 years vs. ≤ 5 years [OR: 1.89, 95% CI: 1.10–3.25] and > 10 vs. ≤ 5 [OR:1.80; 95% CI: 1.20–2.68]) |
| 18 | Claassens et al. [65] | 2013 | South Africa | Cross-sectional study | 133 | Sputum smear | The infection control audit score: OR: 1.04, 95% CI: 1.01–1.08, p = 0.02, the number of staff: OR: 3.78, 95% CI: 1.77–8.08, the number of staff remained: OR: 3.33, 95% CI: 1.37–8.08 |
| 19 | Durando et al. [66] | 2013 | Italy | Cross-sectional study | 881 | TST | Born in high TB incidence areas (≥ 20 cases per 100,000 population) |
| 20 | Kim et al. [37] | 2013 | Korea | Cross-sectional study | 2,132 | TST | TST positive: 778 (36.5%), being older (OR: 1.10, 95% CI: 1.06–1.13, p < 0.001), male (OR: 1.78, 95% CI: 1.21–2.62, p = 0.003), re-joining the hospital workforce (OR: 1.58, 95% CI: 1.04–2.40, p = 0.032) |
| 21 | Casas et al. [67] | 2013 | Spain | Cohort analysis | 614 | TST | High risk worker hazard ratio: 1.55 (95% CI: 1.05–2.27) gender, age and professional status |
| 22 | Mathew et al. [42] | 2013 | South India | Case-control study | 101 | TST | BMI < 19 kg/m2 (OR: 2.96, 95% CI: 1.49–5.87), contact with patients (OR: 2.83, 95% CI: 1.47–5.45), being employed in medical wards (OR: 12.37, 95% CI: 1.38–110.17), microbiology laboratories (OR: 5.65, 95% CI: 1.74–18.36) |
| 23 | He et al. [68] | 2012 | China | Cross-sectional study | 999 | TST, QFT-GIT | QFT-GIT-positive: 683 (68%) associated with greater age, longer HW career, TB disease in a co-worker and greater daily patient exposure using multivariable analysis |
TB: tuberculosis; HW: health worker; RF: risk factor; aOR: adjusted odds ratio; CI: confidence interval; TST: tuberculin skin test; CXR: chest X-ray; LTBI: latent tuberculosis infection; BCG: Bacillus Calmette-Guerin; PR: prevalence ratio; OR: odds ratio; QFT: QuantiFERON-TB; HIV: human immunodeficiency virus; IGRA: interferon-gamma releasing assay; QFT-GIT: QuantiFERON-TB Gold-In-Tube; RR: risk ratio; BMI: body mass index.
The longer the number of work years of the HWs was, the higher the TB infection rate was. For instance, 39.3% HWs with work years > 8 years were TB positive [38], work years ≥ 10 years were also associated with a higher risk [36]. TB infection rates were also higher in the HWs (39.6%) [38] who did not receive the BCG vaccination with a study reporting an OR of 344 (CI: 43.72–2,718.41, p < 0.00001) [39].
Nurses had a higher OR than the other HWs (being a nurse, OR: 3.09, 95% CI: 1.15–8.32 [35]; nurses OR: 39.87, 95% CI: 2.721–584.3 and other HWs, OR: 99.34, 95% CI: 7.469–1,321 [40]; and nurses, OR: 2.78, 95% CI: 1.19–6.49 [36]).
There was an increased risk for TB with longer working durations (> 7 days, 12/12 [100%] vs. ≤ 7 days, 18/43 [41.9%]; p = 0.0002) [41] and direct contact with patients (OR: 2.83, 95% CI: 1.47–5.45) [42]. The infection was also observed more frequently in underweight HWs (BMI < 18.5, OR: 2.96, 95% CI: 1.49–5.87) [42], or in HWs with human immunodeficiency virus (OR: 6.35, 95% CI: 3.54–11.37) [43].
Our results showed that the risk for TB among HWs was higher than that of the general population worldwide. Furthermore, differences were found in this association according to the geographical location. Risk factors for LTBI included old age, long work-duration, nursing professionals, lack of BCG vaccination, and lower BMI.
Overall, 29.94% of the HWs were found to be TB test positive. The rates were lower in Italy (4%–6%) and higher in Thailand and Taiwan. However, there was no significant difference between the TB infection rate of HWs in Taiwan and that of the general population. This suggests that HWs in countries with intermediate TB burden, face a similar risk of exposure to TB as the community, and that appropriate personal protection equipment and good infection control practices within a hospital effectively mitigates the transmission of TB in healthcare settings. Further, HWs who did not report an exposure to TB may have been unknowingly exposed to it either within the hospital or in the community [14]. However, these results must be interpreted with caution because TB infection status could be different by TB diagnosis tools.
Studies from different geographical locations were examined. As TB prevalence is still high in Asia and continental Europe, the research in these regions appeared to be more active than in the Americas. In France, the incidence of TB among the nurses and paramedics was not higher than the general public. This probably reflects the effectiveness of the measures implemented over the last decade to prevent the transmission of TB in the health care industry, as well as an overall decline of TB in the general population.
In our review, the prevalence of TB positive in doctors and nurses were high, which was similar to the existing literature. In terms of the occupation, TB prevalence was highest in the nurses, followed by doctors. This was probably due to their close proximity with the patients, particularly those with severe infections requiring high-risk investigations, such as bronchoscopy [35].
For the diagnosis, most of the studies used IGRA and TST together, while some others used either IGRA or TST, individually. Others employed questionnaires alone or along with the test. Additionally, AFB stains, CXR, and genotyping data were also used. TST and IGRA are currently used as the basis for LTBI screening and have different guidelines in different countries. Two or more screening methods are recommended for TB screening in adult and immunocompromised populations. Sometimes one test can provide an advantage over the other. For example, the IGRA is preferred over TST in groups where BCG is administered after infancy or at multiple times. However, none of the present LTBI tests fulfil the requirement of early diagnosis of TB. In a study comparing the results of IGRA and TST conducted in Saudi Arabia for medical workers, the following results were found. The disagreements between the two tests were relatively high (kappa co-efficient = 0.312 ± 0.026, p < 0.00001) as TST positive/QFT negative discordance was 54.8% while TST negative/QFT positive discordance was 15.7% [44]. Therefore, supplementary testing methods such as CXR, AFB stains and questionnaires should be used.
Various risk factors were identified. Aging, diabetes mellitus and low BMI, are known factors of immunological imbalance associated with TB development in the general population [45]. The reason for higher TB infection in older HWs and longer work years was due to an increased contact with TB patients in addition to the aging and decline in the immunity [35]. Although a low BMI is associated with active TB, it can be interpreted as a consequence of TB rather than as a risk factor [42,46].
According to the World Health Organization (WHO) guidelines, strict clinical observation and close monitoring for the development of active TB for at least two years is preferred over the provision of preventive treatment for contacts of multidrug-resistant-TB cases. In cases where preventive therapy is considered for such individuals, the program should ensure that the necessary resources are available to provide quality-assured drug susceptibility testing and the necessary medications, and to closely monitor for any harm, breakthrough disease, and acquired resistance [47].
In many of the countries, despite the increasing risk of TB infection in HWs, the quality of occupational health and safety, and infection prevention and control have not improved significantly. Evidence-based investment of effort is required for the effective risk reduction for HWs [48,49].
The Republic of Korea has a moderate TB prevalence (85–110/100,000 population per year) and BCG vaccination is recommended at birth [37]. Until 1997, the BCG vaccine was given at birth and repeated at the age of 12 or 13 years if the child proved to be a TST non-responder. However, revaccination was stopped in 1997 according to the WHO recommendation in 1995 due to the lack of evidence [50].
Further research is needed to assess the change in regional surveillance systems in different countries, depending on the development of respective national health conditions. We also need a country- and age-wise evaluation of the effectiveness of the BCG vaccination.
In conclusion, this study showed that HWs were at higher risk for developing TB. It further emphasized on the need for sound TB infection control measures, including early diagnosis and prompt treatment, for its effective prevention in HWs and the general public.
Abbreviations
AFB
acid fast bacilli
aOR
adjusted odds ratio
ARTI
annual rate of tuberculosis infection
BCG
Bacillus Calmette-Guerin
BMI
body mass index
CI
confidence interval
CXR
chest X-ray
GIT
QuantiFERON-TB Gold-In-Tube
HIV
human immunodeficiency virus
HR
hazard ratio
HW
health worker
IGRA
interferon-gamma release assay
IRR
Incidence rate ratio
LTBI
latent tuberculosis infection
OR
odds ratio
PR
prevalence ratio
QFT
QuantiFERON-TB
QTF-PEARTI
post-exposure rate of tuberculosis infection
RF
risk factor
RR
risk ratio
TB
tuberculosis
TST
tuberculin skin test
WHO
World Health Organization
-
Competing interests: The authors declare that they have no competing interest.
-
Author Contributions:
NOTES
- 1. Zwerling A, van den Hof S, Scholten J, Cobelens F, Menzies D, Pai M. Interferon-gamma release assays for tuberculosis screening of healthcare workers: a systematic review. Thorax 2012;67(1):62–70. 21228420.ArticlePubMed
- 2. Dharmadhikari AS, Mphahlele M, Venter K, Stoltz A, Mathebula R, Masotla T, et al. Rapid impact of effective treatment on transmission of multidrug-resistant tuberculosis. Int J Tuberc Lung Dis 2014;18(9):1019–1025. 25189547.ArticlePubMedPMC
- 3. von Delft A, Dramowski A, Khosa C, Kotze K, Lederer P, Mosidi T, et al. Why healthcare workers are sick of TB. Int J Infect Dis 2015;32:147–151. 25809771.ArticlePubMed
- 4. Baussano I, Nunn P, Williams B, Pivetta E, Bugiani M, Scano F. Tuberculosis among health care workers. Emerg Infect Dis 2011;17(3):488–494. 21392441.ArticlePubMedPMC
- 5. Napoli C, Ferretti F, Di Ninno F, Orioli R, Marani A, Sarlo MG, et al. Screening for tuberculosis in health care workers: experience in an Italian teaching hospital. BioMed Res Int 2017;2017:7538037. 28337457.ArticlePubMedPMCPDF
- 6. Muzzi A, Seminari E, Feletti T, Scudeller L, Marone P, Tinelli C, et al. Post-exposure rate of tuberculosis infection among health care workers measured with tuberculin skin test conversion after unprotected exposure to patients with pulmonary tuberculosis: 6-year experience in an Italian teaching hospital. BMC Infect Dis 2014;14(1):324. 24919953.ArticlePubMedPMCPDF
- 7. Henderson M, Howard SJ. Screening for latent tuberculosis in UK health care workers. Occup Med (Lond) 2017;67(8):641–643. 29016903.ArticlePubMed
- 8. Gran G, Aßmus J, Dyrhol-Riise AM. Screening for latent tuberculosis in Norwegian health care workers: high frequency of discordant tuberculin skin test positive and interferon-gamma release assay negative results. BMC Public Health 2013;13(1):353. 23590619.ArticlePubMedPMCPDF
- 9. Whitaker JA, Mirtskhulava V, Kipiani M, Harris DA, Tabagari N, Kempker RR, et al. Prevalence and incidence of latent tuberculosis infection in georgian healthcare workers. PLoS One 2013;8(3):e58202. 23536789.ArticlePubMedPMC
- 10. Sherman HA, Karakis I, Heimer D, Arzt M, Goldstein W, Bouhnik L, et al. Housekeeping health care workers have the highest risk for tuberculin skin test conversion. Int J Tuberc Lung Dis 2011;15(8):1050–1055. 21740667.ArticlePubMed
- 11. Schablon A, Harling M, Diel R, Nienhaus A. Risk of latent TB infection in individuals employed in the healthcare sector in Germany: a multicentre prevalence study. BMC Infect Dis 2010;10(1):107. 20429957.ArticlePubMedPMCPDF
- 12. Torres Costa J, Silva R, Sá R, Cardoso MJ, Nienhaus A. Serial testing with the interferon-γ release assay in Portuguese healthcare workers. Int Arch Occup Environ Health 2011;84(4):461–469. 20721576.ArticlePubMedPMC
- 13. Pan SC, Chen YC, Wang JY, Sheng WH, Lin HH, Fang CT, et al. Tuberculosis in healthcare workers: a matched cohort study in Taiwan. PLoS One 2015;10(12):e0145047. 26679188.ArticlePubMedPMC
- 14. Hung WT, Lee SS, Sy CL, Wu KS, Chen JK, Tsai HC, et al. Prevalence of latent tuberculosis infection in BCG-vaccinated healthcare workers by using an interferon-gamma release assay and the tuberculin skin test in an intermediate tuberculosis burden country. J Microbiol Immunol Infect 2015;48(2):147–152. 24071516.ArticlePubMed
- 15. Kiertiburanakul S, Suebsing S, Kehachindawat P, Apivanich S, Somsakul S, Sathapatayavongs B, et al. Five-year prospective study of tuberculin skin testing among new healthcare personnel at a university hospital in Thailand. J Hosp Infect 2012;80(2):173–175. 22192172.ArticlePubMed
- 16. Chen B, Gu H, Wang X, Wang F, Peng Y, Ge E, et al. Prevalence and determinants of latent tuberculosis infection among frontline tuberculosis healthcare workers in southeastern China: a multilevel analysis by individuals and health facilities. Int J Infect Dis 2019;79:26–33. 30471404.ArticlePubMed
- 17. He G, Li Y, Zhao F, Wang L, Cheng S, Guo H, et al. The prevalence and incidence of latent tuberculosis infection and its associated factors among village doctors in China. PLoS One 2015;10(5):e0124097. 25996960.ArticlePubMedPMC
- 18. Wei Z, Yang M, Quan B, Wang Y, Wu Y, Ji B. Prevalence of latent tuberculosis infection among healthcare workers in China as detected by two interferon-gamma release assays. J Hosp Infect 2013;84(4):323–325. 23806839.ArticlePubMed
- 19. Kim YJ, Chi YH, Lee JY, Lee HJ, Kang JY, Kim YR, et al. In-hospital contact investigation among health care workers after exposure to pulmonary tuberculosis in an intermediate tuberculosis prevalence area: a prospective study. Arch Environ Occup Health 2017;72(5):272–278. 27471918.ArticlePubMed
- 20. Jo KW, Hong Y, Park JS, Bae IG, Eom JS, Lee SR, et al. Prevalence of latent tuberculosis infection among health care workers in South Korea: a multicenter study. Tuberc Respir Dis 2013;75(1):18–24.ArticlePubMedPMC
- 21. Moon HW, Kim H, Hur M, Yun YM, Lee A. Latent tuberculosis infection screening for laboratory personnel using interferon-γ release assay and tuberculin skin test in Korea: an intermediate incidence setting. J Clin Lab Anal 2011;25(6):382–388. 22086790.ArticlePubMedPMC
- 22. Shrestha P, Shakya M, Caws M, Shrestha S, Karki B, Shrestha S, et al. Tuberculosis in staff and students of Patan hospital. J Nepal Health Res Counc 2018;15(3):268–274. 29353901.ArticlePubMed
- 23. Rafiza S, Rampal KG, Tahir A. Prevalence and risk factors of latent tuberculosis infection among health care workers in Malaysia. BMC Infect Dis 2011;11(1):19. 21244645.ArticlePubMedPMCPDF
- 24. Janagond AB, Ganesan V, Vijay Kumar GS, Ramesh A, Anand P, Mariappan M. Screening of health-care workers for latent tuberculosis infection in a Tertiary Care Hospital. Int J Mycobacteriol 2017;6(3):253–257. 28776523.ArticlePubMed
- 25. Lacerda TC, Souza FM, Prado TN, Locatelli RL, Fregona G, Lima RC, et al. Tuberculosis infection among primary health care workers. J Bras Pneumol 2017;43(6):416–423. 29340489.ArticlePubMedPMC
- 26. Escombe AR, Huaroto L, Ticona E, Burgos M, Sanchez I, Carrasco L, et al. Tuberculosis transmission risk and infection control in a hospital emergency department in Lima, Peru. Int J Tuberc Lung Dis 2010;14(9):1120–1126. 20819256.PubMed
- 27. Szep Z, Kim R, Ratcliffe SJ, Gluckman S. Tuberculin skin test conversion rate among short-term health care workers returning from Gaborone, Botswana. Travel Med Infect Dis 2014;12(4):396–400. 23932600.ArticlePubMed
- 28. Lambert LA, Pratt RH, Armstrong LR, Haddad MB. Tuberculosis among healthcare workers, United States, 1995-2007. Infect Control Hosp Epidemiol 2012;33(11):1126–1132. 23041811.ArticlePubMedPMC
- 29. Zwerling A, Cojocariu M, McIntosh F, Pietrangelo F, Behr MA, Schwartzman K, et al. TB screening in Canadian health care workers using interferon-gamma release assays. PLoS One 2012;7(8):e43014. 22916197.ArticlePubMedPMC
- 30. Borroto S, Gámez D, Díaz D, Martínez Y, Ferrer AI, Velásquez Y, et al. Latent tuberculosis infection among health care workers at a general hospital in Santiago de Cuba. Int J Tuberc Lung Dis 2011;15(11):1510–1514. 22008765.ArticlePubMed
- 31. Chen B, Wang X, Zhong J, Chen S, Wu B, Yeh HC, et al. Tuberculosis among healthcare workers in southeastern China: a retrospective study of 7-year surveillance data. Int J Environ Res Public Health 2014;11(11):12042–12052. 25419877.ArticlePubMedPMC
- 32. Yoon CG, Oh SY, Lee JB, Kim MH, Seo Y, Yang J, et al. Occupational risk of latent tuberculosis infection in health workers of 14 military hospitals. J Korean Med Sci 2017;32(8):1251–1257. 28665059.ArticlePubMedPMCPDF
- 33. Adams S, Ehrlich R, Baatjies R, van Zyl-Smit RN, Said-Hartley Q, Dawson R, et al. Incidence of occupational latent tuberculosis infection in South African healthcare workers. Eur Respir J 2015;45(5):1364–1373. 25700382.ArticlePubMedPMC
- 34. Guanche Garcell H, Crespo Ramirez E, Kindelan Contreras A, Gutierrez Garcia F. Latent tuberculosis infection in healthcare workers at a community hospital in Qatar. J Infect Public Health 2014;7(4):356–359. 24702746.ArticlePubMed
- 35. Wang XN, He TL, Geng MJ, Song YD, Wang JC, Liu M, et al. Prevalence of and risk factors for tuberculosis among healthcare workers in Chinese tuberculosis facilities. Infect Dis Poverty 2018;7(1):26. 29592797.ArticlePubMedPMCPDF
- 36. Nonghanphithak D, Reechaipichitkul W, Chaiyasung T, Faksri K. Risk factors for latent tuberculosis infection among health-care workers in northeastern thailand. Southeast Asian J Trop Med Public Health 2016;47(6):1198–1208. 29634186.PubMed
- 37. Kim SY, Park MS, Kim YS, Kim SK, Chang J, Yong D, et al. Tuberculin skin test and boosted reactions among newly employed healthcare workers: an observational study. PLoS One 2013;8(5):e64563. 23717631.ArticlePubMedPMC
- 38. Belo C, Naidoo S. Prevalence and risk factors for latent tuberculosis infection among healthcare workers in Nampula Central Hospital, Mozambique. BMC Infect Dis 2017;17(1):408. 28595594.ArticlePubMedPMCPDF
- 39. Bonini S, Riccelli MG, Goldoni M, Selis L, Corradi M. Risk factors for latent tuberculosis infection (LTBI) in health profession's students of the University of Parma. Acta Biomed 2017;88(1S):54–60.
- 40. Gehanno JF, Abiteboul D, Rollin L. Incidence of tuberculosis among nurses and healthcare assistants in France. Occup Med (Lond) 2017;67(1):58–60. 27694378.ArticlePubMed
- 41. Ito Y, Nagao M, Iinuma Y, Matsumura Y, Yamamoto M, Takakura S, et al. Risk factors for nosocomial tuberculosis transmission among health care workers. Am J Infect Control 2016;44(5):596–598. 26777287.ArticlePubMed
- 42. Mathew A, David T, Thomas K, Kuruvilla PJ, Balaji V, Jesudason MV, et al. Risk factors for tuberculosis among health care workers in South India: a nested case-control study. J Clin Epidemiol 2013;66(1):67–74. 22521578.ArticlePubMed
- 43. Tudor C, Van der Walt ML, Margot B, Dorman SE, Pan WK, Yenokyan G, et al. Occupational risk factors for tuberculosis among healthcare workers in KwaZulu-Natal, South Africa. Clin Infect Dis 2016;62(Suppl 3):S255–S261. 27118855.ArticlePubMedPMC
- 44. Al Hajoj S, Varghese B, Datijan A, Shoukri M, Alzahrani A, Alkhenizan A, et al. Interferon gamma release assay versus tuberculin skin testing among healthcare workers of highly diverse origin in a moderate tuberculosis burden country. PLoS One 2016;11(5):e0154803. 27148876.ArticlePubMedPMC
- 45. Christopoulos AI, Diamantopoulos AA, Dimopoulos PA, Goumenos DS, Barbalias GA. Risk factors for tuberculosis in dialysis patients: a prospective multi-center clinical trial. BMC Nephrol 2009;10(1):36. 19895701.ArticlePubMedPMCPDF
- 46. Shetty N, Shemko M, Vaz M, D'Souza G. An epidemiological evaluation of risk factors for tuberculosis in South India: a matched case control study. Int J Tuberc Lung Dis 2006;10(1):80–86. 16466042.PubMed
- 47. World Health Organization. Guidelines on the Management of Latent Tuberculosis Infection. Geneva, Switzerland: WHO; 2015.
- 48. Cloete B, Yassi A, Ehrlich R. Repeat auditing of primary health-care facilities against standards for occupational health and infection control: a study of compliance and reliability. Saf Health Work 2020;11(1):10–18. 32206369.ArticlePubMedPMC
- 49. Liautaud A, Adu PA, Yassi A, Zungu M, Spiegel JM, Rawat A, et al. Strengthening human immunodeficiency virus and tuberculosis prevention capacity among South African healthcare workers: a mixed methods study of a collaborative occupational health program. Saf Health Work 2018;9(2):172–179. 29928531.ArticlePubMedPMC
- 50. World Health Organization. Global tuberculosis programme and global programme on vaccines. Statement on BCG revaccination for the prevention of tuberculosis. Wkly Epidemiol Rec 1995;70(32):229–231. 7669527.PubMed
- 51. Nishimura T, Ota M, Mori M, Fujiwara H, Takano Y, Kato S, et al. Risk of tuberculosis infection among health care workers and nursing students in Japan. J Infect Chemother 2018;24(11):921–924. 30181031.ArticlePubMed
- 52. Bukhary ZA, Amer SM, Emara MM, Abdalla ME, Ali SA. Screening of latent tuberculosis infection among health care workers working in Hajj pilgrimage area in Saudi Arabia, using interferon gamma release assay and tuberculin skin test. Ann Saudi Med 2018;38(2):90–96. 29620541.ArticlePubMedPMC
- 53. Larcher C, Frizzera E, Pretto P, Lang M, Sonnleitner N, Huemer HP. Immunosurveillance for Mycobacterium tuberculosis of health care personnel in a third level care hospital. Med Lav 2012;103(1):26–36. 22486073.PubMed
- 54. Kehinde AO, Baba A, Bakare RA, Ige OM, Gbadeyanka CF, Adebiyi OE. Pulmonary tuberculosis among health care workers at two designated DOTS Centers in urban city of Ibadan, Nigeria. Indian J Med Res 2011;133(6):613–617. 21727659.PubMedPMC
- 55. Park HY, Jeon K, Suh GY, Kwon OJ, Chung DR, Yoonchang SW, et al. Interferon-γ release assay for tuberculosis screening of healthcare workers at a Korean tertiary hospital. Scand J Infect Dis 2010;42(11-12):943–945. 20936910.ArticlePubMed
- 56. Cadmus SI, Okoje VN, Taiwo BO, van Soolingen D. Exposure of dentists to Mycobacterium tuberculosis, Ibadan, Nigeria. Emerg Infect Dis 2010;16(9):1479–1481. 20735939.ArticlePubMedPMC
- 57. Davidson JA, Lalor MK, Anderson LF, Tamne S, Abubakar I, Thomas HL. TB in healthcare workers in the UK: a cohort analysis 2009-2013. Thorax 2017;72(7):654–659. 26888779.ArticlePubMed
- 58. Weng YH, Bhembe PT, Chiou HY, Yang CY, Chiu YW. Perceived risk of tuberculosis infection among healthcare workers in Swaziland. BMC Infect Dis 2016;16(1):697. 27881088.ArticlePubMedPMCPDF
- 59. Tsang DN, Lai CK, Yam WC, Chan JW, Mok YW, Seto WH, et al. Use of interferon gamma release assay to assess latent tuberculosis infection among healthcare workers in Hong Kong. Hong Kong Med J 2015;21(Suppl 7):S22–S25. 26908269.PubMed
- 60. Agaya J, Nnadi CD, Odhiambo J, Obonyo C, Obiero V, Lipke V, et al. Tuberculosis and latent tuberculosis infection among healthcare workers in Kisumu, Kenya. Trop Med Int Health 2015;20(12):1797–1804. 26376085.PubMed
- 61. McCarthy KM, Scott LE, Gous N, Tellie M, Venter WD, Stevens WS, et al. High incidence of latent tuberculous infection among South African health workers: an urgent call for action. Int J Tuberc Lung Dis 2015;19(6):647–653. 25946353.ArticlePubMed
- 62. Rutanga C, Lowrance DW, Oeltmann JE, Mutembayire G, Willis M, Uwizeye CB, et al. Latent tuberculosis infection and associated factors among Health Care Workers in Kigali, Rwanda. PLoS One 2015;10(4):e0124485. 25919759.ArticlePubMedPMC
- 63. Chu H, Shih CJ, Lee YJ, Kuo SC, Hsu YT, Ou SM, et al. Risk of tuberculosis among healthcare workers in an intermediate-burden country: a nationwide population study. J Infect 2014;69(6):525–532. 25135230.ArticlePubMed
- 64. Zhou F, Zhang L, Gao L, Hao Y, Zhao X, Liu J, et al. Latent tuberculosis infection and occupational protection among health care workers in two types of public hospitals in China. PLoS One 2014;9(8):e104673. 25157814.ArticlePubMedPMC
- 65. Claassens MM, van Schalkwyk C, du Toit E, Roest E, Lombard CJ, Enarson DA, et al. Tuberculosis in healthcare workers and infection control measures at primary healthcare facilities in South Africa. PLoS One 2013;8(10):e76272. 24098461.ArticlePubMedPMC
- 66. Durando P, Sotgiu G, Spigno F, Piccinini M, Mazzarello G, Viscoli C, et al. Latent tuberculosis infection and associated risk factors among undergraduate healthcare students in Italy: a cross-sectional study. BMC Infect Dis 2013;13(1):443. 24059355.ArticlePubMedPMCPDF
- 67. Casas I, Esteve M, Guerola R, García-Olivé I, Roldán-Merino J, Martinez-Rivera C, et al. Incidence of tuberculosis infection among healthcare workers: risk factors and 20-year evolution. Respir Med 2013;107(4):601–607. 23312619.ArticlePubMed
- 68. He GX, Wang LX, Chai SJ, Klena JD, Cheng SM, Ren YL, et al. Risk factors associated with tuberculosis infection among health care workers in Inner Mongolia, China. Int J Tuberc Lung Dis 2012;16(11):1485–1491. 22964074.ArticlePubMed
REFERENCES
REFERENCES
Figure & Data
REFERENCES
Citations
Citations to this article as recorded by 
- Prevalence of Mycobacterium tuberculosis and risk factors among internally and externally displaced populations in northwestern Ethiopia: The case of Dabat and Metema
Deresse Daka, Belay Tessema, Awelani Mutshembele, Amir Alelign, Wubet Birhan, Baye Gelaw
IJID Regions.2026; 18: 100836. CrossRef - Structure-Based Virtual Screening in Tuberculosis Drug Discovery Pharmacological Constraints Failure Modes and Translational Lessons
Subham Kumar Vishwakarma, Cesar Augusto Roque-Borda, Oswaldo Julio Ramirez Delgado, Aditya Mishra, Zidane Qriouet, Achal Mishra, Andréia Bagliotti Meneguin, Fernando Rogério Pavan
Future Pharmacology.2026; 6(2): 18. CrossRef - Series 2: Invisible Threats: A Global Scoping Review of Risk Factors for Tuberculosis Infection
Sonia Menon, Anthony D. Harries, Riitta A. Dlodlo, Gisèle Badoum, Mohammed F. Dogo, Olivia B. Mbitikon, Pranay Sinha, Yan Lin, Jyoti Jaju, Aung Naing Soe, Anisha Singh, Bharati Kalottee, Kobto G. Koura
Tropical Medicine and Infectious Disease.2026; 11(4): 87. CrossRef - Impact of WHO-recommended tuberculosis control measures on occupational tuberculosis risk among healthcare workers in a high-burden tertiary hospital in Brazil: a 24-year retrospective analysis
P. Bortolozzi-Mendes, M. Rennó de Campos, H. de Oliveira Couto, M.C. Vieira de Almeida, J.G.C. Gonçalves de Oliveira, F. Bellissimo-Rodrigues, C.H. Miranda, A. Pazin-Filho
Journal of Hospital Infection.2025; 157: 75. CrossRef - Increased autophagy activity regulated by LC3B gene promoter DNA methylation is associated with progression to active pulmonary tuberculosis disease
Yung-Che Chen, Ying-Tang Fang, Chao-Chien Wu, Tung-Ying Chao, Yi-Hsi Wang, Chia-Cheng Tseng, Sum-Yee Leung, Chiu-Ping Lee, Ting-Ya Wang, Po-Yuan Hsu, Jen-Chieh Chang, Meng-Chih Lin, Chang-Chun Hsiao
Respiratory Research.2025;[Epub] CrossRef - An interoperable web-based platform to support health surveillance against latent tuberculosis infection in health care workers and students: The evolution of CROSSWORD study protocol
Angela Rizzi, Eleonora Nucera, Walter Mazzucco, Pierpaolo Palumbo, Domenico Staiti, Umberto Moscato, Francesco Maria De Simone, Michela Sali, Luca Boldrini, Nikola Dino Capocchiano, Stefano Patarnello, Gabriele Rumi, Raffaella Chini, Valentina Carusi, Mic
PLOS ONE.2025; 20(3): e0319568. CrossRef - Prevalence and risk factors of latent tuberculosis infection in healthcare workers in Eastern China
Lili Zhen, Shichao Shangguan, Jing Zhou, Shulei Wang, Liyong Lu, Yuelei Wang, Jingyu Liu
BMC Public Health.2025;[Epub] CrossRef - Establishing consensus of perceived occupational risk of tuberculosis (POR-TB) among healthcare workers: a Delphi study in Indonesia
Agus Fitriangga, Wilson Wilson, Risa Febriana Musawaris, Desni Yuniarni, Fitri Sukmawati, Risnawati Risnawati, Patricia Ami, Rudi Anshari, Insanul Kamilah, Irma Prasetyowati, Nurmainah Nurmainah, Alex Alex
Discover Public Health.2025;[Epub] CrossRef - Prevalence of Tuberculosis among Public Service Bus Station Users in Lusaka District, Zambia: A Pilot Project
Choongo Mulungu, Janet Muyunda, Nawina Lubosi, Choolwe Sianchapa, Astridah K. Y. Maseka
Journal of Tuberculosis Research.2025; 13(03): 100. CrossRef - Prevalence, Risk Factors, and Result Features in the Detection of Latent Tuberculosis Infection in Thai Healthcare Workers Using QuantiFERON-TB Gold Plus
Wiphat Klayut, Sopa Srisungngam , Sirilada Suphankong, Pantip Sirichote, Benjawan Phetsuksiri, Supranee Bunchoo, Chiranan Jakreng, Savitree Racksas, Ballang Uppapong, Janisara Rudeeaneksin
Cureus.2024;[Epub] CrossRef - Risks for latent tuberculosis infection among health care workers in Indonesia
Darariani DARARIANI, Nur A. TABRI, Muhammad ILYAS, Syakib BAKRI, Rini R. BACHTIAR, Himawan D. SANUSI, Hasyim KASIM, Arifin SEWENG
Gazzetta Medica Italiana Archivio per le Scienze Mediche.2023;[Epub] CrossRef - Risk factors affecting anal fistula incidence: a single hospital study
Fadhli AZHIMI, Samuel SAMPETODING, M. Ihwan KUSUMA, Firdaus HAMID, Sachraswaty R. LAIDDING, Prihantono PRIHANTONO, Muhammad FARUK
Chirurgia.2023;[Epub] CrossRef - Managing an ageing healthcare workforce: a systematic literature review
Mari Kurashvili, Karin Reinhold, Marina Järvis
Journal of Health Organization and Management.2023; 37(1): 116. CrossRef - Latent tuberculosis infection (LTBI) in health-care workers: a cross-sectional study at a northern Peruvian hospital
Edinson Dante Meregildo-Rodriguez, Verónica Yuptón-Chávez, Martha Genara Asmat-Rubio, Gustavo Adolfo Vásquez-Tirado
Frontiers in Medicine.2023;[Epub] CrossRef - Changes in the rate of bacillus tuberculosis infection in health workers in the first year of the COVID-19 epidemic in Kashan- Iran
Mojgan Sehat, Reza Razzaghi, Mark Ghamsary, Monireh Faghir Ganji, Mojtaba Sehat
Heliyon.2023; 9(10): e20560. CrossRef
 Cite
CiteTuberculosis infection status and risk factors among health workers: an updated systematic review

Fig. 1 The preferred reporting items for systematic reviews and meta-analyses flow diagram.
Fig. 1
Tuberculosis infection status and risk factors among health workers: an updated systematic review
| Number | Author | Publication year | Country | Study design | Participants | Tuberculosis assessment | Prevalence or incidence |
|---|---|---|---|---|---|---|---|
| 1 | Chen et al. [ | 2019 | China | Cross-sectional study | 487 | Questionnaire and IGRA for TB | IGRA positive: 33.9% |
| 2 | Nichimura et al. [ | 2018 | Japan | Prospective cohort study | 328 | IGRA for TB | HW: 0.149/100 person-years |
| Nursing student: 0.0825/100 person-years | |||||||
| 3 | Bukhary et al. [ | 2018 | Saudi Arabia | Cross-sectional study | 520 | IGRA for TB | QFT-GIT positive: 56/520 (10.8%) |
| 4 | Henderson et al. [ | 2017 | UK | Cross-sectional study | 587 | IGRA for TB | IGRA positive: 27% |
| 5 | Shrestha et al. [ | 2017 | Nepal | Cross-sectional study | 560 | Self-administered questionnaire and CXR | Direct contact with patients: 76.8% |
| Cough > 2 weeks: 10.4% | |||||||
| Chest radiography: 20.0% | |||||||
| 6 | Lacerda et al. [ | 2017 | Brazil | Cross-sectional study | 708 | Questionnaire and IGRA | LTBI prevalence: 27% (n = 196; 95% CI: 24%–31%) |
| 7 | Lacerda et al. [ | 2017 | Brazil | Cross-sectional study | 218 | TST | TST positive: 39.4% (95% CI: 32.9–45.9) and 54.1% (95% CI: 47.4–60.7) |
| 8 | Yoon et al. [ | 2017 | Korea | Cross-sectional study | 902 | TST, IGRA | TB patient care ≥ 1 year or more: 19.5% (176/902) |
| TST positive: 26.9% (243/902) | |||||||
| LTBI: 5.8% (52/902) | |||||||
| 9 | Janagond et al. [ | 2017 | India | Prospective cohort study | 206 | Questionnaires, TST | TST positive: 36.8% (76/206) |
| 10 | Napoli et al. [ | 2017 | Italy | Cross-sectional study | 2,290 | QFT, TST | TST positive: 141 (6.1%) |
| QFT positive: 16.4% | |||||||
| 11 | Gehanno et al. [ | 2017 | France | Retrospective study | 233,389 | Questionnaires | Nurse, health care assistants: 5.7/100,000 |
| Administrative staff: 1.27/100,000 | |||||||
| 12 | Pan et al. [ | 2015 | Taiwan | Matched cohort study | 44 | AFB staining | Smear positive: 26.8% (11/41) |
| Culture proven: 70.7% (29/41) | |||||||
| Pathologically diagnosed: 9.8% (4/41) | |||||||
| Clinically diagnosed: 24.4% (10/41) | |||||||
| 13 | He et al. [ | 2015 | China | Longitudinal study | 880 | TST, QFT | TST positive: 11.4% |
| QFT-GIT: 19.1% (OR: 142.62, 95% CI: 1.39–4.97) | |||||||
| BCG scar: OR: 0.53, 95% CI: 0.28–1.00 | |||||||
| 14 | Adams et al. [ | 2015 | South Africa | Prospective cohort study | 764 | TST, QFT, CXR | TST positive: 38% |
| QFT-GIT positive: 13%–22% | |||||||
| 15 | Hung et al. [ | 2015 | Taiwan | Prospective cross-sectional study | 193 | QFT-G, TST | TST positive: 88.8% |
| QFT-GIT positive: 14.5% | |||||||
| Multivariable logistic regression: only the QFT-G test was associated with age (35 years or greater) (adjusted OR: 2.53, p = 0.03) | |||||||
| 16 | Chen et al. [ | 2014 | China | Retrospective study | 996 | Sputum smear | TB: females > males (58.0% > 42.0%) |
| TB positive: males > females (88.5% > 83.4%, p = 0.031) | |||||||
| 17 | Garcell et al. [ | 2014 | Qatar | Cross-sectional study | 202 | TST, QFT-G | TST positive: 6.9% |
| QFT-G positive: 3.0% | |||||||
| TB positive is older than negative (44.5 vs. 38.9 years) | |||||||
| More experience as HWs (21.7 vs. 16.8 years) | |||||||
| Direct contact with Tb patients (83.3% vs. 25%) | |||||||
| 18 | Szep et al. [ | 2014 | USA | Cross-sectional study | 95 | TST | TST positive: 4.2% or 6.87 per 1,000 person weeks (95% CI: 1.87–17.60). |
| 19 | Muzzi et al. [ | 2014 | Italy | Cross-sectional study | 388 | TST | TST at T1 was positive: 11 (4.3%). ARTI was 1.6 (95% CI: 0.9–2.9) per 100 person-years |
| TST at T2 was positive: 9 (3.7%) | |||||||
| HWs PEARTI was 26 (95% CI 13.6–50) per 100 person-years | |||||||
| 20 | Wei et al. [ | 2013 | China | Observational study | 210 | IGRA, TST | QFT-GIT positive: 161 (76.7%) |
| QFT-GIT negative: 10 (19.01%) | |||||||
| Indeterminate results: 9 (4.3%) | |||||||
| (κ = 0.456, p < 0.001) | |||||||
| 21 | Gran et al. [ | 2013 | Norway | Cross-sectional study | 387 | QFT, TST | QFT-GIT positive: 3.4% |
| TST (≥ 6 mm): 214 (55.3%) | |||||||
| TST (≥ 15 mm): 53 (13.7%) | |||||||
| QFT, TST positive: 10 (4.7%) | |||||||
| 22 | Whitaker et al. [ | 2013 | Georgia | Prospective longitudinal study | 319 | TST, QFT-GIT | HWs from TB unit had higher prevalence of positive QFT-GIT and TST than those from non-TB unit: 107/194 (55%) vs. 30/125 (31%) QFT-GIT positive (p < 0.0001) and 128/189 (69%) vs. 64/119 (54%) TST positive (p = 0.01) |
| 23 | Kiertiburanakul et al. [ | 2012 | Thailand | Prospective study | 1,438 | TST | TST positive: 66.3% |
| TST conversion: 4.8 per 100 HCP-year | |||||||
| 9 (0.6%) HCP were diagnosed with active TB | |||||||
| 24 | Larcher et al. [ | 2012 | Italy | Cross-sectional study | 621 | TST, QFT | TST positive: 29.1% |
| QFT positive: 18.5% | |||||||
| 25 | Zwerling et al. [ | 2012 | Canada | Prospective longitudinal study | 388 | TST, QFT | TST positive: 5.7% (22/388, 95% CI: 3.6%–8.5%) |
| QFT positive: 6.2% (24/388, 95% CI: 4%–9.1%) | |||||||
| 26 | Borroto et al. [ | 2011 | Cuba | Cross-sectional study | 350 | TST | LTBI prevalence: 15.4%: it was highest in professionals (20.6%); 60.3% were non-reactors, and at the second test a year later 1.4% were converters |
| 27 | Moon et al. [ | 2011 | Korea | Cross-sectional study | 173 | TST, QFT | QFT-GIT positive: 21.4% |
| TST positive: 33.3% | |||||||
| κ = 0.234 | |||||||
| 28 | Sherman et al. [ | 2011 | Germany | Retrospective cohort study | 450 | TST | TST conversion: 93 |
| 29 | Kehinde et al. [ | 2011 | Nigeria | Descriptive study | 271 | Pre-tested questionnaire | AFB stain positive: 9 (3.3%) |
| Culture positive: 6 (2.2%) | |||||||
| The culture contamination: 1.8 per cent | |||||||
| 30 | Costa et al. [ | 2011 | Portugal | Cross-sectional study | 376 | QFT, TST | TST positive: 61 |
| 31 | Rafiza et al. [ | 2011 | Malaysia | Cross-sectional study | 954 | QFT, TST | The overall prevalence of latent tuberculosis infection among Health workers was 10.6% (CI: 8.6%–12.6%) |
| 32 | Park et al.[ | 2010 | Korea | Prospective study | 322 | QFT, TST | Both positive: 25 subjects (8%) |
| Follow-up after 1 year | |||||||
| QFT-GIT positive: between 3.3% and 5.7% | |||||||
| 33 | Cadmus et al. [ | 2010 | Nigeria | Retrospective study | 101 | AFB | AFB positive: 10 (13%) |
| 34 | Escombe et al. [ | 2010 | Peru | Cross-sectional study | 845 | QFT | QFT-GIT positive: 39 (56%) |
| 35 | Lambert et al. [ | 2012 | USA | Cross-sectional study | 200,744 | TST | TST positive: 6,049 (3%) |
| 36 | Schablon et al. [ | 2010 | Germany | Cross-sectional study | 2,028 | IGRA | QFT-GIT positive: 198 (9.9%) |
| TST positive: 480 (24.0%) | |||||||
| 37 | Jo et al. [ | 2013 | Korea | Cross-sectional study | 493 | TST, QFT | Doctors (n = 99): TST positive: 63 (41.4%)/QFT-GIT positive: 36 (23.7%) |
| Nurse (n = 168): TST positive: 119 (34.9%)/QFT-positive: 49 (14.4%) |
| Number | Author | Year | Country | Study design | Participants | Tuberculosis assessment | Estimate of risk |
|---|---|---|---|---|---|---|---|
| 1 | Wang et al. [ | 2018 | China | Cross-sectional study | 212 | Positive sputum acid-fast stains | TB: 760/100,000, RF: 51 years and above (aOR: 6.17, 95% CI: 1.35–28.28), being a nurse (aOR: 3.09, 95% CI: 1.15–8.32) |
| 2 | Kim et al. [ | 2017 | Korea | Prospective cohort study | 872 | TST, CXR | Age over 30 years: (p = 0.02), LTBI point prevalence: 6.6%, LTBI incidence: 2.4 per 100 HWs |
| 3 | Davidson et al. [ | 2017 | UK | Retrospective cohort study | 2,320 | TB surveillance, genotyping data | HWs: 23.4 (95% CI: 22.5–24.4), non-HWs: 16.2 (95% CI: 16.0–16.3) |
| 4 | Belo et al. [ | 2017 | Mozambique | Cross-sectional study | 316 | Symptom screening questionnaire | LTBI: 34.4%, working > 8 years: 39.3%, no BCG vaccine: 39.6%, immunocompromised: 78.1% |
| 5 | Du et al. [ | 2017 | China | Cross-sectional study | 186 | Questionnaires | Medical professionals (PR = 2.40), laboratory technicians (PR = 2.17), other hospital staff (PR = 1.04) |
| 6 | Bonini et al. [ | 2017 | Italy | Cross-sectional study | 580 | Questionnaires, TST | Previous BCG vaccination: OR: 344, CI: 43.72–2,718.41, p < 0.001, origin in high-risk countries: OR: 401.68, CI: 50.60–3,188.69, p < 0.001 |
| 7 | Weng et al. [ | 2016 | Swaziland | Cross-sectional study | 186 | Questionnaires | Nurses (OR: 39.87, 95% CI: 2.721–584.3), other HWs (OR: 99.34, 95% CI: 7.469–1,321) |
| 8 | Nonghanphithak et al. [ | 2016 | Thailand | Cross-sectional study | 112 | QFT, questionnaires | Age ≥ 30 years (OR: 18.88, 95% CI: 1.52–234.36), nurse (OR: 2.78, 95% CI: 1.19–6.49), job for ≥ 10 years (OR: 8.78, 95% CI: 1.26–61.29) |
| 9 | Tudor et al. [ | 2016 | South Africa | Case-control study | 307 | Questionnaires | HWs living with HIV (OR: 6.35, 95% CI: 3.54–11.37) spent time working in areas with patients (OR: 2.24; 95% CI: 1.40–3.59) |
| 10 | Ito et al. [ | 2016 | Japan | Retrospective study | 875 | IGRA, CXR | Multivariate analysis (OR: 8.2, 95% CI: 1.3–78.3, p = 0.03), longer duration of contact (> 7 days, 12/12 [100%], vs. ≤ 7 days, 18/43 [41.9%]; p = 0.0002), fewer symptoms (> 7 days, 5/12 [41.7%] vs. ≤ 7 days, 35/43 [81.4%]; p = 0.01). |
| 11 | Tsang et al. [ | 2015 | Hong Kong | Prospective cohort study | 279 | IGRA, QFT | QFT-GIT positive: (exposed: 19.5%, non-exposed: 20.8%, RR = 0.96, 95% CI: 0.74–1.25, p > 0.05) |
| 12 | Agaya et al. [ | 2015 | Kenya | Cross-sectional survey | 1,416 | Standardized questionnaire | LTBI prevalence: (p = 0.72), work year: p < 0.01 |
| 13 | McCarthy et al. [ | 2015 | South Africa | Cross-sectional study | 199 | IGRA, TST | Incident LTBI (IGRA): 25/97 (26%; incident rate 29 cases/100 person-years, 95% CI: 20–44), TST: 25/93 (27%; incident rate 29 cases/100 person-years, 95% CI: 19–42) |
| 14 | Rutanga et al. [ | 2015 | Rwanda | Cross-sectional study | 1,131 | TST | LTBI prevalence: (62.1%), TST positive odds TST: 2.71 times greater (95% CI: 2.01–3.67), work year odds: increasing 4% (aOR: 1.04, 95% CI: 1.02%–1.05%) per year |
| 15 | Chu et al. [ | 2014 | Taiwan | Population-based cohort study | 11,811 | Chart review | TB incidence: HWs vs matched subjects (61.08 vs. 37.81 per 100,000 person-years) |
| Risk of TB: HWs (aHR: 1.62, 95% CI: 1.08–2.43) | |||||||
| 16 | Tudor et al. [ | 2014 | South Africa | Retrospective cohort study | 1,313 | Chart review | HWs living with HIV had a greater incidence of TB (IRR: 3.2, 95% CI: 1.54–6.66) than HIV-negative HWs |
| 17 | Zhou et al. [ | 2014 | China | Cross-sectional study | 712 | TST | TB hospital: 58.0% (n = 127), non-TB hospital: 33.9% (n = 105) (OR: 2.40, 95% CI:1.59–3.62), (6–10 years vs. ≤ 5 years [OR: 1.89, 95% CI: 1.10–3.25] and > 10 vs. ≤ 5 [OR:1.80; 95% CI: 1.20–2.68]) |
| 18 | Claassens et al. [ | 2013 | South Africa | Cross-sectional study | 133 | Sputum smear | The infection control audit score: OR: 1.04, 95% CI: 1.01–1.08, p = 0.02, the number of staff: OR: 3.78, 95% CI: 1.77–8.08, the number of staff remained: OR: 3.33, 95% CI: 1.37–8.08 |
| 19 | Durando et al. [ | 2013 | Italy | Cross-sectional study | 881 | TST | Born in high TB incidence areas (≥ 20 cases per 100,000 population) |
| 20 | Kim et al. [ | 2013 | Korea | Cross-sectional study | 2,132 | TST | TST positive: 778 (36.5%), being older (OR: 1.10, 95% CI: 1.06–1.13, p < 0.001), male (OR: 1.78, 95% CI: 1.21–2.62, p = 0.003), re-joining the hospital workforce (OR: 1.58, 95% CI: 1.04–2.40, p = 0.032) |
| 21 | Casas et al. [ | 2013 | Spain | Cohort analysis | 614 | TST | High risk worker hazard ratio: 1.55 (95% CI: 1.05–2.27) gender, age and professional status |
| 22 | Mathew et al. [ | 2013 | South India | Case-control study | 101 | TST | BMI < 19 kg/m2 (OR: 2.96, 95% CI: 1.49–5.87), contact with patients (OR: 2.83, 95% CI: 1.47–5.45), being employed in medical wards (OR: 12.37, 95% CI: 1.38–110.17), microbiology laboratories (OR: 5.65, 95% CI: 1.74–18.36) |
| 23 | He et al. [ | 2012 | China | Cross-sectional study | 999 | TST, QFT-GIT | QFT-GIT-positive: 683 (68%) associated with greater age, longer HW career, TB disease in a co-worker and greater daily patient exposure using multivariable analysis |
Table 1 Summary of published studies meeting inclusion criteria for the TB among HWs
TB: tuberculosis; HW: health worker; IGRA: interferon-gamma releasing assay; QFT-GIT: QuantiFERON-TB Gold-In-Tube; CXR: chest X-ray; LTBI: latent TB infection; CI: confidence interval; TST: tuberculin skin test; QFT: QuantiFERON-TB; AFB: acid fast bacilli; BCG: Bacillus Calmette-Guerin; QFT-G: QuantiFERON-TB Gold; PEARTI: post-exposure rate of tuberculosis infection.
Table 2 Summary of published studies meeting inclusion criteria for risk factors of TB among HWs
TB: tuberculosis; HW: health worker; RF: risk factor; aOR: adjusted odds ratio; CI: confidence interval; TST: tuberculin skin test; CXR: chest X-ray; LTBI: latent tuberculosis infection; BCG: Bacillus Calmette-Guerin; PR: prevalence ratio; OR: odds ratio; QFT: QuantiFERON-TB; HIV: human immunodeficiency virus; IGRA: interferon-gamma releasing assay; QFT-GIT: QuantiFERON-TB Gold-In-Tube; RR: risk ratio; BMI: body mass index.

