
Articles
- Page Path
- HOME > Ann Occup Environ Med > Volume 33; 2021 > Article
- Research Article Environmental health survey for children residing near mining areas in South Gobi, Mongolia
-
Ulziikhishig Surenbaatar1
 , Byoung-gwon Kim1, Jeong-Wook Seo2, Hyoun-Ju Lim2, Jung-Yeon Kwon2, Min-Kyung Kang2, Enkhjargal Altangerel3, Tsogtbaatar Byambaa3, Suvd Batbaatar3, Oyunchimeg Myagmardorj3, Chul-Woo Lee4, Young-Seoub Hong1,2
 -
Annals of Occupational and Environmental Medicine 2021;33:e10.
DOI: https://doi.org/10.35371/aoem.2021.33.e10
Published online: March 31, 2021
1Department of Preventive Medicine, Dong-A University, Busan, Korea.
2Environmental Health Center, Dong-A University, Busan, Korea.
3National Center for Public Health, Ulaanbaatar, Mongolia.
4WHO Collaborating Center for Vulnerable Population and Environmental Health, National Institute of Environmental Research, Incheon, Korea.
- Correspondence: Young-Seoub Hong. Department of Preventive Medicine, Dong-A University, 32 Daesingongwon-ro, Seo-gu, Busan 49201, Korea. yshong@dau.ac.kr
• Received: November 19, 2020 • Accepted: March 8, 2021
Copyright © 2021 Korean Society of Occupational & Environmental Medicine
This is an Open Access article distributed under the terms of the Creative Commons Attribution Non-Commercial License (https://creativecommons.org/licenses/by-nc/4.0/) which permits unrestricted non-commercial use, distribution, and reproduction in any medium, provided the original work is properly cited.
Abstract
-
Background We evaluated the level and factors of heavy metal exposure to children residing in the Togttsetsii, Khanbogd, and Bayandalai soums of South Gobi province, Mongolia.
-
Methods A total of 118 children aged 9–12 years were surveyed, and the level of heavy metal exposure in their bodies was investigated. Exposure was investigated by measuring concentrations of heavy metals such as cadmium, lead, and mercury in the blood; mercury concentration in the hair; and total arsenic in the urine.
-
Results Blood cadmium concentration had geometric averages of 0.16 µg/L in the children from Bayandalai, 0.15 µg/L Tsogttsetsii, and 0.16 µg/L Khanbogd. Blood lead concentration showed a relatively higher geometric average of 7.42 µg/dL in the children from Bayandalai compared to 4.78 µg/dL and 5.15 µg/dL in those from Tsogttsetsii and Khanbogd, respectively. While blood mercury concentration was the highest in the children from Bayandalai, with a value of 0.38 µg/L, those from Tsogttsetsii and Khanbogd had similar concentrations of 0.29 µg/L and 0.29 µg/L, respectively. Hair mercury concentration was the highest in the children from Bayandalai, with a value of 78 µg/g, a particularly significant difference, with a concentration of 0.50 µg/g in those from Khanbogd. Urine arsenic concentration was the highest in the children from Khanbogd, with a value of 36.93 µg/L; it was 26.11 µg/L in those from Bayandalai and 23.89 µg/L in those from Tsogttsetsii.
-
Conclusions The high blood lead concentration of children in Bayandalai was judged to be due to other factors in addition to mine exposure; the reason why blood and hair mercury concentration was higher in children from Bayandalai may have been due to exposure to many small-scale gold mines in the area. In the case of Khanbogd, it was estimated that the high arsenic level in urine was caused by the effect of mines.
BACKGROUND
The mining industry in Mongolia plays an important role in the country's economic and social development. Mongolia's main mining products include copper, gold, iron, molybdenum, fluorite, and coal. The mining industry accounts for 89.2% of all exports and 70.6% of all industrial output, and has more than doubled in the past 10 years [1]. In the early 2000s, copper and gold mines were developed in the Oyu Tolgoi area of the Gobi desert in Mongolia. By 2020, mining production in this area is expected to account for more than 30% of Mongolia's gross domestic product [2].
The mining industry emits various environmental pollutants. Acid wastewaters containing heavy metals contaminate the surrounding soil, water, and crops, while dust emissions pollute the environment for local residents. The main pollutants of metal mines are lead, cadmium, copper, arsenic, mercury, and chromium; these metals are non-biodegradable substances that accumulate in the environment and inhibit the growth of animals and plants. When humans ingest water and crops contaminated by heavy metals over a long period, the metals accumulate in the body and cause various diseases. Therefore, all local residents living in mining areas may be at risk from the effects of consuming contaminated crops and water, and of inhaling suspended dust particles [3,4,5,6].
Environmental pollution caused by pollutants from mines is basically soil pollution. When the soil is contaminated, it primarily affects organisms in soil, nearby rivers and groundwater, rather than direct health damage caused by pollutants, and further changes in the ecosystem, ultimately leading to indirect health disorders in humans.
In Mongolia, there is no effective management system to assess the environmental health of mining sites. A sustained approach for extensive and comprehensive analysis on a national scale is necessary. The environmental health assessment of mines can help to establish a management system based on the protection of human health against environmental pollutants, and by providing local residents with the scientific information acquired from these investigations, their level of exposure to environmental pollutants can be monitored.
South Korea's National Institute of Environmental Research, a designated World Health Organization (WHO) collaborating center, conducts cooperative research to identify the environmental-related health problems and risk factors affecting vulnerable social groups. The activities under this led to the survey of environmental exposure and health impacts of heavy metals in mining areas in Mongolia.
The purpose of this study was to evaluate the concentration of heavy metals and identify related factors for children, the most vulnerable population to environmental pollution.
METHODS
The selection of the survey area was made in consultation with Mongolian government officials. After a preliminary survey and an on-site meeting, we selected three soums in Umnugobi province, and the study commenced in July 2017. The selected areas were Tsogttsetsii, Khanbogd, and Bayandalai (Fig. 1).

Tsogttsetsii Soum is located in the Altai mountain region, and covers an area of 7,246 km2 that is inhabited by a population of 7,030 permanent residents and 18,000 temporary residents. The biggest coal mining companies, Tavan Tolgoi, Energy Resource, and Erdenes Tavan Tolgoi operate in this area; the coal mine is located 15 km southwest of the center of the soum.
Khanbogd Soum is located in the Altai mountain region—an area covering 15,150 km2 that has a population of 6,400 permanent residents and 18,000 temporary residents. The biggest copper mining company, Ouy Tolgoi, operates a mine 40 km from the center of the soum.
Bayandali Soum is located in the Gobi desert region of Mongolia and covers an area of 10,750 km2, and is inhabited by a population of 2,098 permanent residents and an unknown number of temporary residents; most of the residents work at small-scale mines.
Local elementary school children in the fourth and fifth grades from the three study areas were selected as study candidates, and those recruited in advance were induced to visit the local medical center. Before administering the study questionnaire, a preliminary survey was carried out that explored structured epidemiological surveys, such as the "Health Impact Survey of Residents in Waste Metal Mines" in South Korea, that had been conducted in vulnerable regions. The questionnaire, which was administered by a well-educated and trained investigator through a personal interview, was, in principle, answered by the child's guardian. A total of 118 people—27 from Bayandalai, 47 from Tsogttsetsii, and 44 from Khanbogd—were surveyed, and the level of heavy metal exposure in the body was investigated. Questionnaire items included questions on information about mood, family, lifestyle, the living environment, eating habits, and drug use. The level of heavy metal exposure in the body was investigated by measuring the concentration of lead, cadmium, and mercury in the blood; mercury in the hair; and arsenic in the urine.
Whole blood samples were collected in vacutainer royal blue caps containing ethylene-diamine-tetra-acetic acid (EDTA). Blood samples were gently shaken 8–10 times, mixed in a roller mixer to prevent coagulation, divided into 1 mL each in micro tubes. The participants were instructed regarding the urine collection method to prevent contamination, spot urine specimens were collected, divided into 2 conical tubes. The blood and urine samples were transported to the laboratory below 4°C and stored at −70°C before analysis. The hair was then placed in filter papers, and kept refrigerated in a dark room of 4°C in polyethylene bags.
Cadmium and lead analysis in whole blood
We used an inductively coupled plasma-mass spectrometer (7,700×, Agilent Technologies, Santa Clara, CA, USA) for the analysis of cadmium and lead. The diluted solution was made using 2% 1-butanol, 0.05% EDTA, 0.05% Triton X-100, and 1% NH4OH (Sigma-Aldrich, St. Louis, MO, USA). We used a 10 mg/L multi-element calibration standard (Agilent Technologies) for the calibration standard solution. The calibration curves of cadmium and lead measured in the whole blood were used by making seven calibration standard solutions of 0.05, 0.1, 0.5, 1, 5, 10, and 20 µg/L using a blood spiking experiment. The whole blood sample was analyzed after diluting it to a 1:10 ratio. In order to validate the analysis methods, we used Whole Blood Metals Control Level 1 and Level 2 (Seronorm; SERO AS, Billingstad, Norway) as a reference material for the whole blood to guarantee accuracy in the measurement methods for each test. We used rhodium (10 mg/L; Agilent Technologies) for the internal standard for the whole blood.
Blood and hair mercury analysis
The mercury level was analyzed using the gold amalgam method and DMA80 (Milestone Co., Sorisole, Italy). The hair sample was cut as small as possible by using stainless scissors and 0.03 to 0.1g was used., and blood samples were stirred at room temperature for more than 30–60 minutes using a roller mixer. The calibration curves were plotted after diluting a 1,000 mg/L mercury standard undiluted solution (Sigma-Aldrich) with a diluent of 0.01% L-Cystein (in 0.2% nitric acid). To validate the analysis methods, whole blood metals control level 1 and level 2 (Seronorm; SERO AS) were used as the reference materials for the blood to guarantee the reliability of the measurement methods for each test; 269 R (Milestone Co) was used as a reference material for hair.
Urine arsenic analysis
Urine arsenic was analyzed by the hydride generation technique using an atomic absorption spectrometer (Perkin Elmer Model 900Z) that has an intact hydride generation system (FIAS 400). The calibration curve was plotted using five calibration standard solutions (1, 2, 5, 10, 20 ppb). A urine sample was used after diluting it 10 times, then mixed with L-Cystein (Sigma-Aldrich) in 0.03 M HCl (Dongwoo Fine-Chem Co., Ltd., Pyeongtaek, Korea) in the ratio of 1:1, then allowing it to react for an hour at room temperature, and diluting it with deionized water. We used 0.5% NaBH4 (Sigma-Aldrich) in 0.05% NaOH as a reducing agent and 0.03 M HCl as a carrier solution. In order to guarantee the accuracy of the measurement methods for each test; ClinChek level 1 and level 2 (RECIPE Chemicals, Munich, Germany) were used as the reference materials.
For statistical analysis, we used SAS (version 9.4; SAS Institute, Cary, NC, USA). All the measured variables followed a log-normal distribution, as assessed by the Kolmogorov-Smirnov test, and further statistical analyses were conducted on decimal log-transformed values. We provided geometric means (GM) and 95% confidence intervals (95% CIs) for heavy metal concentrations in children for each group. To compare the heavy metal concentrations between the groups, independent samples t-test and analysis of variance were performed. We also performed within- and between-group comparisons of the concentrations based on the group characteristics. All the tests used a significance level of 5%.
The research was approved by the Medical Ethical Committee for the Ministry of Health, Mongolia (grant #20170619-01).
RESULTS
The general characteristics of the child participants are summarized in Table 1. Participants in the groups from Bayandalai and Khanbogd had a higher proportion of females, 66.7% and 65.9%, respectively, while the Tsogttsetsii group had a higher proportion of males, namely 57.4%. The average age in the Bayandalai group was 9.93, and 9.83 in the Tsogttsetsii group, and 10.73 in the group from Khanbogd, which was the highest among the three areas.
Table 1
General characteristics of child participants
In terms of parents' educational level, Bayandalai had a relatively high proportion of parents educated until below middle school. Regarding current employment, in Bayandalai, 55.6% of fathers and 10.7% of mothers were engaged in the livestock industry, while in Khanbogd and Tsogttsetsi, there was a higher percentage of mine workers than shepherds.
Whereas the proportion of monthly household income under 0.4 million MNT in the Bayandalai group was 37%—which was also the highest among the three areas; it was 29.8% in the Tsogttsetsii group, and 29.5% in the group from Khanbogd. In the latter two areas, the highest proportion of monthly household income range was between 0.7 and 1 million MNT. This shows that the income level in Bayandalai area, was low. The majority of child participants in all three areas lived in a Mongolian traditional house called a Ger and used a heater as a heating facility. Based on the heating facility, coal was used as the main fuel in Tsogttsetsii (94.2%) and Khanbogd (95.2%); meanwhile, the Bayandalai area, used coal (52.2%) and dry manure (47.8%). In all areas, more than half of households used underground water. Except for one child, none of the children in Bayandalai lived within 5 km of a mine, while in Tsogttsetsii and Khanbogd, 48.9% and 9.1%, respectively, did. The proportion of smokers in the family was a majority in all areas, with Bayandalai, Tsogttsetsii, and Khanbogd having proportions of 50.0%, 59.6%, and 65.9%, respectively. Regarding second-hand smoke, the proportion of children affected in Bayandalai was 35.3%, Tsogttsetsii 28.3%, and Khanbogd 18.2%.
The distributions of heavy metal concentrations in participants and the comparison results of heavy metal concentrations between the 3 areas are shown in Table 2. The blood cadmium concentration had geometric averages (95% CI) of 0.16 (0.13–0.20) µg/L in Bayandalai, 0.15 (0.14–0.16) µg/L in Tsogttsetsii, and 0.16 (0.15–0.17) µg/L in Khanbogd. The blood lead concentration showed a relatively higher geometric average of 7.42 (6.45–8.54) µg/dL in Bayandalai compared to 4.78 (4.36–5.23) µg/dL in Tsogttsetsii, and 5.15 (4.65–5.71) µg/dL in Khanbogd. While the blood mercury concentration was the highest in Bayandalai with a value of 0.38 (0.34–0.42) µg/L, Tsogttsetsii and Khanbogd had similar concentrations of 0.29 (0.27–0.32) µg/L and 0.29 (0.26–0.32) µg/L, respectively. Likewise, hair mercury concentration was the highest in Bayandalai with a value of 0.78 (0.66–0.93) µg/g, a particularly significant difference, with a concentration of 0.50 (0.44–0.57) µg/g in Khanbogd. Meanwhile, the urine arsenic concentration was the highest in Khanbogd with a value of 36.93 (30.75–44.36) µg/L; it was 26.11 (17.99–37.89) µg/L in Bayandalai and 23.89 (18.53–30.79) µg/L in Tsogttsetsii. When the heavy metal concentrations in children were compared between the three areas, statistically significant differences were found between the groups concerning lead concentration in the blood, and mercury concentration in the blood and hair.
Table 2
Distribution of heavy metals and comparison of heavy metal concentrations between the 3 areas
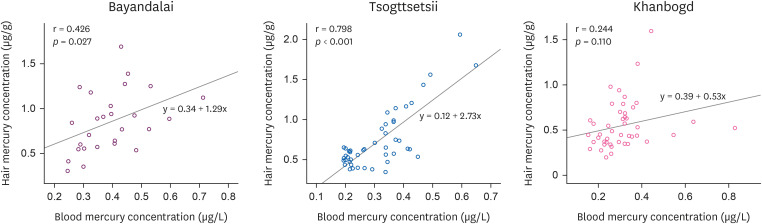
The correlation analysis between hair and blood mercury concentrations is shown in Fig. 1. Tsogttsetsii showed the highest correlation (p < 0.001) with a correlation coefficient of 0.798. Bayandalai showed a correlation coefficient of 0.426 (p < 0.027), and Khanbogd showed a statistically insignificant result with a correlation coefficient of 0.244 (Fig. 2).
In this study, the children's blood lead concentration was significantly high among heavy metals, so a factor analysis was conducted on the lead concentration. The blood lead concentration according to the general characteristics of the children is shown in Table 3. While there were statistically significant gender differences between the areas (male: p < 0.002, female: p < 0.001), and no significant difference was found within each area. The blood lead concentration according to age showed a significant difference between the age group of 9–10 years old (p < 0.001); however, the within-area analysis revealed that only in Khanbogd the lead concentration increased as age decreased (p < 0.001). According to the education level of parents, both in Bayandalai and Khanbogs, the lower the father's education level, the higher the children's blood lead concentration. In each area, blood lead concentration was the highest in children whose parents were shepherds, and when compared by area, those from Bayandalai whose parents were shepherds had the highest blood lead concentration. There were statistically significant differences between areas in the group that had a monthly household income of 0.4 million and below (p < 0.001), and in the group that had a monthly household income of between 0.4 and 0.7 million (p < 0.049); however, there was no statistically significant difference in lead concentration based on monthly household income within each area. There was a significant difference by residential type between the areas; however, the blood lead concentration was significantly higher in children living in Gers than those living in other residential types in Khanbogd (p < 0.001). Based on the heating facility, the group that used heaters showed differences between the areas (p < 0.001); however, there was no statistical significance between differences within each area. The blood lead concentration according to the main heating fuel showed a statistically significant difference between the areas in the group that used coal as fuel (p < 0.002). According to the source of drink water, in all areas, the children whose household used underground water had high blood lead concentration (p < 0.001). In the Bayandalai and Tsogttsetsii areas, children who lived within 5 km from the mine had higher level of blood lead concentrations than those who were lived outside 5 km from the mine, but this was not statistically significant. In the Khanbogd area, it was observed that the blood lead concentration of children whose living distance was outside 5 km from the mine was higher. With regards to the presence of smoking in the family, in Bayandalai and Khanbogd, the blood lead concentration in children with family smokers was high, while in Bayandalai and Tsogttsetsi, children living in households with the presence of smoking next to children had higher blood lead levels.
Table 3
GM (95% CI) of blood lead concentration according to general characteristics
GM: geometric means; CI: confidence interval; ANOVA: analysis of variance.
aThe p-value calculated by 1-way ANOVA for GM value differences between area; bThe p-value indicates the difference of blood lead concentration between subgroups using 1-way ANOVA or independent sample t-test; cDivided by a quarter; dTraditional Mongolian tent.
DISCUSSION
We evaluated the concentration of heavy metals in children living in Mongolia mining area. The concentration of lead and mercury in children's blood and mercury in hair in Bayandalai was relatively higher than children in other areas, and children in Khanbogd had the highest concentration of arsenic in their urine.
The blood lead concentrations in children in the three areas were as follows: 7.42 µg/dL in Bayandalai, 5.15 µg/dL in Khanbogd, and 4.78 µg/dL in Tsogttsetsii, respectively. These levels were much higher than those found in the following developed countries: 1) 0.571 µg/dL among children of the ages 6–11 and 0.467 µg/dL among children of the ages 12–19 reported by the US National Health and Nutrition Examination Survey between 2015 and 2016 in USA [7]; 2) 0.8 µg/dL among middle- and high-school students reported by the Korean National Environmental Health Survey (KoNEHS) between 2015 and 2017 [8]; 3) 0.54 µg/dL among children of the ages 6–11 reported by the Canada Health Measures Survey between 2016 and 2017 [9]; and 4) 1.7 µg/dL reported by the German Environmental Survey for Children [10]. The WHO Centers for Disease Control and Prevention (CDC) recommend that the reference value of high concentration exposure for children (as of 2012–2015) be lowered to 5 µg/dL [11]. The blood lead concentrations among children in Bayandalai and Khanbogd areas were found to be higher than the CDC reference value. In addition, our study of the 3 areas produced lower values compared to a study of 120 children in Ulaanbaatar (2005) that reported a blood lead concentration of 16.54 ± 9.5 µg/dL [12]. However, the blood lead concentration was also higher than in another study of 153 children of ages 7–14 in Ulaanbataar (2014) that reported a concentration of 5.3 µg/dL (95% CI, 4.9–5.7 µg/dL) [13], and a study of 338 children of ages 4–7 in 2 cities (2017), Darkhan and Erdenet, that reported a concentration of 3.85 µg/dL [14]. Based on these 3 studies, children living in rural areas in households that use heaters showed a much higher blood lead concentration than children living in urban apartments with central heating. These results were similar to studies in Chinese children that showed high blood lead concentrations in children living in households using coal and biomass fuels compared to households using gas or electricity [15].
Compared to the 2005 study of children in Ulaanbaatar (16.5 ± 9.5 µg/dL), blood lead concentrations were significantly lower than in the 2014 study (6.0 ± 2.9 µg/dL). We think the biggest contributing factor to the decline was the Mongolian government's gradual implementation of a ban on the importation and use of gasoline containing lead. In accordance with the United Nations Environment Program's Partnership for Clean Fuels and Vehicles, Mongolia effectively banned lead fuel from January 2008 [16]. Despite the decrease in the use of lead-containing gasoline, high blood levels are presumed to be associated with mines and other factors. Previous studies, not only in Mongolia but also in other countries, also showed similar results that show high concentrations of heavy metals in residents living near a mining area. Luo et al. [17] surveyed a total 1,379 children in three areas near lead and zinc mining sites in China (2017), and found that the median blood lead concentration was 6.6 µg/dL, and that 341 children (24.73%) showed blood lead concentrations higher than 10 µg/dL, and that blood lead concentrations decreased as the age of children increased. A study conducted in Zambia (2015) showed an inverse correlation between the distance from lead and zinc mining sites and the blood lead concentration in children [18], and a study conducted in Vietnam (2018) showed an inverse correlation between the lead concentration in the soil, groundwater, and house dust, and the distance from sources of contamination [19]. On the other hand, in this study, no difference in lead concentration in children's blood was observed according to the distance of residence from the mine.
Whereas the aforementioned results suggest that blood lead concentrations in children decrease with increasing distance from the source of contamination, our study showed that it was higher among the children in the Bayandalai area situated far away from the nearest large scale mining site, Bayandalai, than among the children on large scale mining sites. In Bayandalai, only the residents near the center of the soum were supplied with electricity. The nomads living away from the soum center did not have access to an electricity supply and had to use domestic storage batteries. This study didn't survey the use of storage batteries in the home. However, since shepherds accounted for more than half of the current employment status of children's parents in Bayandalai, it was assumed that children in Bayandalai use storage batteries in their homes. Swaddiwudhipong et al. [20] showed that lead in the dust of households that use solar-powered lead acid batteries exceeded the EPA standard in the US (2001) and reported that levels of blood lead concentration were significantly higher among the children in households that use lead acid battery (9.50 ± 1.81µg/dL) than those who do not (7.94 ± 1.56µg/dL). Therefore, it can be assumed that it is related to the use of batteries in the homes of residents in Bayandalai as a factor in the results the high blood lead concentration of children in Bayandalai.
In addition to exposure to mines, we estimate that four other factors can influence the blood lead concentration in children. First, the storage process of drinking water seems to have an effect. In particular, containers for cooking oil are reused to store drinking water in many regions in Mongolia where water supply facilities are not properly equipped. Unursaikhan et al. [21] investigated the quality of drinking water in these oil containers commonly used by Mongolians and found that the lead concentration in the water (5–8 mg/L) was 500–800 times higher than WHO standards. Unurtsetseg [22] have also reported that all heavy metals in the water quality in this study area were below the limit. Hence, we hypothesize that the high blood lead concentration found in children must be due to drinking contaminated water from the oil containers that Mongolians use in daily life. Second, according to a survey of indoor paint sold in Mongolia, showed that 70% of the paint had lead above 90 ppm and 20% above 10,000 ppm [23]. It is possible that using lead-containing paint could have contributed to the concentration of lead in the blood. Third, there are many houses using coal and biomass fuels, which are presumed to be related to the use of fuel and blood lead concentration. Fourth, although it may be the effect of air pollution, there was no monitoring data on air pollution in the target areas.
Regarding total arsenic in urine, the GM was the highest among the children in Khanbogd (36.93 µg/L), which was lower than the reference value of the US Agency for Toxic Substances and Disease Registry [24]. The total arsenic in urine among the children of ages 6–11 was 4.89 µg/L according to the US National Health and Nutrition Examination Survey in the years 2015–2016 [7], It was 4.4 µg/L according to the Canada Health Measures Survey in the years 2016–2017 [9]. The German Environmental Survey for Children in 2003–2006 reported that total arsenic in urine in children of ages 9–11 was 4.08 µg/L [10]. The participants in this study showed a relatively higher concentration compared to all of the 3 results. Calatayud et al. [25] showed that the arithmetic mean of urine arsenic among 101 children of ages 3–5 in northern Argentina was much higher in areas with a high exposure level (2,387 ± 165 µg As/g creatinine) than in the areas with a low exposure level (126 ± 19 µg As/g creatinine). Our result showed a relatively lower value than this result. Nyanza et al. [26] conducted a cohort study on residents living at small-scale gold mining sites and provided a median urine arsenic level of 9.4 µg/L in an exposure group and 6.28 µg/L in a non-exposure group. However, the three areas in this study still had a higher concentration compared to these results. The path of arsenic intake depends on the chemical termination of arsenic. The main sources of exposure to inorganic arsenic are water contaminated with arsenic and crops grown in contaminated soil. In the case of organic arsenic, foods such as fish and shellfish and algae with relatively high arsenic content, which are exposed mainly through the digestive system. According to the 2017 final report made by a gold mine company located in Khanbogd area (Oyutolgoi), the heavy metal pollution level in the soil near the mine had exceeded the tolerance level of arsenic in soil [27]. Hence, the high urine arsenic found among the child participants in this study could be due to their exposure to the Oyutolgoi gold mine. Further, Nakazawa et al. [28] investigated the evaluation of heavy metal exposure to groundwater around Tavantolgoi and Oyutolgoi mines, and the risk hazard index from the groundwater near Oyutolgoi mine was measured greater than 1. Therefore, Mongolia, as an inland country, had no intake of algae that affected arsenic, the high level of arsenic was judged to be affected by the surrounding mines. In the future, it will be necessary to conduct a precise investigation that includes the evaluation of environmental exposure of arsenic in the mining areas and the analysis of chemical species of arsenic on biological samples.
The blood cadmium in children had GMs of 0.15 µg/L in Tsogttsetsii, 0.16 µg/L in Bayandalai, and 0.16 µg/L in Khanbogd, all of which were below the WHO standards. Meanwhile, they were similar to the 0.14 µg/L found in children of ages 12–19 by the US National Health and Nutrition Examination Survey in the years 2015–2016 [7] and the 0.11 µg/L by the Canada Health Measures Survey in the years 2016–2017 [9]. They were also lower than the 0.93 µg/L reported by the National Health and Nutrition Examination Survey in South Korea [8]. It was estimated that there was no effect of cadmium exposure in children in the survey area.
Regarding mercury in blood and hair, the GMs were the highest in Bayandalai at 0.38 µg/L and 0.78 µg/g, respectively. However, these values were under the reference values of the US EPA and considered to present no risk. Meanwhile, the blood mercury concentration among the participants of this study was lower than among middle- and high-school students reported by the KoNEHS in the years 2015–2017 (1.37 µg/L). Our result was similar to the 0.395 µg/L among the children of ages between 12–19 in the US National Health and Nutrition Examination Survey in the years 2015–2016 [7], 0.33 µg/L among the children of ages between 12–19 in the Canada Health Measure Survey [9], and 0.24 µg/L among the children of ages 3–14 in the German Environmental Survey for Children. Ilmiawati et al. [29] showed that the geometric averages of mercury in blood and hair among 229 Japanese children of ages 9–10 were 4.55 µg/L and 1.31 µg/g, respectively; these values were much higher than those of this study. Another study by Basu et al. [30] showed that the arithmetic means of mercury in the blood and hair in Mexican children were 1.8 µg/L and 0.6 µg/g, respectively, both are higher than what we found in this study. According to a 2008 study conducted on 200 female residents of ages 15–35 in small-scale mercury mining areas, the control group had blood mercury of 0.30 µg/L and hair mercury of 0.13 µg/g, whereas the exposure group had 0.55 µg/L and 0.34 µg/g, respectively [31]. However, a 2012 study conducted on 79 participants in the same areas showed higher blood mercury in both groups than those found in the 2008 study: 0.47 µg/L in the control group and 0.74 µg/L in the exposure group [32,33]. The reason why mercury concentration in blood and hair was higher in the Bayandalai area, than in Tsogttsetsii and Khanbogd, may be due to exposure to many small-scale artisanal gold mines in the area [34]. However, it is difficult to determine the exact state of affairs given the illegal operations of the small-scale mines in the area, which requires attention in future studies. In addition, the correlation coefficient between mercury in blood and hair is was 0.426 (p < 0.027) for Bayandalai and 0.244 for Tsogttetsii (p < 0.110), which was lower than the 0.72 found in a study conducted on 229 Japanese children of ages 9–10 [29]. Therefore, the mercury in both blood and hair in this study as well as their low correlation to be low is think that it is due to the low concentration of organic mercury among Mongolians, which may be caused by insufficient seafood consumption given Mongolia's landlocked characteristic. Further studies are necessary to verify this theory through separate analysis of methylmercury and inorganic mercury in the blood.
The limitations of this study include the following: first, although we attempted to collect and analyze environmental samples such as soil, water and air samples, we could not analyze them due to the limitations of transporting environmental samples between countries. Second, as a one-time cross-sectional study, there was a limit to identifying the factor analysis of heavy metal exposure. Third, the number of subject is small. However, our study analyzed the level and factors of heavy metal exposure in the mining areas in Mongolia which is considered significant. For the insufficient parts, further studies are required in this study.
CONCLUSIONS
In this study, the concentration of heavy metals in the body of children living in the Mongolian mining area was evaluated. As the result, the concentration of lead and mercury in children's blood and mercury in hair in Bayandalai was relatively higher than children in other areas, and children in Khanbogd had the highest concentration of arsenic in their urine.
The high blood lead concentration level in children in the Bayandalai area may be due to the use of storage batteries, but the high lead concentration level of children in all areas are estimated to be due to not only exposed to mines, but also to the storage of drinking water in recycle plastic buckets, use of indoor paint, coal and biomass fuel of Mongolian. Furthermore, the high concentration of mercury in blood and hair of children in Bayandalai area appear to have a significant impact on the exposure of small mercury mines in the area, but further studies will be needed to identify heavy metal contamination factors in children in addition to mine exposure. In the Khanbogd area, it is estimated that the high concentration of arsenic in urine in this region is due to the effect of the mine, however, it is necessary to conduct studies on environmental exposure assessment in mining areas and detailed investigations into urine arsenic including classifying the chemical species.
Abbreviations
ANOVA
analysis of variance
CDC
Centers for Disease Control and Prevention
CI
confidence interval
EDTA
ethylene-diamine-tetra-acetic acid
GM
geometric means
KoNEHS
Korean National Environmental Health Survey
SD
standard deviation
WHO
World Health Organization
-
Funding: This study was supported by grants from the Environmental Health Center funded by the Ministry of Environment, and the WHO Collaborating Center for Vulnerable Population and Environmental Health, National Institute of Environmental Research, Republic of Korea. This study was supported by research funds from Dong-A University.
-
Competing interests: The authors declare that they have no competing interests.
-
Author Contributions:
Conceptualization: Hong YS.
Data curation: Altangerel E, Batbaatar S, Myagmardorj O, Byambaa T.
Formal analysis: Seo JW.
Investigation: Lim HJ, Kwon JY, Kang MK.
Methodology: Hong YS.
Project administration: Hong YS, Lee CW.
Writing - original draft: Surenbaatar U.
Writing - review & editing: Surenbaatar U, Hong YS, Kim BG.
NOTES
- 1. National Statistics Office of Mongolia. Social and economic situation of Mongolia. Updated 2019]. Accessed February 12, 2020]. https://www.en.nso.mn/.
- 2. Oyu Tolgoi LLC. Year in review-2018 to the shareholders of Oyu Tolgoi LLC. Updated 2018]. Accessed January 8, 2020]. https://www.ot.mn/.
- 3. Doležalová Weissmannová H, Mihočová S, Chovanec P, Pavlovský J. Potential ecological risk and human health risk assessment of heavy metal pollution in industrial affected soils by coal mining and metallurgy in Ostrava, Czech Republic. Int J Environ Res Public Health 2019;16(22):E4495. 31739633.
- 4. Fan Y, Zhu T, Li M, He J, Huang R. Heavy metal contamination in soil and brown rice and human health risk assessment near three mining areas in Central China. J Healthc Eng 2017;2017:4124302. 29065598.ArticlePubMedPMCPDF
- 5. Mahato MK, Singh G, Singh PK, Singh AK, Tiwari AK. Assessment of mine water quality using heavy metal pollution index in a coal mining area of Damodar River Basin, India. Bull Environ Contam Toxicol 2017;99(1):54–61. 28500354.ArticlePubMedPDF
- 6. Singh UK, Ramanathan AL, Subramanian V. Groundwater chemistry and human health risk assessment in the mining region of East Singhbhum, Jharkhand, India. Chemosphere 2018;204:501–513. 29679871.ArticlePubMed
- 7. Centers for Disease Control and Prevention. Fourth national report on human exposure to environmental chemicals updated tables, January 2019. Updated 2019]. Accessed February 20, 2020]. https://www.cdc.gov/exposurereport/pdf/FourthReport_UpdatedTables_Volume1_Jan2019-508.pdf.
- 8. Yoo JY, Baek YW, Jeon HL, Kwon YM, Lee NY, Han YJ, et al. Korean National Environmental Health Survey (KoNEHS): Annual Report on Third Stage, 2nd Year (2016). Incheon, Korea: National Institute of Environmental Research; 2016.
- 9. Health Canada. Report on Human Biomonitoring of Environmental Chemicals in Canada: Results of the Canadian Health Measures Survey Cycle 5 (2015–2017). Ottawa, ON, USA: Health Canada; 2017.
- 10. Becker K, Müssig-Zufika M, Conrad A, Lüdecke A, Schulz C, Seiwert M, et al. German Environmental Survey for Children 2003/06 - GerES IV - Human Biomonitoring: Levels of Selected Substances in Blood and Urine of Children in Germany. Dessau-Roßlau, Germany: Umweltbundesamt; 2008.
- 11. Centers for Disease Control and Prevention. CDC response to advisory committee on childhood lead poisoning prevention recommendations in “low level lead exposure harms children: a renewed call of primary prevention. Updated 2012]. Accessed October 18, 2019]. https://www.cdc.gov/nceh/lead/ACCLPP/CDC_Response_Lead_.
- 12. Baigal O, Enkhtsetseg BB, Dorogova VB, Badamgarav D, Bodienkova GM, et al. The blood lead level in children of Ulaanbaatar city and neurological features. Mong Med Sci 2006;1(135):28–33.
- 13. Olkhanud PB, Praamsma ML, Ganbaatar N, Tsogtbaatar M, Halmambetova E, Malchinkhuu E, et al. Assessment of blood lead levels and associated risk factors among children in Ulaanbaatar, Mongolia. Cent Asian J Med Sci 2016;2(2):195–205.ArticlePDF
- 14. Erdenebayar E, Santos KD, Edwards A, Dugersuren NO, Ochir C, Nriagu J. Environmental injustice and childhood lead exposure in peri-urban (ger) areas of Darkhan and Erdenet, Mongolia. BMC Public Health 2019;19(1):163. 30732589.ArticlePubMedPMCPDF
- 15. Li MM, Gao ZY, Dong CY, Wu MQ, Yan J, Cao J, et al. Contemporary blood lead levels of children aged 0-84 months in China: a national cross-sectional study. Environ Int 2020;134:105288. 31765862.ArticlePubMed
- 16. United Nations Environment Program. Global elimination of leaded petrol. Updated 2019]. Accessed October 20, 2019]. https://wedocs.unep.org/bitstream/handle/20.500.11822/17540/LEAD_Flyer.pdf?sequence=1&%3BisAllowed.
- 17. Luo YC, Zhao HY, Zhu WM, Ruan B, Qiu W, Li L. Analysis of blood lead level of children living around lead-zinc mines. Zhonghua Lao Dong Wei Sheng Zhi Ye Bing Za Zhi 2017;35(8):571–574. 29081122.PubMed
- 18. Yabe J, Nakayama SMM, Ikenaka Y, Yohannes YB, Bortey-Sam N, Oroszlany B, et al. Lead poisoning in children from townships in the vicinity of a lead-zinc mine in Kabwe, Zambia. Chemosphere 2015;119:941–947. 25303652.ArticlePubMed
- 19. Hai DN, Tung LV, Van DK, Binh TT, Phuong HL, Trung ND, et al. Lead environmental pollution and childhood lead poisoning at Ban Thi Commune, Bac Kan Province, Vietnam. BioMed Res Int 2018;2018:5156812. 30581854.ArticlePubMedPMCPDF
- 20. Swaddiwudhipong W, Kavinum S, Papwijitsil R, Tontiwattanasap W, Khunyotying W, Umpan J, et al. Personal and environmental risk factors significantly associated with elevated blood lead levels in rural Thai children. Southeast Asian J Trop Med Public Health 2014;45(6):1492–1502. 26466436.PubMed
- 21. Unursaikhan S, Khishigbuyan B, Gantsetseg P, Sodnomtseren B, Enkhtsetseg S. Migration of toxic chemicals from storage and transportation water containers into drinking water. Mong Med Sci 2010;4(154.
- 22. Unurtsetseg CE. Hygienic evaluation and heavy metal content in drinking water in the Gobi Provinces, Mongolia. J Diagn 2012;52(1):37–39.
- 23. IPEN. Lead in solvent-based paints for home use in Mongolia. National report. Updated 2017]. Accessed October 23, 2019]. https://ipen.org/documents/mongolia-lead-paint.
- 24. Agency for Toxic Substances and Disease Registry. Toxicological Profile for Arsenic. Atlanta, GA, USA: U.S Department of Health and Human Services, Public Health Services; 2007.
- 25. Calatayud M, Farias SS, de Paredes GS, Olivera M, Carreras NÁ, Giménez MC, et al. Arsenic exposure of child populations in Northern Argentina. Sci Total Environ 2019;669:1–6. 30877956.ArticlePubMed
- 26. Nyanza EC, Bernier FP, Manyama M, Hatfield J, Martin JW, Dewey D. Maternal exposure to arsenic and mercury in small-scale gold mining areas of Northern Tanzania. Environ Res 2019;173:432–442. 30974369.ArticlePubMed
- 27. Oyu Tolgoi LLC. Amendment to Oyu Tolgoi copper-gold deposit mining and processing project detailed environmental impact assessment report. Updated 2019]. Accessed October 20, 2019]. https://www.ot.mn/reports/.
- 28. Nakazawa K, Nagafuchi O, Okano K, Osaka K, Hamabata E, Tsogtbaatar J, et al. Non-carcinogenic risk assessment of groundwater in South Gobi, Mongolia. J Water Health 2016;14(6):1009–1018. 27959879.ArticlePubMedPDF
- 29. Ilmiawati C, Yoshida T, Itoh T, Nakagi Y, Saijo Y, Sugioka Y, et al. Biomonitoring of mercury, cadmium, and lead exposure in Japanese children: a cross-sectional study. Environ Health Prev Med 2015;20(1):18–27. 25293698.ArticlePubMedPMCPDF
- 30. Basu N, Tutino R, Zhang Z, Cantonwine DE, Goodrich JM, Somers EC, et al. Mercury levels in pregnant women, children, and seafood from Mexico City. Environ Res 2014;135:63–69. 25262076.ArticlePubMedPMC
- 31. Steckling N, Boese-O'Reilly S, Gradel C, Gutschmidt K, Shinee E, Altangerel E, et al. Mercury exposure in female artisanal small-scale gold miners (ASGM) in Mongolia: an analysis of human biomonitoring (HBM) data from 2008. Sci Total Environ 2011;409(5):994–1000. 21183207.ArticlePubMed
- 32. Jadambaa A, Spickett J, Badrakh B, Norman RE. The impact of the environment on health in Mongolia: a systematic review. Asia Pac J Public Health 2015;27(1):45–75. 25113526.ArticlePubMedPDF
- 33. Rendoo D, Dayanjav B, Ganbold U, Bose-O'Reilly S, Onom A, Surenjav U, et al. Mercury levels of environmentally and occupationally exposed residents in Bornuur and Jargalant Districts of Mongolia. Environ Ecol Res 2016;4(4):217–222.Article
- 34. Ulaanbaatar City. Mongolian national program to reduce pollution from artisanal gold mining. Environmental strategic assessment report. Updated 2018]. Accessed February 25, 2020]. http://www.mne.mn/wp-content/uploads/2019/02/Strategic-Impact-Assessment-Report-SEAFinal.pdf.
REFERENCES
REFERENCES
Figure & Data
REFERENCES
Citations
Citations to this article as recorded by 
- Mercury use in the artisanal and small-scale gold mining from 2001 to 2021: a review
Cut Dian Nuryanty, Etty Riani, Zaenal Abidin, Surjono Hadi Sutjahjo, Agung Riyadi
Toxicological & Environmental Chemistry.2024; 106(1-10): 182. CrossRef - The impacts of mining on soil pollution with metal(loid)s in resource-rich Mongolia
Václav Pecina, David Juřička, Josef Hedbávný, Martin Klimánek, Jindřich Kynický, Martin Brtnický, Renata Komendová
Scientific Reports.2023;[Epub] CrossRef - The Association Between Blood Lead Levels and Coronary Artery Calcium Score Determined by Using Coronary Computed Tomography Angiography
Eunyoung Park, Suwhan Kim, Seunghyeon Cho, Hyeonjun Kim, Inho Jung, Jai-Dong Moon, Won-Ju Park
Journal of Korean Medical Science.2023;[Epub] CrossRef - Blood Lead Monitoring in a Former Mining Area in Euskirchen, Germany—Volunteers across the Entire Population
Jens Bertram, Christian Ramolla, André Esser, Thomas Schettgen, Nina Fohn, Thomas Kraus
International Journal of Environmental Research and Public Health.2022; 19(10): 6083. CrossRef
 Cite
CiteEnvironmental health survey for children residing near mining areas in South Gobi, Mongolia
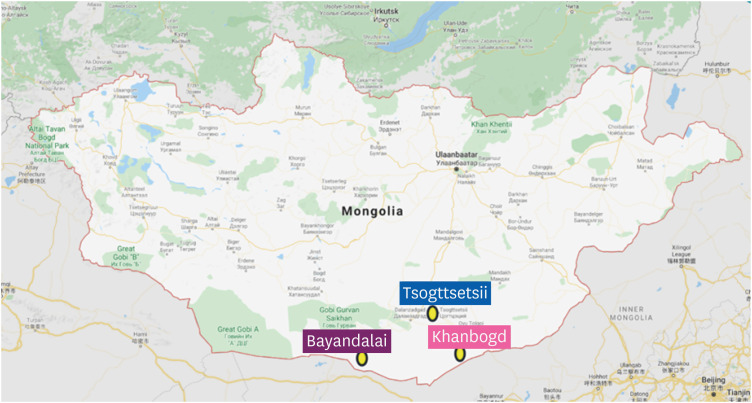

Fig. 1 Study area.
Fig. 2 Correlation between hair mercury and blood mercury concentration.
Fig. 1
Fig. 2
Environmental health survey for children residing near mining areas in South Gobi, Mongolia
| Characteristics | Area | p-valuea | |||
|---|---|---|---|---|---|
| Bayandalai | Tsogttsetsii | Khanbogd | |||
| Total | 27 (22.9) | 47 (39.8) | 44 (37.3) | ||
| Sex | < 0.001 | ||||
| Male | 9 (33.3) | 27 (57.4) | 15 (34.1) | ||
| Female | 18 (66.7) | 20 (42.6) | 29 (65.9) | ||
| Age | |||||
| Mean ± SD | 9.93 ± 0.83 | 9.83 ± 0.60 | 10.73 ± 0.90 | < 0.001b | |
| 9–10 (years) | 19 (70.4) | 42 (89.4) | 22 (50.0) | < 0.001 | |
| 11–12 (years) | 8 (29.6) | 5 (10.6) | 22 (50.0) | ||
| Father's education level | 0.085 | ||||
| Middle school than less | 12 (48.0) | 14 (32.6) | 12 (27.9) | ||
| High school and trade school | 7 (28.0) | 21 (48.8) | 18 (41.9) | ||
| College and university | 6 (24.0) | 8 (18.6) | 13 (30.2) | ||
| Mother's education level | 0.154 | ||||
| Middle school than less | 9 (33.3) | 13 (28.3) | 9 (20.5) | ||
| High school and trade school | 8 (29.6) | 9 (19.6) | 21 (47.7) | ||
| College and university | 10 (37.0) | 24 (52.2) | 14 (31.8) | ||
| Father's employment | < 0.001 | ||||
| Shepherd | 15 (55.6) | 2 (4.3) | 7 (15.9) | ||
| Mine | 2 (7.4) | 17 (36.2) | 13 (29.5) | ||
| Other | 10 (37.0) | 28 (59.6) | 24 (54.5) | ||
| Mother's employment | < 0.001 | ||||
| Shepherd | 11 (40.7) | 2 (4.3) | 4 (9.1) | ||
| Mine | 0 (0.0) | 4 (8.5) | 1 (2.3) | ||
| Other | 16 (59.3) | 41 (87.2) | 39 (88.6) | ||
| Incomec (100.000 MNT) | 0.960 | ||||
| Q1 (≤ 4) | 10 (37.0) | 8 (17.0) | 12 (27.3) | ||
| Q2 (> 4, ≤ 7) | 9 (33.3) | 14 (29.8) | 6 (13.6) | ||
| Q3 (> 7, ≤ 10) | 4 (14.8) | 14 (29.8) | 13 (29.5) | ||
| Q4 (> 10) | 4 (14.8) | 11 (23.4) | 12 (36.4) | ||
| House type | < 0.001 | ||||
| Gerd | 21 (77.8) | 30 (63.8) | 28 (63.6) | ||
| Other | 6 (22.2) | 17 (36.2) | 16 (36.4) | ||
| Home heating system | < 0.001 | ||||
| Stove | 22 (81.5) | 39 (83) | 38 (86.4) | ||
| Other | 5 (18.5) | 6 (12.8) | 5 (11.4) | ||
| Type of a major heating fuels | < 0.001 | ||||
| Dried livestock excreta | 11 (47.8) | 2 (5.0) | 2 (5.0) | ||
| Coal | 12 (52.2) | 37 (92.5) | 40 (93.0) | ||
| Drinking water | < 0.001 | ||||
| Tap water/purified water | 7 (25.9) | 11 (23.4) | 11 (25.0) | ||
| Ground water | 19 (70.4) | 35 (74.5) | 33 (75.0) | ||
| Within 5 km of the mine | < 0.001 | ||||
| Yes | 1 (3.7) | 23 (48.9) | 4 (9.1) | ||
| No | 25 (92.6) | 24 (51.1) | 40 (90.9) | ||
| Smoking family member | 0.043 | ||||
| Yes | 14 (50.0) | 28 (59.6) | 29 (65.9) | ||
| No | 14 (50.0) | 19 (40.4) | 15 (34.1) | ||
| Smoking near a child | < 0.001 | ||||
| Yes | 6 (35.3) | 13 (28.3) | 8 (18.2) | ||
| No | 11 (64.7) | 33 (71.7) | 36 (81.8) | ||
| Sample type | Metals | Area (soum) | GM (95% CI) | p-valuea | Post-hocb grouping |
|---|---|---|---|---|---|
| Blood | Cd (µg/L) | Bayandalai | 0.16 (0.13–0.20) | 0.545 | |
| Tsogttsetsii | 0.15 (0.14–0.16) | ||||
| Khanbogd | 0.16 (0.15–0.17) | ||||
| Pb (µg/dL) | Bayandalai | 7.42 (6.45–8.54) | < 0.001 | A > B, C | |
| Tsogttsetsii | 4.78 (4.36–5.23) | ||||
| Khanbogd | 5.15 (4.65–5.71) | ||||
| Hg (µg/L) | Bayandalai | 0.38 (0.34–0.42) | 0.002 | A > B, C | |
| Tsogttsetsii | 0.29 (0.27–0.32) | ||||
| Khanbogd | 0.29 (0.26–0.32) | ||||
| Hair | Hg (µg/g) | Bayandalai | 0.78 (0.66–0.93) | < 0.001 | A, B > C |
| Tsogttsetsii | 0.66 (0.58–0.75) | ||||
| Khanbogd | 0.50 (0.44–0.57) | ||||
| Urine | As (µg/L) | Bayandalai | 26.11 (17.99–37.89) | 0.331 | |
| Tsogttsetsii | 23.89 (18.53–30.79) | ||||
| Khanbogd | 36.93 (30.75–44.36) |
| Characteristics | Area | p-valuea | ||||||
|---|---|---|---|---|---|---|---|---|
| Bayandalai | Tsogttsetsii | Khanbogd | ||||||
| No. | GM (95% CI) | No. | GM (95% CI) | No. | GM (95% CI) | |||
| Sex | ||||||||
| Male | 9 | 7.99 (7.01–9.20) | 27 | 4.83 (4.24–5.57) | 15 | 5.53 (4.62–6.51) | 0.002 | |
| Female | 18 | 7.16 (5.91–8.77) | 20 | 4.70 (4.34–5.10) | 29 | 4.93 (4.30–5.58) | < 0.001 | |
| p-valueb | 0.86 | 0.437 | 0.251 | |||||
| Age | ||||||||
| 9–10 (years) | 19 | 7.71 (6.91–8.53) | 42 | 4.76 (4.33–5.19) | 22 | 5.74 (5.01–6.44) | < 0.001 | |
| 11–12 (years) | 8 | 6.79 (4.89–10.60) | 5 | 4.97 (3.65–6.78) | 22 | 4.58 (3.93–5.27) | 0.166 | |
| p-valueb | 0.921 | 0.777 | 0.026 | |||||
| Father's education level | ||||||||
| Middle school than less | 12 | 9.0 (7.51–11.31) | 14 | 6.00 (5.17–7.05) | 12 | 5.02 (4.01–6.09) | 0.003 | |
| High school and trade school | 7 | 6.74 (5.85–7.54) | 21 | 4.31 (3.92–4.72) | 18 | 5.07 (4.18–6.13) | 0.002 | |
| College and university | 6 | 6.12 (4.69–8.44) | 8 | 4.33 (3.31–5.48) | 13 | 5.28 (4.62–5.98) | 0.119 | |
| p-valueb | 0.129 | 0.003 | 0.963 | |||||
| Mother's education level | ||||||||
| Middle school than less | 9 | 7.69 (6.82–8.78) | 13 | 5.69 (4.86–6.91) | 9 | 5.39 (4.60–6.14) | 0.032 | |
| High school and trade school | 8 | 9.16 (7.12–12.72) | 9 | 4.79 (4.14–5.58) | 21 | 5.56 (4.78–6.38) | 0.001 | |
| College and university | 10 | 6.08 (5.09–7.35) | 24 | 4.36 (3.86–4.90) | 14 | 4.39 (3.56–5.39) | 0.013 | |
| p-valueb | 0.094 | 0.039 | 0.15 | |||||
| Father's employment | ||||||||
| Shepherd | 15 | 8.04 (6.90–9.91) | 2 | 5.05 (4.07–6.25) | 7 | 5.41 (4.33–6.65) | 0.151 | |
| Mine | 2 | 7.38 (5.49–9.93) | 17 | 4.77 (4.08–5.73) | 13 | 4.87 (3.78–6.10) | 0.3 | |
| Other | 10 | 6.59 (5.33–8.28) | 28 | 4.76 (4.32–5.22) | 24 | 5.19 (4.59–5.85) | 0.007 | |
| p-valueb | 0.531 | 0.935 | 0.942 | |||||
| Mother's employment | ||||||||
| Shepherd | 11 | 8.71 (7.262–11.28) | 2 | 5.05 (4.07–6.25) | 4 | 5.70 (4.96–7.45) | 0.233 | |
| Mine | 0 | 0 (0.0) | 4 | 4.67 (2.73–5.80) | 1 | 4.96 (0.00–0.00) | 0.952 | |
| Other | 16 | 6.65 (5.72–7.74) | 41 | 4.78 (4.35–5.20) | 39 | 5.08 (4.53–5.69) | 0.002 | |
| p-valueb | 0.085 | 0.977 | 0.875 | |||||
| Incomec (100.000 MNT) | ||||||||
| Q1 (≤ 4) | 10 | 9.07 (7.39–12.10) | 8 | 4.86 (4.31–5.52) | 12 | 6.34 (5.68–7.06) | < 0.001 | |
| Q2 (> 4, ≤ 7) | 9 | 6.70 (5.27–8.08) | 14 | 5.03 (4.29–6.10) | 6 | 4.86 (4.39–5.32) | 0.049 | |
| Q3 (> 7, ≤ 10) | 4 | 6.65 (5.12–8.88) | 14 | 4.72 (3.80–5.80) | 13 | 5.02 (4.06–6.16) | 0.319 | |
| Q4 (> 10) | 4 | 6.32 (4.89–9.93) | 11 | 4.49 (4.00–5.04) | 12 | 4.52 (3.60–5.56) | 0.172 | |
| p-valueb | 0.235 | 0.732 | 0.071 | |||||
| House type | ||||||||
| Gerd | 21 | 7.74 (6.80–8.80) | 30 | 4.62 (4.0–5.20) | 28 | 5.92 (5.44–6.44) | < 0.001 | |
| other | 6 | 6.49 (4.71–8.88) | 17 | 5.07 (4.43–5.75) | 16 | 3.99 (3.35–4.78) | 0.03 | |
| p-valueb | 0.294 | 0.47 | < 0.001 | |||||
| Home heating system | ||||||||
| Stove | 22 | 7.86 (6.97–9.16) | 39 | 4.77 (4.30–5.28) | 38 | 5.27 (4.69–5.86) | < 0.001 | |
| Other | 5 | 5.76 (4.33–7.68) | 6 | 4.90 (3.58–6.25) | 4 | 4.10 (2.78–5.95) | 0.539 | |
| p-valueb | 0.193 | 0.945 | 0.164 | |||||
| Type of a major heating fuels | ||||||||
| Dried livestock excreta | 11 | 8.30 (6.75–10.65) | 2 | 7.57 (4.69–12.2) | 2 | 6.37 (5.17–7.84) | 0.851 | |
| Coal | 12 | 7.05 (5.80–8.56) | 37 | 4.65 (4.20–5.08) | 40 | 5.17 (4.64–5.72) | 0.002 | |
| p-valueb | 0.298 | 0.004 | 0.367 | |||||
| Drinking water | ||||||||
| Tap/purified water | 7 | 6.25 (5.31–7.52) | 11 | 4.06 (4.09–5.16) | 11 | 4.46 (3.51–5.56) | 0.044 | |
| Ground water | 19 | 7.97 (6.77–9.50) | 35 | 4.92 (4.44–5.53) | 33 | 5.37 (4.84–5.97) | < 0.001 | |
| p-valueb | 0.378 | 0.272 | 0.151 | |||||
| Within 5 km of the mine | ||||||||
| Yes | 1 | 7.86 (0.0–0.0) | 23 | 4.60 (3.94–5.35) | 4 | 5.19 (4.03–7.14) | 0.354 | |
| No | 25 | 7.45 (6.50–8.71) | 24 | 4.96 (4.53–5.50) | 40 | 5.12 (4.58–5.68) | < 0.001 | |
| p-valueb | 0.862 | 0.733 | 0.875 | |||||
| Smoking family member | ||||||||
| Yes | 14 | 8.82 (6.85–10.72) | 28 | 4.54 (4.04–5.03) | 15 | 5.15 (4.51–5.85) | < 0.001 | |
| No | 14 | 6.68 (5.80–7.65) | 19 | 5.16 (4.48–6.12) | 44 | 5.08 (4.28–5.93) | 0.044 | |
| p-valueb | 0.13 | 0.142 | 0.745 | |||||
| Smoking near a child | ||||||||
| Yes | 6 | 9.32 (6.65–14.81) | 13 | 4.84 (4.32–5.37) | 8 | 4.94 (3.73–6.51) | 0.006 | |
| No | 11 | 6.94 (6.04–8.03) | 33 | 4.77 (4.22–5.24) | 36 | 5.17 (4.66–5.71) | 0.006 | |
| p-valueb | 0.153 | 0.842 | 0.814 | |||||
Table 1 General characteristics of child participants
Data are shown as mean ± SD or number (%).
SD: standard deviation.
aThe
Table 2 Distribution of heavy metals and comparison of heavy metal concentrations between the 3 areas
Post-hoc grouping is presented as follow: A, Bayandalai; B, Tsogttsetsii; C, Khanbogd.
GM: geometric means; CI: confidence interval.
aThe
Table 3 GM (95% CI) of blood lead concentration according to general characteristics
GM: geometric means; CI: confidence interval; ANOVA: analysis of variance.
aThe

