Cogeneration plant and environmental allergic diseases: is it really an eco-friendly energy source?
Article information

Abstract
Background
Combined heat and power generation (CHP generation, also called ‘cogeneration’) is attracting public attention for its high thermal efficiency, without considering possible adverse environmental health effects.This study investigated the potential role of cogeneration plants in inducing 3 environmental diseases: asthma, allergic rhinitis, and atopic dermatitis.
Methods
From 1 January 2013 to 31 December 2017, the towns (dongs) of South Korea in which a cogeneration plant started operation were selected as study sites. For comparison, a matched control dong with the most similar Gross Regional Domestic Product for each case dong was selected. The numbers of outpatient visits, inpatient admissions, and emergency visits provided by the National Health Insurance Sharing Service (NHISS) were analyzed using an interrupted time-series design. For air pollutants, the concentrations of 5 air pollutants from the AIRKOREA dataset were used.
Results
A total of 6 cogeneration plants in 6 case dongs started operation during the study period. For overall case dongs, the pre-CHP trend was 1.04 (95% confidence interval [CI]: 1.038–1.042), and the post-CHP trend was 1.248 (95% CI: 1.244–1.253). The intercept change due to the CHP plant was 1.15 (95% CI: 1.137–1.162). For overall control dongs, the pre-CHP trend was 1.133 (95% CI: 1.132–1.135), and the post-CHP trend was 1.065 (95% CI: 1.06–1.069). The intercept change due to the CHP plant was 0.888 (95% CI: 0.878–0.899). Only for CO and NO2, the relative risk (RR) for overall case dongs was statistically significantly increased, and the RR for the overall control dongs was statistically insignificant.
Conclusions
Possible hazardous emissions, like CO and NO2, from cogeneration plants could induce environmental diseases in nearby community populations. The emissions from cogeneration plants should be investigated regularly by a governmental agency, and the long-term health outcomes of nearby community residents should be investigated.
INTRODUCTION
In recent years, to cope with the global climate crisis and environmental pollution, the government of each country and global investment banks are declaring to stop supporting the coal-fired power generation industry. They are joining ‘Power Past Coal Alliance’ [1] to accelerate the phasing out of coal-fired power stations. According to the ‘Global Energy and CO2 Status Report 2018’ by the International Energy Agency [2], coal-fired power generation contributed to about 30% of global warming, the single biggest contributor among all causes, by emitting a tremendous amount of CO2. Furthermore, it is very well known that coal-fired power plants emit a variety of environmental pollutants, including heavy metals (mercury, arsenic, chrome, nickel, cadmium, etc.), nitrogen oxides, sulfur oxides, and particulate matters (PMs; PM10 and PM2.5) [345].
Because of these 2 problems (air pollution and the accelerating global climate crisis) of conventional fossil fuel power plants, the governments of many developed countries are adopting various environment-friendly power generating measures, including wind, sunlight, water, geothermal, and tidal power generation [6789]. Among them, combined heat and power generation (CHP generation, also called ‘cogeneration’) is a representative eco-friendly electricity generation option for many countries. The thermal efficiency of typical fossil fuel power stations is usually 33%–45%. On the contrary, the thermal efficiency of cogeneration plants is 80%–85% because they convert their input into not only electricity but also heat for heating and cooling systems [10].
Cogeneration uses various fuels, including natural gas, biomass, industrial and municipal solid waste (incineration), and waste gas [10]. These fuels are known to be eco-friendly and contribute to protecting the natural environment by reducing and facilitating the reuse of waste materials. Because of these environmental advantages, the United States has an aggressive goal of having CHP constitute 20% of its generation capacity by the year 2030 [11], and each country in the European Union is increasing its target percentage of cogenerated electricity production up to 30% [12].
However, as cogeneration plants use fossil fuel (natural gas), biomass, waste materials, and waste gas, some possible harmful health effects could affect nearby residents or workers in the plants. A lot of previous literature reported possible adverse health effects associated with biomass burning, incineration, and even natural gas [13141516]. Even if the previous literature that dealt with the advantages of cogeneration reported possible environmental and health benefits [17181920], this type of generation is not free of possible health concerns associated with burned fuels. Considering the proximity of cogeneration plants to the urban community to provide district heating, the possible health effects from this cogeneration plant should be meticulously investigated.
Much of the literature dealt with the relationship between air pollution and allergic diseases [21222324]. Among various air pollutants, PMs (PM10 and PM2.5), SO2, and NO2 are significantly associated with increased allergic diseases, including asthma, atopic dermatitis, and allergic rhinitis. The underlying mechanism of this increased incidence of allergic diseases is well illustrated in the literature [2526]. Exposure to air pollutants induces oxidative stress and a pro-inflammatory environment in the mucosal epithelial tissue. This pro-inflammatory microenvironment contributes to the development of allergic diseases in genetically susceptible or epigenetically modified individuals. The author hypothesized that this sequential chain of events, air pollution-pro-inflammatory micro-environment-increased incidence of various allergic diseases, would be the same for residents near a CHP plant.
Therefore, in this literature, the author investigated possible adverse health effects from the cogeneration plant, focusing on 3 environmental allergic illnesses: asthma, atopic dermatitis, and allergic rhinitis. The temporal changes of these 3 environmental allergic illnesses among nearby residents from the start of the operation of cogeneration plants were tracked using certified data from the national health insurance service. From this study, readers could understand possible adverse health effects to the regional community from the installation and operation of cogeneration plants. Furthermore, this study could direct future policy on environment-friendly energy sources and counteracting the climate crisis.
METHODS
Study period
The study period was from 1 January 2013 to 31 December 2017. In South Korea, the towns in which a cogeneration plant was installed during the study period were the study sites. All residents during the study period were the study subjects. As for the study period, the 60 months in the 5 years from 2013 to 2017 were divided into 2 periods: the pre-operation months and the operation months. The months before the starting month of the cogeneration plant operation were considered ‘pre-operation months.’ The months in which the cogeneration plant started to operate and the months after were considered ‘operation months.’
Study sites
As for the study sites, the towns (in Korean administrative districts, or -Dongs) in which a cogeneration plant was installed and started operation during the study period were screened using ‘The Manual of Integrated Energy Businesses 2019,’ published by the Korea Energy Agency. The exact site of cogeneration plant installation and the corresponding administrative district ‘-Dong’ was confirmed using a commercial Geographic Information System Software, QGIS 3.12.0.
The dataset for allergic diseases
As for the 3 environmental illnesses data, the environmental disease dataset from the National Health Insurance Sharing Service (NHISS) was used. Because of an increased research demand about environmental factors causing environmental diseases, the NHISS constructed and made public this dataset in May of 2019. This dataset provides users with the daily number of outpatient visits, inpatient admissions, and emergency department visits due to 3 environmental allergic diseases (asthma, atopic dermatitis, and allergic rhinitis), classified by each unit of the Korean administrative district, Si, Gun, Gu, Eup, Myeon, and Dong. This dataset also provides the age (classified into 5-year intervals) and sex (male: 1 and female: 2) of each patient. In addition, this dataset provides the total number of residents in each dong each year, classified by age (5-year intervals) and sex. To count the number of outpatient department visits, inpatient admissions, and emergency department visits, both the primary and secondary diagnostic codes were used.
The dataset for air pollutants
For exposure assessment, the concentrations of 5 air pollutants (PM10, SO2, CO, O3, and NO2) for each dong were extracted from the AIRKOREA dataset. The AIRKOREA dataset provides online users with the real-time concentration of the above 5 air pollutants (plus PM2.5 as of 2017), using 5 air quality monitoring networks (roadside, urban, rural, national background, and harbor). The author found the nearest monitoring station from the dong community service center of each case dong. Even if the distance between the nearest monitoring station and the dong community service center was over 4 km, because there was no exposure data for the CHP plant sites or each subject dong, the author used the air quality dataset from the AIRKOREA dataset as a proxy for the air quality of a dong of interest.
Interrupted time-series design and control by place design
Interrupted time-series design [27] and the control by place design [28] were applied in this study. CHP plant installation and operation were regarded as the main intervention in this study. During the pre-operation months, the CHP variable was coded as 0, and during the operation months, the CHP variable was coded as 1.
For the selected dongs as study sites, matched control dongs were selected from the same Do or Metropolitan City. For the selection of matched control dongs, Gross Regional Domestic Product (GRDP) from 2012 to 2016 of each Si, Gun, and Gu was used. In the same Do or Metropolitan City, a Si, Gun, or Gu with the most similar GRDP with the Si, Gun, or Gu of each case dong was selected as the matched control dong (Supplementary Table 1).
Analysis methods for allergic diseases data
For allergic disease data, the Poisson regression method was used. The CHP variable, whether a CHP plant was installed and operated or not, was the variable of interest. The age interval (5-year intervals) and sex (male or female) variables were included as covariates. Seasonality was adjusted using a harmonic term, and a pre-intervention trend was also adjusted. The used model reflected both the level change (intercept change) and the trend change (slope change). The number of residents with the same age interval and sex in each dong each year was included as the total number of population in the regression equation. The outcome variable was the number of outpatient department visits, inpatient admissions, and emergency department visits, and the total number of these 3 types of medical uses for asthma, atopic dermatitis, allergic rhinitis, and for overall these 3 allergic diseases. The number of inpatient admission counted each inpatient admission as one count, not permitting duplicated count during the admission period.
The analysis was conducted for each case dong and matched control dong and for all case dongs and control dongs by combining and analyzing the data for each dong. Sensitivity analyses, excluding some dongs with outstanding relative risks (RRs), were also conducted. For the issue of over-dispersion, quasi-Poisson distribution was also applied in the same regression equation.
For plotting the predicted medical uses for case dongs and control dongs under a virtual scenario in which a CHP plant started its operation in January of 2015, an age variable of 40 (the median value for the age interval variable) and sex variable of 1.5 (the median value for the sex variable) were applied.
Analysis methods for air pollutants data
For air pollutant data, a generalized linear model with Gaussian distribution was used. The CHP, age, and sex variables were applied in the same way as for the analysis of allergic disease data. Seasonality was adjusted using a harmonic term, and a pre- and post-intervention trend was also adjusted. The finally applied model reflected only a level change (intercept change) and did not reflect a trend change (slope change). The outcome variable was the log-transformed mean level of PM10, SO2, CO, O3, and NO2 in each month. The analysis was conducted for each case dong and each matched control dong, and for all case dongs and all control dongs, by combining and analyzing the data for each dong.
Statistical software
All statistical analyses were conducted using R software version 4.0.2 (R Foundation, Vienna, Austria). Package ‘data.table,’ ‘dplyr,’ ‘lmtest,’ ‘Epi,’ ‘vcd’, ‘tsModel,’ ‘lmtest,’ and ‘splines’ were used.
RESULTS
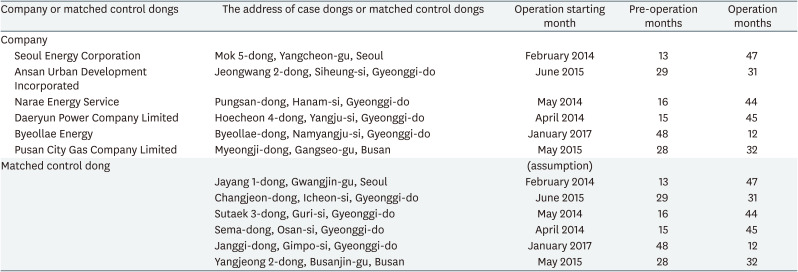
In Table 1, the company, address, operation starting month, pre-operation months, and operation months of case dongs and matched control dongs are provided. A total of 6 cogeneration plants started operation from 1 January 2013 to 31 December 2017. Two cogeneration plants were excluded from the analysis: one CHP plant in Wirye-dong and another in Dongsan-myeon (Supplementary Table 2). The dataset for allergic diseases in Wirye-dong does not exist because of the change of administrative districts for the area. Therefore, Wirye-dong was excluded from the analysis. For Dongsan-myeon, the plant was installed in November of 2017, and there are only 2 operational months (November and December of 2017) available. The author concluded that only 2 operation months are not sufficient for the main analysis used in this study, the slope and intercept change model. Therefore, Dongsan-myeon was excluded from the analysis.
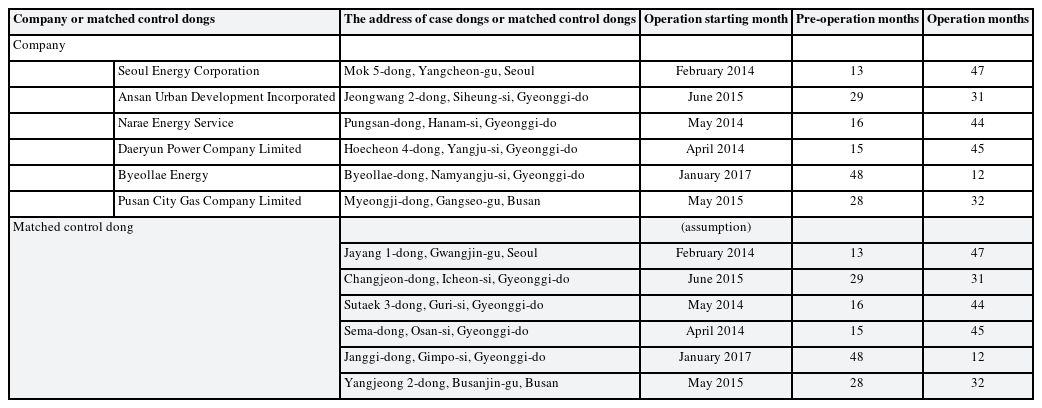
The company, address, operation starting month, and pre- and post-operation months of each cogeneration plant/matched control dongs for case dongs
Four dongs from Gyeonggi-do, one dong from Seoul, and one dong from Busan are included in the main analysis. Operation starting months range from February of 2014 to January of 2017. Operation months range from 12 to 47 months. For 6 case dongs, 6 matched control dongs are selected using GRDP, as stated in the Methods section. For each matched control dong, the same operation starting month is assumed.
In Supplementary Table 3, for each case dong and matched control dong, the corresponding air quality monitoring station code and the distance between the monitoring station and each dong community service center are provided. The distances range from 0.9 to 6.1 km for case dongs and from 0.3 to 4.6 km for matched control dongs.
In Supplementary Table 4, the mean numbers of monthly hospital visits and the total outpatient department visits, inpatient admissions, and emergency department visits due to each allergic disease and the overall 3 allergic diseases are provided. In the right end column, the mean number of the total yearly population is provided. The proportion of the mean number of monthly hospital visits to the mean number of the total yearly population is also provided. For overall case dongs during the pre-operation months, the mean number of monthly hospital visits was 6,872 (23.9% of the total population). During the operation months, the mean number of monthly hospital visits was 12,678 (35.2% of the total population). For overall control dongs during the pre-operation months, the mean number of monthly hospital visits was 6,208 (27.1% of the total population). During the operation months, the mean number of monthly hospital visits was 7,186 (30.2% of the total population).
In Supplementary Data 1, the representative example of statistical equations and R codes used for the main analyses are provided.
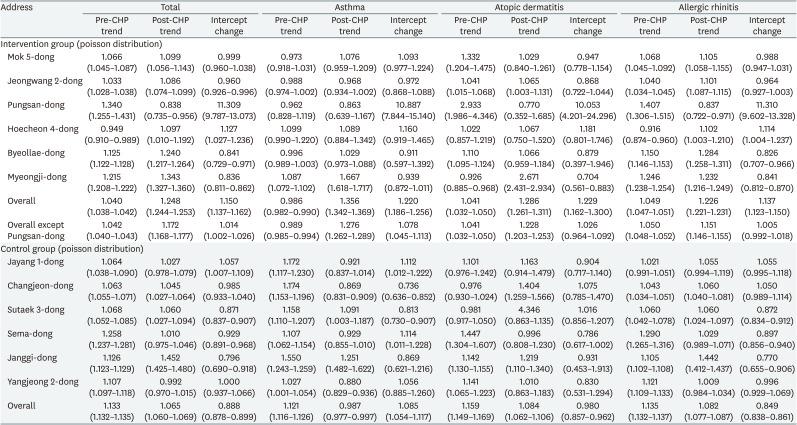
In Table 2, the RR of the pre-CHP period trend (for 12 months), post-CHP period trend (for 12 months), and the intercept change due to CHP plant operation are provided. For overall case dongs, the pre-CHP trend was 1.04 (95% confidence interval [CI]: 1.038–1.042), and the post-CHP trend was 1.248 (95% CI: 1.244–1.253). The intercept change due to the CHP plant was 1.15 (95% CI: 1.137–1.162). For overall control dongs, the pre-CHP trend was 1.133 (95% CI: 1.132–1.135), and the post-CHP trend was 1.065 (95% CI: 1.06–1.069). The intercept change due to the CHP plant was 0.888 (95% CI: 0.878–0.899). For the sensitivity analysis, for the case dongs except for Pungsan-dong, the same statistical estimates are calculated. The pre-CHP trend was 1.042 (95% CI: 1.040–1.043), and the post-CHP trend was 1.172 (95% CI: 1.168–1.177). The intercept change due to the CHP plant was 1.014 (95% CI: 1.002–1.026).
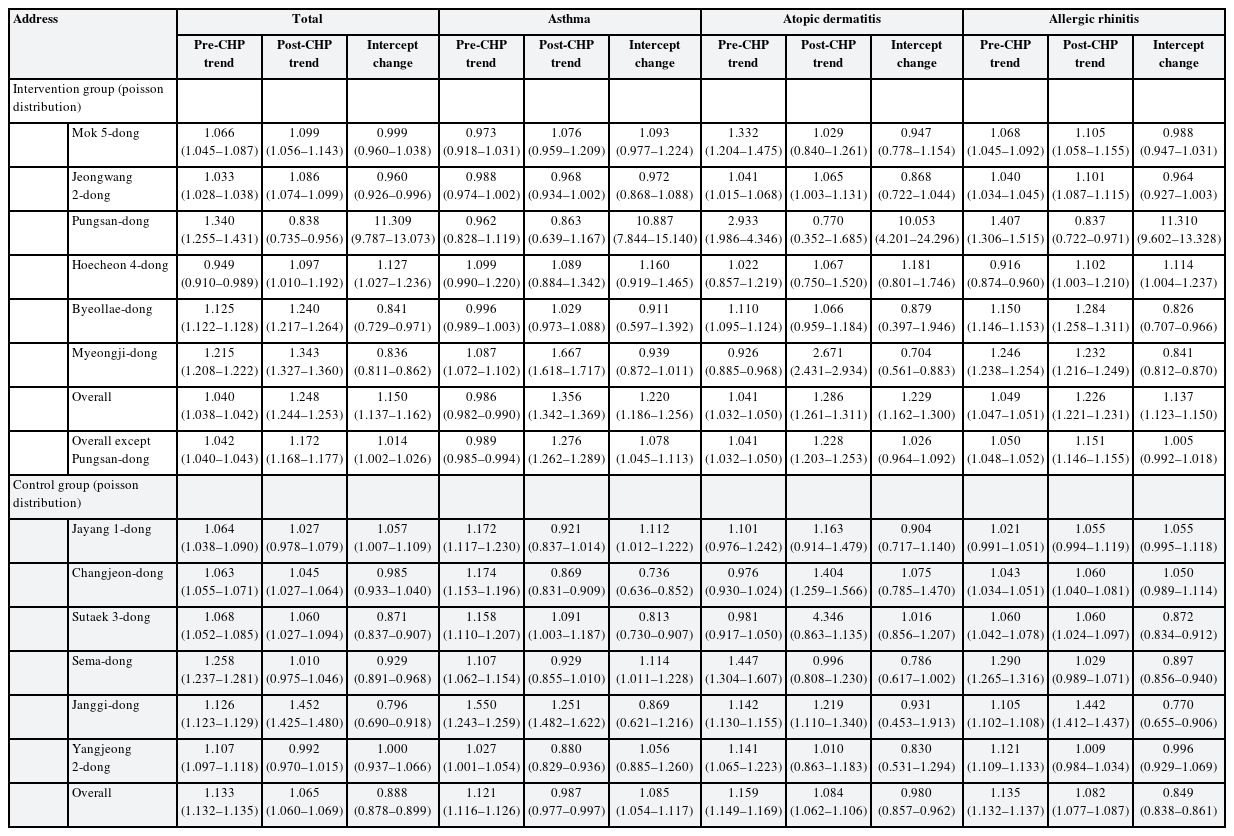
The relative risk of the pre-CHP trend, post-CHP trend, and intercept change for total and each allergic disease
Supplementary Table 5 provides stratified analysis results according to outpatient department visits, inpatient admissions, and emergency department visits. Supplementary Table 6 provides the same statistical equations and R codes, except the quasi-Poisson distribution was applied. Supplementary Table 7 provides the RR for the age and sex variables according to each allergic disease and the total allergic diseases.
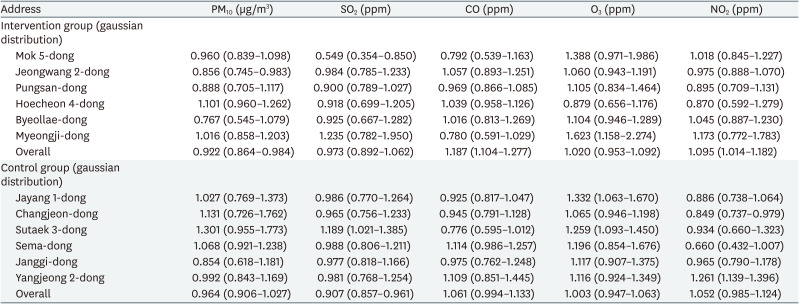
Table 3 provides the RR of PM10, SO2, CO, O3, and NO2 level (intercept) change after CHP plant operation. Only for CO and NO2, the RR for overall case dongs increased statistically significantly, and the RR for overall control dongs was statistically insignificant. For SO2, the RR for overall case dongs was statistically insignificant, and the RR for overall control dongs decreased statistically significantly. However, for PM10, the RR for overall case dongs was decreased statistically significantly, and the RR for overall control dongs was statistically insignificant.
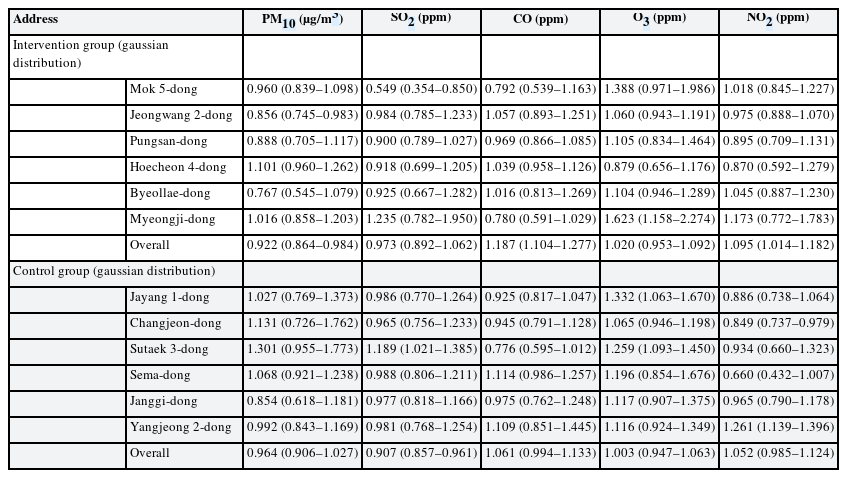
The relative risk of PM10, SO2, CO, O3, and NO2 level (intercept) changes after CHP plant operation
Fig. 1 provides the predicted number of 3 allergic diseases per 1,000 capita along the time. The black line indicates the predicted number of cases on the scenario in which a CHP plant was introduced in January of 2015. The red line indicates a counterfactual scenario with no CHP plant from January of 2013 to December of 2017. In Supplementary Figs. 1, 2, 3, similar plots for each allergic disease are provided.
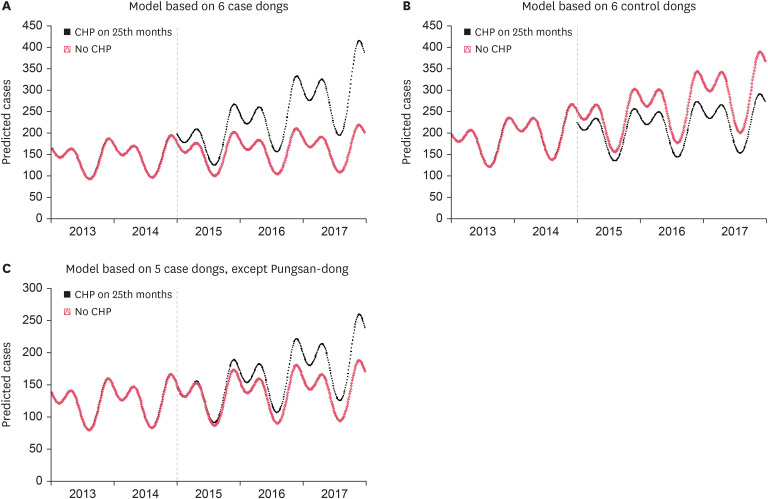
The predicted number of 3 allergic diseases per 1,000 capita along the time. Blackline: predicted cases for the scenario in which a CHP plant is introduced in January of 2015. Redline: counterfactual scenario with no CHP plant. (A) Model based on 6 case dongs. (B) Model based on 6 control dongs. (C) Model based on 5 case dongs, except Pungsan-dong.
CHP: combined heat and power.
DISCUSSION
Overall, for case dongs, the introduction of a CHP plant induced an increase in the slope and a statistically significant increase in the intercept of the number of medical uses along the time. However, for matched control dongs, the introduction of a CHP plant did not induce an increase in the slope and no statistically significant increase in the intercept of the number of medical uses along the time. Instead, for control dongs, the introduction of a CHP plant induced a decrease in the slope. These features were similarly observed for each of the 3 allergic diseases. The plots in Fig. 1 illustrate these features well.
For air pollutants, CO and NO2 showed a statistically significant increased RR for case dongs and a statistically insignificant RR for matched control dongs. SO2 showed a statistically insignificant RR for case dongs and a statistically decreased RR for matched control dongs.
The benefits of cogeneration plants compared with conventional fossil fuel-fired generation plants were reported in the literature [17181920]. These studies reported decreased emissions of CO2, NOx, SO2, CH4, PM2.5, and PM10 compared with coal-fired generation plants. However, even though the emission of these air pollutants decreased, there remains a moderate amount of air pollutants emitted from the cogeneration plant [171820].
For the cogeneration plant itself, previous literature directly analyzed the components of emissions from gas-fired cogeneration plants [2930]. In these 2 studies, NOx, SO2, CO, aldehydes, and unburned hydrocarbon are moderately measured from gas-fired cogeneration plants.
Some research analyzed the health impact of natural gas-fired cogeneration plants using methodologies for cost-analysis [1516]. In Fouladi et al. [15], the main adverse health effect was due to nitrates, and in Alrafea et al. [16], the main adverse health effect was due to PM2.5. Although the costs of health damage from gas-fired cogeneration plants were lower than those from other heavy fuel-fired plants, the potential costs associated with health and environmental damage were sizable, worthy of consideration in future energy policies.
Only one study [13] analyzed emergency department visits and hospital admissions in aged people living close to a gas-fired cogeneration plant. This study reported that the concentrations of PM10 and NO2 were higher after the operation of the cogeneration plant than before the operation of the cogeneration plant, with the highest concentration recorded within 1km. The emergency department visits and hospital admissions were positively correlated with the PM10 and NO2 concentrations in older people (≥ 70 or 80-years-old).
Currently, cogeneration plants typically use 4 types of energy sources: natural gas, biomass, waste gas, and waste material. For each energy source, previous literature analyzed and reported the potential hazardous emissions: natural gas [3031323334], biomass [3536], waste gas [37], and waste materials [38394041424344454647]. For the incineration of solid waste materials, many epidemiologic studies have warned of some risk of congenital malformations [1448], hematologic malignancies [4950], lung and larynx cancer [48], and soft-tissue sarcomas [50]. However, the context of these studies differed from that of the cogeneration plants because these studies focused on sole municipal waste incinerators and not cogeneration plants. The burning efficiency of a waste material-fired cogeneration plant is higher than the typical waste material incinerators. Therefore, the emission of hazardous materials due to incomplete combustion is lower for waste material-fired cogeneration plants.
From these study results, the increased medical uses due to 3 environmental illnesses (asthma, allergic rhinitis, and atopic dermatitis) in nearby community residents after cogeneration plant operation can be demonstrated. In addition, from the exposure data of air pollutants, CO and NO2 can be selected as the possible causative air pollutants.
Three epidemiologic concepts should be considered in this study. The first is the problem of ecological fallacy. Given that ecological fallacy arises when significant individual-level confounders are not considered in the ecological-level analysis, this study might be vulnerable to this fallacy. However, by considering the age and sex of each subject group, the possibility of ecological fallacy might be diminished. Furthermore, by selecting a matched control dong with similar GRDP in the same Do or Metropolitan City, the socioeconomic status of dong populations could be matched. Given that previous literature reported the positive association between socioeconomic status and alcohol or smoking status [515253], this GRDP matching method might minimize possible ecological fallacy due to the differences in smoking or alcohol consumption.
The second epidemiologic concept to be considered is the possibility of confounding bias. However, due to the interrupted time series design for each case and control dong, the same population was the subject of this study along the time, except for moving in and moving out. In addition, the author considered the age interval and sex of each subject group. Therefore, within each dong, the other characteristics of the population might be similar along time. This might minimize the possibility of confounding bias within each dong. For the comparison with matched control dongs, selecting the dong with the most similar GRDP within the same Do or Metropolitan City might minimize the possibility of confounding by unconsidered factors.
The third epidemiologic concept to be considered is the use of the controlled interrupted time-series design. The conventional interrupted time-series design with only an intervention group could be affected by history bias [28]. By selecting appropriate controls, researchers could control for possible history bias. In this study, the author used matched control dongs with a similar GRDP. The NHISS dataset is available now only for 2013 to 2017. However, considering the dataset will be updated in the future continuously, the ‘control by time’ design considering random 5 years after the operation of the cogeneration plant will also be possible in the near future.
This study has several limitations. The first is the inclusion of population data according to the administrative district. For a more accurate analysis, the persons living in the circular area centered around a cogeneration plant should be included. However, for potential problems associated with personal identification, the NHISS provides the dataset in the dong unit. Therefore, the population data analysis in the dong unit was the best alternative for this study. However, the author concluded that the population data in the dong unit is enough to observe the general trend of environmental illness prevalence.
The second limitation is that the exposure data of air pollutants for each dong was not available. Instead, the author used the data from the nearest monitoring station. However, because the distance between the monitoring station and each dong is far for some dongs, the analysis could be inaccurate for some dongs. In future studies, as a mediating media, the concentration of each air pollutant in each study dong should be acquired for a more reliable causation analysis.
The third is that except for the 3 environmental illnesses, the dataset for other respiratory and allergic diseases was not available. Other possible adverse health effects associated with the cogeneration plant should also be investigated in future studies.
Finally, the exact energy source composition and the characteristics of emission for each cogeneration plant were not available. If this information becomes publicly available, a more accurate causal inference analysis for these environmental illnesses will be possible.
Cogeneration plants elevate their thermal efficiency by nearly up to 85% by reusing waste heat for heating purposes. However, because of the proximity of a cogeneration plant to a residential area, it could emit hazardous air pollutants directly into the residential area. Therefore, possible hazardous emissions from cogeneration plants and the long-term health outcome of nearby residents should be investigated in future studies.
Recently, upon the publication of a book by Rifkin titled “The Green New Deal,” [54] the government of each country is trying to reduce the emission of greenhouse gases and the use of carbon-based fossil fuels as an energy source. Cogeneration has a distinctly strong thermal efficiency. However, considering the cogeneration plant involves the burning of carbon-based fossil fuels, the conversion of energy sources into pure renewable energy sources (wind, sunlight, geothermal, and tidal power) is required. In light of the possible adverse health effects elucidated from this study, this societal movement is reasonable. McCubbin et al. [55] quantified the health and environmental benefits of 2 wind power plants compared with natural gas-fired power plants. For 2012–2031, the 2 studied wind turbines may save $18 million to $4.38 billion in human health and climate-related externality sectors compared with natural gas-fired plants. Cogeneration is only a stepping-stone energy source that ultimately should lead to pure renewable energy sources.
Notes
Competing interests: The authors declare that they have no competing interest.
References
SUPPLEMENTARY MATERIALS
Supplementary Data 1
The representative examples of statistical equations and used R codes for the main analyses
Supplementary Table 1
Gross Regional Domestic Product (GRDP) from 2012 to 2016 of each -Si, -Gun, and -Gu (unit: 1,000,000 won, standardized for 2010 Producer Price Index)
Supplementary Table 2
The companies, addresses, and operation starting months of 2 cogeneration plants excluded in the analysis
Supplementary Table 3
Air quality monitoring station for each case dong and matched control dong
Supplementary Table 4
The mean numbers of monthly hospital visits (outpatient department visits, inpatient admissions, and emergency department visits) due to each allergic disease and overall 3 diseases according to the CHP plant operation status (the proportion to population)/the mean number of yearly population
Supplementary Table 5
The relative risk of the pre-CHP trend, post-CHP trend, and intercept change of each allergic disease according to outpatient, inpatient, and emergency department
Supplementary Table 6
The relative risk of the pre-CHP trend, post-CHP trend, and intercept change of total and each allergic disease applying quasi-Poisson distribution
Supplementary Table 7
The relative risk for age and sex variables according to each allergic disease and total allergic diseases
Supplementary Fig. 1
The plot of the total number of asthma per 1,000 capita along the time. Blackline: predicted cases on the scenario, which introduced a CHP in January 2015. Redline: counterfactual scenario with no CHP. (A) Model based on 6 case dongs. (B) Model based on 6 control dongs. (C)Model based on 5 case dongs, except Pungsan-dong.
Supplementary Fig. 2
The plot of the total number of atopic dermatitis per 1,000 capita along the time. Blackline: predicted cases on the scenario, which introduced a CHP in January 2015. Redline: counterfactual scenario with no CHP. (A) Model based on 6 case dongs. (B) Model based on 6 control dongs. (C) Model based on 5 case dongs, except Pungsan-dong.
Supplementary Fig. 3
The plot of the total number of allergic rhinitis per 1,000 capita along the time. Blackline: predicted cases on the scenario, which introduced a CHP in January 2015. Redline: counterfactual scenario with no CHP. (A) Model based on 6 case dongs. (B) Model based on 6 control dongs. (C) Model based on 5 case dongs, except Pungsan-dong.