
Articles
- Page Path
- HOME > Ann Occup Environ Med > Volume 32; 2020 > Article
- Research Article Mercury concentration in shark meat from traditional markets of Gyeongsangbuk-do, South Korea
-
Han Cheol Heo1
 , Yeon Hee Lim2, Young Seok Byun1, Joon Sakong1, 3
 -
Annals of Occupational and Environmental Medicine 2020;32:e3.
DOI: https://doi.org/10.35371/aoem.2020.32.e3
Published online: January 2, 2020
1Department of Occupational and Environmental Medicine, Yeungnam University Hospital, Daegu, Korea.
2Graduate School of Environment & Public Health Studies, Yeungnam University, Daegu, Korea.
3Department of Preventive Medicine and Public Health, College of Medicine, Yeungnam University, Daegu, Korea.
- Correspondence to Joon Sakong. Department of Preventive Medicine and Public Health, College of Medicine, Yeungnam University, 170 Hyeonchung-ro, Nam-gu, Daegu 42415, Korea. jjsakong@gmail.com
• Received: September 20, 2019 • Accepted: December 2, 2019
Copyright © 2020 Korean Society of Occupational & Environmental Medicine
This is an Open Access article distributed under the terms of the Creative Commons Attribution Non-Commercial License (https://creativecommons.org/licenses/by-nc/4.0/) which permits unrestricted non-commercial use, distribution, and reproduction in any medium, provided the original work is properly cited.
Abstract
-
Background Although unusually high levels of blood mercury have been reported in the North Gyeongsang Province (Gyeongsangbuk-do), mercury contents from shark meat distributed in this region have not been assessed yet. Thus, this study aims to identify the hazard by evaluating the mercury contents of the shark meat sold in the traditional market of Gyeongsangbuk-do.
-
Methods The shark meat in the form of muscle meat was obtained from 15 traditional markets of Gyeongsangbuk-do in the summer and winter of 2013. Out of 105 samples in total, 49 were collected in the summer and 56 in the winter. The total mercury concentration was measured by the combustion-gold amalgamation method using an automatic mercury analyzer (Milestone DMA-80, Milestone).
-
Results The average mercury concentration of shark meat was 2.29 ± 1.77 µg/g, ranging between 0.06–8.93 µg/g with a geometric mean of 1.44 µg/g, which is higher than those reported in many countries. The mercury concentration in 77 of 105 shark meat samples exceeded 1 µg/g. Mercury concentration ranged between 0.09–8.93 µg/g (geometric mean: 1.45) in the summer and 0.06–6.73 µg/g (geometric mean: 1.48) in the winter.
-
Conclusions Shark meat sold in the market contained a substantial amount of mercury. This suggests that it is difficult to reduce mercury intake by simply strengthening the standard level of mercury concentration in shark meat. Therefore, it is need to communication and awareness programs with consumers about hazardous effects of mercury inherent in shark meat.
BACKGROUND
The health risk of mercury from fish and other seafood consumption has already been reported in many studies [1,2,3,4]. In Japan and the Faroe Islands, it has been reported that long-term maternal ingestion of marine mammals resulted in severe neurodevelopmental disturbances in the fetus [2,3]. The American Academy of Sciences reported that annually over 60,000 children are born with neurological damage caused by mercury exposure during the fetal period [5]. In addition to neurotoxicity, it was reported that dietary intakes of fish and mercury increase the risk of acute myocardial infarction and death of cardiovascular disease. [6,7].
The shark is one of the top predators of marine ecosystems and is exposed to large amounts of heavy metals by bioaccumulation. Among them, mercury is a representative heavy metal that humans can be exposed to by shark ingestion [8,9]. South Korea is one of the largest importers of the shark meat and the world's 11th largest shark producer [10]. The North Gyeongsang province (Gyeongsangbuk-do), in particular, consumes a lot of shark meat in South Korea owing to the traditional custom called “Jesa,” a memorial ceremony performed periodically. Although the kind of food served in Jesa may vary by tradition, shark meat is considered as an essential offering in Gyeongsangbuk-do.
In a study that analyzed data from the Korean National Health and Nutrition Examination Survey, it was reported that the geometric mean of blood mercury concentration of residents in Gyeongsangbuk-do was above 7.0 µg/L [11]. This level is much higher than the overall average level of Korea as a whole (3.7 µg/L) and other countries (U.S.; 0.83 µg/L, Canada; 0.76 µg/L, German; 0.57 µg/L) [11,12,13,14]. U.S. Environmental Protection Agency (EPA) sets the standard level of blood mercury concentration at 5.8 µg/L [15]. The German Federal Environmental Agency recommends the human biomonitoring I (limit level with no harmful health effects and no action required) and human biomonitoring II (marginal concentration requiring exposure reduction measures and the medical surveillance) for blood mercury level at 5.0 µg/L and 15.0 µg/L, respectively [16,17]. According to the survey of the Korean National Institute of Environmental Research (NIER), among residents in the Gyeongsangbuk-do, the proportions of those with blood mercury level exceeds these standard levels were reported to be 30.2%, 39.1% and 3.8%, respectively [18]. Especially, it was reported that the blood mercury concentrations exceeded 15 µg/L in more than 70% of participants from Yeongcheon and Gunwi regions of Gyeongsangbuk-do [19]. It was thought that the dietary habit of periodic intake of shark meat in Gyeongsangbuk-do has mainly contributed to these result [11], and it was concluded that the shark meat consumption was the main contributing factor to mercury exposure [20].
Aforementioned findings emphasize that there needs to be further assessment on the risk of shark meat consumption, therefore, leading to the risk management. The first step to risk assessment should be hazard identification. Although there have been studies on mercury contents in shark meat distributed in some metropolitan cities and along offshore areas [21,22,23], none has been conducted to evaluate the mercury contents in shark meat sold in regions including the inland of Gyeongsangbuk-do, where unusually high blood mercury levels have been persistently reported. Thus, this study aims to identify the hazard by assessing the mercury contents of the shark meat circulating in the traditional market of Gyeongsangbuk-do.
METHODS
The shark meat in the form of muscle meat was obtained from the traditional markets in Gyeongsangbuk-do (Fig. 1) in 2013. In order to collect samples, the traditional markets of each city and county in Gyeongsangbuk-do were visited, and 1 sample was collected from each store selling shark meat. The collection periods of the samples were summer (July and August) and winter (January and February), which was little earlier than the Korean national holiday (Thanksgiving Day and New Year's Day). Because Jesa is held nationwide in the Korean national holidays, the sampling periods are considered to be the period when relatively many residents purchase shark meat. Out of 105 samples in total, 49 were collected in the summer and 56 in the winter. The samples were in frozen state without salting or cooking. Most of the samples were prepared in small cubes and kept frozen at −20°C until analyzed.
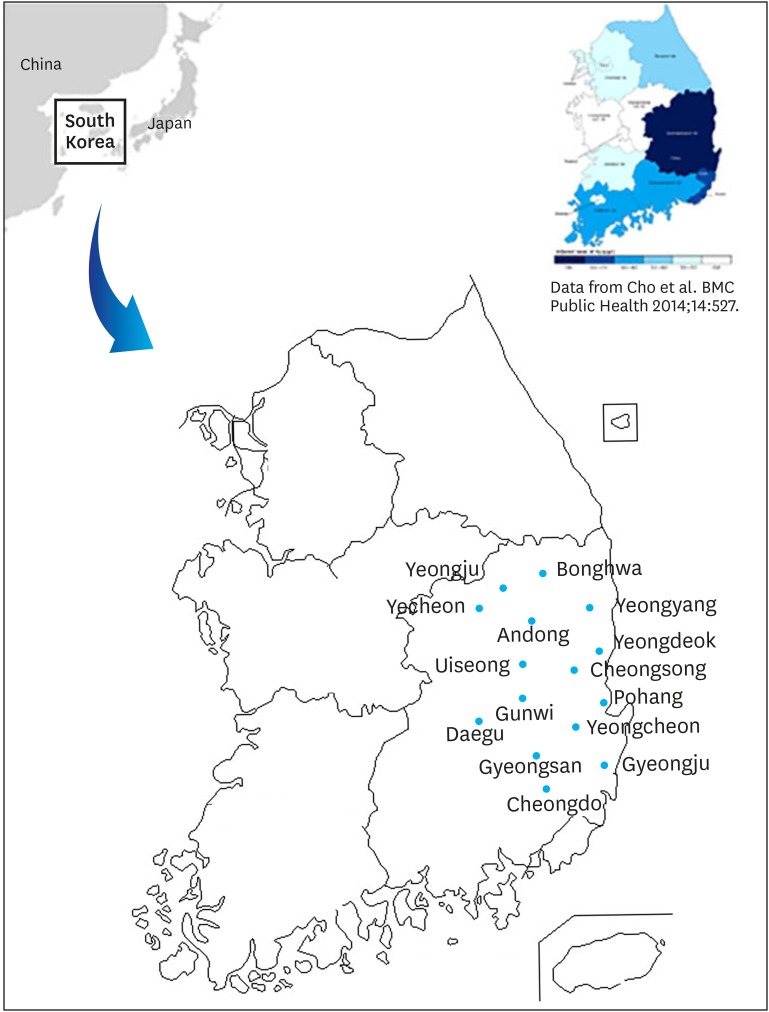
The blood mercury levels are exceptionally high in the survey area (Gyeongsangbuk-do) as shown in the right upper corner of the Fig. 1 [11].
Before analysis, the samples were thawed at room temperature. The total mercury concentration (both organic and inorganic) was analyzed by the combustion-gold amalgamation method using an automatic mercury analyzer (Milestone DMA-80, Milestone, Ontario, Canada). The mercury vaporized by heat was collected on a porous surface coated with gold and analyzed at a wavelength of 253.7 nm by atomic absorption spectroscopy.
MESS-3 was used as the reference material. The certification value was 91 ± 9.0 µg/kg, the measurement value was 95.5 ± 3.09 µg/kg, the recovery rate was 104%, the detection limit was 0.24 µg/kg, and the quantitative limit was 0.80 µg/kg. The procedures were repeated until the value of the absolute height of the calibration curve became < 0.003.
Statistical analysis was performed using a statistical software package (IBM SPSS Statistics Version 21.0, IBM Corp., Chicago, IL, USA). The mercury concentrations and their descriptive statistics were analyzed by region (market) and season of purchase. The independent-samples t-test was used to compare mercury concentrations of all samples between winter and summer. As the number of samples were small, a comparison of the mercury concentration in each region by season was performed using nonparametric statistics, the Mann-Whitney U test. Mercury concentrations in each season (summer and winter) by region were compared using the Kruskal-Wallis test. Differences in the distribution of mercury concentration by season were analyzed by Mann-Whitney U test. To compare mercury concentrations of shark meat with that of other studies, Welch modified t-test was performed using the R statistical package. A p-value below 0.05 was considered statistically significant.
RESULTS
The mercury concentration of 105 shark meat samples ranged from 0.06 to 8.93 µg/g. The arithmetic and geometric means of the mercury concentration were 2.29 ± 1.77 and 1.44 µg/g, respectively.
In the summer, mercury concentration of shark meat ranged from 0.09 to 8.93 µg/g. The arithmetic and geometric means of the mercury concentration were 2.21 ± 1.94 and 1.45 µg/g, respectively. The arithmetic (geometric) means of the mercury concentration are as follows in order of highest to lowest value by region: Yeongdeok was the highest with values of 6.00 ± 0.00 (6.00) µg/g, followed by 3.45 ± 0.00 (3.45) µg/g in Yecheon, 3.11 ± 2.14 (2.53) µg/g in Yeongcheon, 3.08 ± 1.98 (2.43) µg/g in Gunwi, and 2.65 ± 0.67 (2.58) µg/g in Bonghwa (Table 1).
Table 1
Summary of mercury concentration (µg/g) in shark meat sold in Gyeongsangbuk-do
In the winter, the mercury concentration of shark meat ranged from 0.06 to 6.73 µg/g. The arithmetic and geometric means of the mercury concentration were 2.35 ± 1.63 µg/g and 1.48 µg/g, respectively. The arithmetic (geometric) means of the mercury concentration are as follows in order of highest to lowest value by region: Yeongju was highest with values of 4.04 ± 2.34 (3.44) µg/g, followed by 3.94 ± 3.95 (2.77) µg/g in Yecheon, 3.41 ± 1.62 (3.16) µg/g in Yeongyang, 3.10 ± 1.92 (2.75) µg/g in Gyeongju, and 2.86 ± 0.55 (2.82) µg/g in Pohang (Table 1).
There was no statistically significant difference in the mercury concentration of shark meat according to the region in both summer (p = 0.057) and winter (p = 0.105).
The differences in the mercury concentration of all samples according to season was not statistically significant (p = 0.681). In each region, there was no statistically significant difference in the mercury concentration of shark meat according to the season (Table 1). Of the 105 samples analyzed, the mercury concentration in 77 samples (73.3%) exceeded 1 µg/g. The mercury concentration from 32 (65.3%) of 49 summer samples and 45 (80.4%) of 56 winter samples exceeded 1 µg/g. The difference in the distribution of mercury concentration of all samples according to the season was not statistically significant (Table 2).
Table 2
Distribution of mercury concentration in shark meat sold in Gyeongsangbuk-do
DISCUSSION
South Korea is the world's largest importer of the shark meat, importing an annual average of 20,656 tons. This figure is even greater than 14,237 and 11,525 tons of Spain and Italy, respectively [10]. They have a larger population than that of South Korea and shark meat is evenly consumed throughout the country. South Korea, on the other hand, has a smaller population and only a few regions, including Gyeongsangbuk-do, consume most of the shark meat. Therefore, it may be that Gyeongsangbuk-do is the world's largest consumer per capita in the world.
In countries other than South Korea, there have been various studies on mercury concentration in sharks. A study in the United States reported that the average mercury concentrations were 0.98 ± 0.63 µg/g for shark meat [24]. Another study in the United States reported similar mercury concentrations of 0.71 ± 0.68 µg/g [25]. In Japan, the mercury concentration was reported to be 0.78 ± 0.29 µg/g and 1.80 ± 0.45 µg/g for tiger shark and silvertip shark meat, respectively [26]. In Brazil, the mercury concentration of shark was 1.12 ± 0.57 µg/g in blue shark meat [27]. Mercury concentrations evaluated in blue shark and shortfin mako were 0.52 ± 0.35 µg/g and 0.74 ± 0.56 µg/g, respective, in Spain [28]. The mercury concentration of shark meat was 2.29 ± 1.77 µg/g in this study, which is higher than those of other countries (Table 3).
Table 3
Mercury concentration in shark meat compared to that of other studies
| Author | Year | Country | No. of samples | Mean ± standard deviation | Species | t | p-valuea |
|---|---|---|---|---|---|---|---|
| U.S. FDA [24] | 2017 | United States | 356 | 0.98 ± 0.63 | Sharkb | 7.4534 | < 0.001 |
| King et al. [25] | 2010 | United States | 5 | 0.71 ± 0.68 | Sharkb | 4.5415 | < 0.05 |
| Endo et al. [26] | 2008 | Japan | 42 | 0.78 ± 0.29 | Tiger shark | 8.4624 | < 0.001 |
| 8 | 1.80 ± 0.45 | Silvertip shark | 2.0865 | < 0.05 | |||
| de Carvalho et al. [27] | 2014 | Brazil | 27 | 1.12 ± 0.57 | Blue shark | 5.7178 | < 0.001 |
| Biton-Porsmoguer et al. [28] | 2018 | Spain | 40 | 0.52 ± 0.35 | Blue shark | 9.7584 | < 0.001 |
| 48 | 0.74 ± 0.56 | Shortfin mako | 8.1275 | < 0.001 |
The U.S. Food and Drug Administration (FDA) and the European Union (EU) is proposing a methylmercury level of 1 µg/g as the standard mercury level in predatory fish species like shark [29,30]. Since the total mercury (both organic and inorganic mercury) concentration was measured instead of the methylmercury concentration, it is not easy to apply the U.S. FDA and the EU's criteria directly. However, the U.S. EPA stated in 2001 that 90%–100% of total mercury is present as methylmercury in the shark [31]. Further, in the 105 shark meat samples collected in this study, the total mercury concentration in 77 samples exceeded 1 µg/g. This suggests that the methylmercury content in much of the shark meat being sold at traditional market exceeds the level recommended by the U.S. FDA and the EU.
The Korean Ministry of Food and Drug Safety (MFDS) has set a limit of 1.0 µg/g for the methylmercury concentration in tuna, billfish, and deep-sea fish, which is the same level as recommended by the Codex Alimentarius Commission and the U.S. FDA. In general, the mercury concentration in fish is estimated in the wet meat state [32,33]. In Gyeongsangbuk-do, shark meat is stored in a frozen state after being salted or not, and then it is taken in the form of a steamed or roasted dish or soup after thawing [34]. Therefore, because the water content of the shark meat is reduced by the salting and cooking process, the methylmercury concentration of shark meat can be higher than it is in the wet state [31,35]. Since the samples analyzed in this study were uncooked shark meat, the mercury concentration in shark meat actually consumed by residents can be higher than this study.
Although the half-life of methylmercury in the human body varies from person to person, ranging from 35 to 189 days, it has been reported to be 72 days on average [36]. Every year, most families in Gyeongsangbuk-do serve Jesa on multiple occasions such as on Thanksgiving Day and New Year's Day. Those who serve 5 Jesa a year will ingest shark meat approximately once every half-life and are at a high risk that their blood methylmercury concentrations could stay at a persistently elevated level [18,37]. In addition to Jesa, shark meat may also be served at wedding ceremonies or at funerals as one of the dishes for guests in Gyeongsangbuk-do.
In addition to the standards for methylmercury in fish and shellfish, many countries and international organizations have established limits for human consumption of methylmercury. The Joint Food and Agriculture Organization (FAO)/World Health Organization (WHO) Expert Committee on Food Additives set the provisional tolerable weekly intake (PTWI) of methylmercury by 1.6 µg/kg body weight per week [38], and European Food Safety Authority also propose the PTWI of methylmercury by 1.3 µg/kg body weight per week [39]. In South Korea, the weekly intake limit of methylmercury is established at 2.0 µg/kg body weight per week [40], and MFDS recommends that ingestion of shark, swordfish, and tuna should be less than 100 µg/week for pregnant or lactating women and all women of childbearing age [33].
According to the survey of NIER in 2011, 59.8% of residents in Gyeongsangbuk-do consumed shark meat and 20.4% of them consumed more than 50 g of shark meat per intake [18]. Considering that the average mercury concentration in shark meat is 2.29 µg/g, if a 60-kg adult consumed 50 g of shark meat, total mercury intake would be approximately 1.9 µg/kg of body weight. As most of the mercury in fish and shellfish is present as methylmercury, there is a risk of exceeding PTWI of methylmercury recommended by various organizations, even if shark meat is consumed only once on Jesa. It is more alarming for young children because people consume shark meat regardless of the age and sex during Jesa. In addition, consuming a MFDS-recommended 100 g of shark meat a week would result in a mercury intake of 3.8 µg/kg body weight for women of childbearing age, and it already exceeds PTWI of methylmercury in South Korea. Therefore, our work suggests that it is necessary to revise the recommended intake of shark meat.
This study confirmed that the shark meat, considered a major source of mercury exposure for residents in Gyeongsangbuk-do, contains a substantial amount of mercury. Further studies need to determine the dose-response relationship between shark meat intake and blood mercury concentration, and calculate the contribution degree of shark meat intake to blood mercury level. The health effects of high level of mercury exposure from shark meat intake should also be studied.
CONCLUSIONS
This study revealed that the residents of Gyeongsangbuk-do irrespective of age and genders have been exposed to substantially higher levels of mercury by shark meat intake. This suggests that it is difficult to reduce mercury intake by simply strengthening the standard level of mercury concentration in shark meat. Therefore, it is needed to examine methylmercury level by authorized authority before it is distributed to local markets, and greater awareness programs be initiated to consumers about the hazardous effects of methylmercury inherent in shark meat. Further studies should investigate the health effect of higher level of methylmercury on consumer through shark meat intake.
Abbreviations
EPA
Environmental Protection Agency
EU
European Union
FAO
Food and Agriculture Organization
FDA
Food and Drug Administration
MFDS
Ministry of Food and Drug Safety
NIER
National Institute of Environmental Research
PTWI
provisional tolerable weekly intake
WHO
World Health Organization
-
Funding: This work was supported by the 2019 Yeungnam University Research Grants.
-
Competing interests: The authors declare that they have no competing interests.
-
Availability of data and materials: The datasets generated in the study are available from the authors upon reasonable request.
-
Authors contributions:
NOTES
- 1. Myers GJ, Davidson PW, Shamlaye CF, Axtell CD, Cernichiari E, Choisy O, et al. Effects of prenatal methylmercury exposure from a high fish diet on developmental milestones in the Seychelles Child Development Study. Neurotoxicology 1997;18(3):819–829. 9339828.PubMed
- 2. Grandjean P, Weihe P, White RF, Debes F, Araki S, Yokoyama K, et al. Cognitive deficit in 7-year-old children with prenatal exposure to methylmercury. Neurotoxicol Teratol 1997;19(6):417–428. 9392777.ArticlePubMed
- 3. Harada M. Minamata disease: methylmercury poisoning in Japan caused by environmental pollution. Crit Rev Toxicol 1995;25(1):1–24. 7734058.ArticlePubMed
- 4. Galster WA. Mercury in Alaskan Eskimo mothers and infants. Environ Health Perspect 1976;15:135–140. 1033830.ArticlePubMedPMC
- 5. The National Academies of Sciences, Engineering, and Medicine (NASEM). EPA's methylmercury guideline is scientifically justifiable for protecting most Americans, but some may be at risk. 2000;Accessed 24 Dec 2018]. http://www8.nationalacademies.org/onpinews/newsitem.aspx?RecordID=9899.
- 6. Salonen JT, Seppänen K, Nyyssönen K, Korpela H, Kauhanen J, Kantola M, et al. Intake of mercury from fish, lipid peroxidation, and the risk of myocardial infarction and coronary, cardiovascular, and any death in eastern Finnish men. Circulation 1995;91(3):645–655. 7828289.ArticlePubMed
- 7. Virtanen JK, Voutilainen S, Rissanen TH, Mursu J, Tuomainen TP, Korhonen MJ, et al. Mercury, fish oils, and risk of acute coronary events and cardiovascular disease, coronary heart disease, and all-cause mortality in men in eastern Finland. Arterioscler Thromb Vasc Biol 2005;25(1):228–233. 15539625.ArticlePubMed
- 8. Adel M, Oliveri Conti G, Dadar M, Mahjoub M, Copat C, Ferrante M. Heavy metal concentrations in edible muscle of whitecheek shark, Carcharhinus dussumieri (elasmobranchii, chondrichthyes) from the Persian Gulf: a food safety issue. Food Chem Toxicol 2016;97:135–140. 27593900.ArticlePubMed
- 9. Lopez SA, Abarca NL, Meléndez RC. Heavy metal concentrations of two highly migratory sharks (Prionace glauca and Isurus oxyrinchus) in the southeastern Pacific waters: comments on public health and conservation. Trop Conserv Sci 2013;6(1):126–137.ArticlePDF
- 10. Dent F, Clarke S. State of the global market for shark products. FAO Fish Aquac Tech Pap 2015;(590):1–187.
- 11. Cho S, Jacobs DR Jr, Park K. Population correlates of circulating mercury levels in Korean adults: the Korea National Health and Nutrition Examination Survey IV. BMC Public Health 2014;14(1):527. 24884916.ArticlePubMedPMCPDF
- 12. Caldwell KL, Mortensen ME, Jones RL, Caudill SP, Osterloh JD. Total blood mercury concentrations in the U.S. population: 1999–2006. Int J Hyg Environ Health 2009;212(6):588–598. 19481974.ArticlePubMed
- 13. Wong SL, Lye EJ. Lead, mercury and cadmium levels in Canadians. Health Rep 2008;19(4):31–36.
- 14. Becker K, Kaus S, Krause C, Lepom P, Schulz C, Seiwert M, et al. German Environmental Survey 1998 (GerES III): environmental pollutants in blood of the German population. Int J Hyg Environ Health 2002;205(4):297–308. 12068749.ArticlePubMed
- 15. U.S. Environmental Protection Agency (EPA). Mercury-EPA Archives. Organic mercury: TEACH chemical summary; Accessed 25 Oct 2019]. https://archive.epa.gov/region5/teach/web/pdf/mercury_org_summary.pdf.
- 16. Umweltbundesamt (UBA). Reference and HBM values. 2015;Accessed 25 Oct 2019]. https://www.umweltbundesamt.de/en/topics/health/commissions-working-groups/human-biomonitoring-commission/reference-hbm-values.
- 17. Umweltbundesamt (UBA). Human-Biomonitoring (HBM) values, derived by the Human Biomonitoring Commission of the German Environment Agency, date February 2017. 2017;Accessed 25 Oct 2019]. https://www.umweltbundesamt.de/sites/default/files/medien/355/bilder/dateien/hbm-werte_engl_stand_2017_02_06_2.pdf.
- 18. National Institute of Environmental Research (NIER). Assessment of mercury exposure and health in Daegu and Gyeongsangbuk-do (I). 2011;Accessed 24 Dec 2018]. http://webbook.me.go.kr/DLi-File/NIER/06/013/5515056.pdf.
- 19. National Institute of Environmental Research (NIER). A survey on hazardous materials in human biological matrix (II). 2008;Accessed 24 Dec 2018]. http://www.prism.go.kr/homepage/researchCommon/downloadResearchAttachFile.do;jsessionid=203F173A037D3C1CA2764604D453286E.node02?work_key=002&file_type=CPR&seq_no=001&pdf_conv_yn=N&research_id=1480000-200900228.
- 20. National Institute of Environmental Research (NIER). Research on exposure and health effect of mercury in Young-Nam area (II). 2011;Accessed 24 Dec 2018]. http://webbook.me.go.kr/DLi-File/NIER/06/013/5515049.pdf.
- 21. Kim SC, Jang JW, Kim HA, Lee SH, Jung YJ, Kim JY, et al. Monitoring methylmercury in abyssal fish. Korean J Food Sci Technol 2010;42(4):383–389.
- 22. Kim JA, Yuk DH, Park YA, Choi HJ, Kim YC, Kim MS. A study on total mercury and methylmercury in commercial tuna, billfish, and deep-sea fish in Seoul metropolitan city. Korean J Food Sci Technol 2013;45(3):376–381.Article
- 23. Kim SJ, Lee HK, Badejo AC, Lee WC, Moon HB. Species-specific accumulation of methyl and total mercury in sharks from offshore and coastal waters of Korea. Mar Pollut Bull 2016;102(1):210–215. 26614695.ArticlePubMed
- 24. U.S. Food and Drug Administration (FDA). Mercury levels in commercial fish and shellfish (1990–2012). 2017;Accessed 24 Dec 2018]. https://www.fda.gov/food/foodborneillnesscontaminants/metals/ucm115644.htm.
- 25. King TJ, Sheridan RS, Rice DH. Analysis of toxic metals in seafood sold in New York state by inductively coupled plasma mass spectrometry and direct combustion analysis. J Food Prot 2010;73(9):1715–1720. 20828482.ArticlePubMedPDF
- 26. Endo T, Hisamichi Y, Haraguchi K, Kato Y, Ohta C, Koga N. Hg, Zn and Cu levels in the muscle and liver of tiger sharks (Galeocerdo cuvier) from the coast of Ishigaki Island, Japan: relationship between metal concentrations and body length. Mar Pollut Bull 2008;56(10):1774–1780. 18656211.ArticlePubMed
- 27. de Carvalho GG, Degaspari IA, Branco V, Canário J, de Amorim AF, Kennedy VH, et al. Assessment of total and organic mercury levels in blue sharks (Prionace glauca) from the south and southeastern Brazilian coast. Biol Trace Elem Res 2014;159(1-3):128–134. 24801656.ArticlePubMedPDF
- 28. Biton-Porsmoguer S, Bǎnaru D, Boudouresque CF, Dekeyser I, Bouchoucha M, Marco-Miralles F, et al. Mercury in blue shark (Prionace glauca) and shortfin mako (Isurus oxyrinchus) from north-eastern Atlantic: Implication for fishery management. Mar Pollut Bull 2018;127:131–138. 29475644.ArticlePubMed
- 29. U.S. Food and Drug Administration (FDA). Mercury and fish: the facts. 2016;Accessed 28 Nov 2019]. http://mercuryfactsandfish.org/mercury-facts/the-fda-action-level/.
- 30. Burger J, Gochfeld M. Heavy metals in commercial fish in New Jersey. Environ Res 2005;99(3):403–412. 16307983.ArticlePubMed
- 31. U.S. Environmental Protection Agency (EPA). Mercury update: impact on fish advisories. 2001;Accessed 24 Dec 2018]. https://nepis.epa.gov/Exe/tiff2png.cgi/P1000QD9.PNG?-r+75+-g+7+D%3A%5CZYFILES%5CINDEX%20DATA%5C00THRU05%5CTIFF%5C00001126%5CP1000QD9.TIF.
- 32. Agency for Toxic Substances and Disease Registry (ATSDR). Toxicological profile for mercury. 1999;Accessed 24 Dec 2018]. https://www.atsdr.cdc.gov/toxprofiles/tp46.pdf.
- 33. Ministry of Food and Drug Safety (MFDS). Recommendation on fish consumption. 2017;Accessed 24 Dec 2018]. http://www.mothersafe.or.kr/wp-content/uploads/2018/03/%EC%83%9D%EC%84%A0%EC%95%88%EC%A0%84%EC%84%AD%EC%B7%A8%EA%B0%80%EC%9D%B4%EB%93%9CMFDS-1.pdf.
- 34. Park HJ, Park LY, Yoon KS, Lee SH. Quality characteristics of smoked Dombaeki (shark meat). Korean J Food Preserv 2010;17(4):471–477.
- 35. Perelló G, Martí-Cid R, Llobet JM, Domingo JL. Effects of various cooking processes on the concentrations of arsenic, cadmium, mercury, and lead in foods. J Agric Food Chem 2008;56(23):11262–11269. 18986150.ArticlePubMed
- 36. Al-Shahristani H, Shihab KM. Variation of biological half-life of methylmercury in man. Arch Environ Health 1974;28(6):342–344. 4829091.ArticlePubMed
- 37. Park GI, Byun YS, Joong Jeon M, Sakong J. The associations between blood mercury levels and shark meat intake among workers in Gyeongsangbuk-do. Ann Occup Environ Med 2017;29(1):29. 28670459.ArticlePubMedPMCPDF
- 38. Joint FAO/WHO Expert Committee on Food Additives (JECFA). Summary report of the seventy-second meeting of JECFA. 2010;Accessed 24 Dec 2018]. https://www.who.int/foodsafety/chem/summary72_rev.pdf.
- 39. EFSA Panel on Contaminants in the Food Chain. Scientific opinion on the risk for public health related to the presence of mercury and methylmercury in food. EFSA J 2012;10(12):2985.ArticlePDF
- 40. Ministry of Food and Drug Safety (MFDS). Study of the establishment of health-based guidance values for food contaminants (II). 2013;Accessed 24 Dec 2018]. http://www.ndsl.kr/ndsl/commons/util/ndslOriginalView.do?dbt=TRKO&cn=TRKO201400011688&rn=&url=&pageCode=PG18.
REFERENCES
REFERENCES
Figure & Data
REFERENCES
Citations
Citations to this article as recorded by 
- Toxic mercury (Hg) contamination or accumulation in seafood species (fish, crustaceans and molluscs): Global analysis and synthesis
Golam Kibria
Estuarine, Coastal and Shelf Science.2026; 340: 109962. CrossRef - Assessment of heavy metals concentration and health risk in four species of Persian Gulf sharks in Hormozgan Province
Hassan heidarieh, Amin Gholamhosseini, Siyavash Soltanian, Marzieh Heidarieh, Mahdi Banaee, Nima Shiry
Journal of Trace Elements in Medicine and Biology.2025; 87: 127581. CrossRef - Monitoring of Cadmium, Lead, and Mercury Levels in Seafood Products: A Ten-Year Analysis
Luisa Garofalo, Marcello Sala, Claudia Focardi, Patrizio Pasqualetti, Daniela Delfino, Francesca D’Onofrio, Barbara Droghei, Francesca Pasquali, Valentina Nicolini, Flavia Silvia Galli, Paola Scaramozzino, Alessandro Ubaldi, Katia Russo, Bruno Neri
Foods.2025; 14(3): 451. CrossRef - Metallic Makos: Metal and Metalloid Levels and Human Health Risks Arising from the Consumption of Shortfin Makos (Isurus oxyrinchus) from Southeastern Brazil
Júlia Vianna de Pinho, Isabel Quental Willmer, Amanda Pontes Lopes, Regina Fonsêca, Tatiana Dillenburg Saint’Pierre, Patricia Charvet, Acácio Ribeiro Gomes Tomas, Rachel Ann Hauser-Davis
Biological Trace Element Research.2025; 203(10): 5401. CrossRef - Analysis of shark meat consumption patterns among young and middle-aged women in Gyeongsangbuk-do, South Korea, using community health survey data
Soyoung Son, Junmin Seong, Chulyong Park, Kiook Baek, Joon Sakong
Annals of Occupational and Environmental Medicine.2025; 37: e26. CrossRef - Association of Blood Mercury Level with Liver Enzymes in Korean Adults: An Analysis of 2015–2017 Korean National Environmental Health Survey
Jin-Wook Chung, Dilaram Acharya, Jitendra Kumar Singh, Joon Sakong
International Journal of Environmental Research and Public Health.2023; 20(4): 3290. CrossRef - Increase of blood mercury level with shark meat consumption: A repeated-measures study before and after Chuseok, Korean holiday
Kiook Baek, Chulyong Park, Joon Sakong
Chemosphere.2023; 344: 140317. CrossRef - Mercury cycling in Australian estuaries and near shore coastal ecosystems: Triggers for management
William Maher, Frank Krikowa, Michael Ellwood, Detlev Helmig, Ruoyu Sun
Elementa: Science of the Anthropocene.2020;[Epub] CrossRef
 Cite
CiteMercury concentration in shark meat from traditional markets of Gyeongsangbuk-do, South Korea

Fig. 1 Sample survey area [11].
Fig. 1
Mercury concentration in shark meat from traditional markets of Gyeongsangbuk-do, South Korea
| Region | No. of samples | Season | Mean ± standard deviation | Geometric mean | Minimum | Maximum | p-valuea |
|---|---|---|---|---|---|---|---|
| Daegu | 3 | Summer | 2.51 ± 2.76 | 1.41 | 0.31 | 5.60 | 1.00 |
| 3 | Winter | 1.38 ± 0.72 | 1.24 | 0.68 | 2.11 | ||
| Gyeongsan | 3 | Summer | 1.31 ± 0.74 | 1.15 | 0.54 | 2.02 | 0.20 |
| 3 | Winter | 0.35 ± 0.23 | 0.30 | 0.17 | 0.61 | ||
| Gyeongju | 2 | Summer | 2.58 ± 0.95 | 2.48 | 1.90 | 3.25 | 1.00 |
| 3 | Winter | 3.10 ± 1.92 | 2.75 | 1.70 | 5.28 | ||
| Gunwi | 3 | Summer | 3.08 ± 1.98 | 2.43 | 0.81 | 4.45 | 0.70 |
| 3 | Winter | 1.53 ± 0.53 | 1.46 | 0.94 | 1.95 | ||
| Bonghwa | 2 | Summer | 2.65 ± 0.67 | 2.58 | 2.13 | 3.13 | 0.80 |
| 3 | Winter | 2.82 ± 1.73 | 2.52 | 1.69 | 4.81 | ||
| Andong | 3 | Summer | 0.34 ± 0.37 | 0.22 | 0.09 | 0.76 | 0.10 |
| 3 | Winter | 1.96 ± 0.65 | 1.89 | 1.53 | 2.71 | ||
| Yeongdeok | 1 | Summer | 6.00 ± 0.00 | 6.00 | 6.00 | 6.00 | 0.40 |
| 4 | Winter | 2.30 ± 0.42 | 2.27 | 1.75 | 2.77 | ||
| Yeongyang | 3 | Summer | 2.09 ± 2.09 | 1.04 | 0.14 | 4.29 | 0.40 |
| 3 | Winter | 3.41 ± 1.62 | 3.16 | 1.99 | 5.17 | ||
| Yeongju | 2 | Summer | 1.11 ± 0.34 | 1.08 | 0.87 | 1.35 | 0.20 |
| 3 | Winter | 4.04 ± 2.34 | 3.44 | 1.45 | 6.01 | ||
| Yeongcheon | 15 | Summer | 3.11 ± 2.14 | 2.53 | 0.63 | 8.93 | 0.713 |
| 15 | Winter | 2.65 ± 1.64 | 1.78 | 0.06 | 5.63 | ||
| Yecheon | 1 | Summer | 3.45 ± 0.00 | 3.45 | 3.45 | 3.45 | 1.00 |
| 2 | Winter | 3.94 ± 3.95 | 2.77 | 1.14 | 6.73 | ||
| Uiseong | 2 | Summer | 0.76 ± 0.86 | 0.45 | 0.15 | 1.37 | 0.333 |
| 2 | Winter | 2.10 ± 0.47 | 2.07 | 1.76 | 2.43 | ||
| Cheongdo | 3 | Summer | 0.12 ± 0.05 | 0.12 | 0.09 | 0.18 | 0.40 |
| 3 | Winter | 0.23 ± 0.16 | 0.19 | 0.09 | 0.40 | ||
| Cheongsong | 3 | Summer | 1.94 ± 1.98 | 1.23 | 0.34 | 4.15 | 1.00 |
| 3 | Winter | 1.91 ± 1.79 | 1.18 | 0.26 | 3.82 | ||
| Pohang | 3 | Summer | 1.29 ± 1.76 | 0.53 | 0.10 | 3.31 | 0.40 |
| 3 | Winter | 2.86 ± 0.55 | 2.82 | 2.28 | 3.37 | ||
| Total | 49 | Summer | 2.21 ± 1.94 | 1.45 | 0.09 | 8.93 | 0.681 |
| 56 | Winter | 2.35 ± 1.63 | 1.48 | 0.06 | 6.73 | ||
| 105 | 2.29 ± 1.77 | 1.44 | 0.06 | 8.93 |
| Mercury concentration (µg/g) | Summer | Winter | Total | p-valuea |
|---|---|---|---|---|
| < 0.50 | 11 (22.4) | 8 (14.3) | 19 (18.1) | 0.203 |
| 0.50–0.99 | 6 (12.2) | 3 (5.4) | 9 (8.6) | 0.182 |
| 1.00–1.49 | 4 (8.2) | 5 (8.9) | 9 (8.6) | 0.585 |
| 1.50–1.99 | 7 (14.3) | 13 (23.2) | 20 (19.0) | 0.181 |
| 2.00–2.49 | 4 (8.2) | 6 (10.7) | 10 (9.5) | 0.459 |
| 2.50–2.99 | 1 (2.0) | 6 (10.7) | 7 (6.7) | 0.080 |
| 3.00–3.49 | 5 (10.2) | 3 (5.4) | 8 (7.6) | 0.286 |
| 3.50–3.99 | 2 (4.1) | 3 (5.4) | 5 (4.8) | 0.564 |
| 4.00–4.49 | 3 (6.1) | 1 (1.8) | 4 (3.8) | 0.260 |
| 4.50–4.99 | 2 (4.1) | 3 (5.4) | 5 (4.8) | 0.564 |
| ≥ 5.00 | 4 (8.2) | 5 (8.9) | 9 (8.6) | 0.585 |
| Total | 49 (100.0) | 56 (100.0) | 105 (100.0) |
| Author | Year | Country | No. of samples | Mean ± standard deviation | Species | t | p-valuea |
|---|---|---|---|---|---|---|---|
| U.S. FDA [ | 2017 | United States | 356 | 0.98 ± 0.63 | Sharkb | 7.4534 | < 0.001 |
| King et al. [ | 2010 | United States | 5 | 0.71 ± 0.68 | Sharkb | 4.5415 | < 0.05 |
| Endo et al. [ | 2008 | Japan | 42 | 0.78 ± 0.29 | Tiger shark | 8.4624 | < 0.001 |
| 8 | 1.80 ± 0.45 | Silvertip shark | 2.0865 | < 0.05 | |||
| de Carvalho et al. [ | 2014 | Brazil | 27 | 1.12 ± 0.57 | Blue shark | 5.7178 | < 0.001 |
| Biton-Porsmoguer et al. [ | 2018 | Spain | 40 | 0.52 ± 0.35 | Blue shark | 9.7584 | < 0.001 |
| 48 | 0.74 ± 0.56 | Shortfin mako | 8.1275 | < 0.001 |
Table 1 Summary of mercury concentration (µg/g) in shark meat sold in Gyeongsangbuk-do
aMann-Whitney U test or independent-samples t-test.
Table 2 Distribution of mercury concentration in shark meat sold in Gyeongsangbuk-do
Data shown are number of samples (%).
aMann-Whitney U test.
Table 3 Mercury concentration in shark meat compared to that of other studies
Values were compared to 2.29 ± 1.77 µg/g from 105 samples of this study.
FDA: Food and Drug Administration.
aWelch modified t-test; botherwise unspecified.

