
Articles
- Page Path
- HOME > Ann Occup Environ Med > Volume 32; 2020 > Article
- Research Article Association between change in working time arrangements and sleep disturbance
-
Ryun Ha1
 , Jae Bum Park1,2, Kyung-Jong Lee1,2, Sunguk Choi1, Inchul Jeong1,2
 -
Annals of Occupational and Environmental Medicine 2020;32:e18.
DOI: https://doi.org/10.35371/aoem.2020.32.e18
Published online: June 18, 2020
1Department of Occupational and Environmental Medicine, Ajou University Hospital, Suwon, Korea.
2Department of Occupational and Environmental Medicine, Ajou University School of Medicine, Suwon, Korea.
- Correspondence: Inchul Jeong. Department of Occupational and Environmental Medicine, Ajou University School of Medicine, 164 World cup-ro, Yeongtong-gu, Suwon 16499, Korea. icjeong0101@aumc.ac.kr
• Received: February 26, 2020 • Accepted: June 4, 2020
Copyright © 2020 Korean Society of Occupational & Environmental Medicine
This is an Open Access article distributed under the terms of the Creative Commons Attribution Non-Commercial License (https://creativecommons.org/licenses/by-nc/4.0/) which permits unrestricted non-commercial use, distribution, and reproduction in any medium, provided the original work is properly cited.
Abstract
-
Background Change in working time arrangement (WTA) can be harmful to workers' sleep and health. This study aimed to investigate the association between change in working time arrangement and sleep disturbance.
-
Methods This study used data from the Fifth Korean Working Condition Survey and included 33,203 paid workers. We performed a stratified analysis by sex. After dividing the participants into 6 groups based on whether or not they experienced WTA changes, and their weekly working hours (≤40, 41–52, ≥53 hours), we calculated odds ratio (OR) using the weekly working hours ≤40 hours and with no WTA change as the reference group.
-
Results Of the 33,203 paid workers, participants who experienced change in working time arrangement had higher prevalence of all three types of sleep disturbance symptoms (difficulty in falling asleep, waking up repeatedly during sleep, and waking up with a feeling of exhaustion and fatigue) in both sexes. Compared to the reference group at 95% confidence interval (CI), the group with change in WTA showed elevated OR values of 1.91 (95% CI: 1.73–2.11), 1.93 (95% CI: 1.74–2.14), 2.47 (95% CI: 2.26–2.71) for male workers; and 1.93 (95% CI: 1.73–2.16), 2.02 (95% CI: 1.80–2.27), 2.24 (95% CI: 2.01–2.50) for female workers, for difficulty in falling asleep, waking up repeatedly during the sleep, waking up with a feeling of exhaustion, and fatigue, respectively.
-
Conclusions Workers who experience change in work time arrangement show a high risk of sleep disturbance in both sexes.
BACKGROUND
According to the International Labor Organization (ILO), the 2 dimensions of working time arrangements (WTAs) are volume and schedule. The volume of working time refers to the total amount of working time and is generally evaluated as the working time per week. Work schedules, on the other hand, can be divided into when to work and type of flexibility; first, when to work is a measure of how work time is distributed, such as daytime/evening/ night, weekend, and shift work. Second, type of flexibility can be broadly divided into fixed hours (working time/schedule does not change), employer-led flexibility (working time/schedule can change according to the company's needs as well as demands), and worker-led flexibility, in which working time/schedule can be adjusted according to the worker's needs [1].
There have been numerous studies on the effects of long working hours on health (depression, sleep and anxiety disorders as well as cardiovascular diseases including stroke [2,3]); and policies are in place to restrict long working hours (i.e. 40 to 48-hour limit globally and 52-hour limit in Korea) [4]. In the schedule dimension of WTA, with regard to when to work, there have been studies on the relationships of evening/night, weekend, and shift work with cardiovascular diseases breast cancer, depression, sleep, and gastrointestinal disorders [5]. Moreover, protective policies are being implemented, such as compensation (replacement holidays or bonus pay) or early screening (specialized examinations) for workers.
In terms of flexibility, it is known that worker-led flexibility not only increases work satisfaction and reduces work-family conflict (WFC), but also reduces days off and disability associated with musculoskeletal and psychiatric illness. In addition, it acts as a buffer to the negative effects of long working hours or shift work [6,7,8]. As a result, flexible working arrangements (alternative work schedule, flextime work, selective working-hour system, discretionary work, remote work, working from home) are becoming more common. On the other hand, studies on the health effects of employer-led flexibility have been restricted to workers on-call [9], quick returns [10], or have been too broad, such as studies on nonstandard working schedules (including shift work [6 pm–6 am], extended working hours [>8 hours], extended working days [>5 days], call duties, and weekend work) [5].
Therefore, in WTA, country/group's specific characteristics need to be considered [11]. Adherence to flexible working arrangements in South Korea is lower than that in other European countries because majority of workers are subject to fixed hours determined by the company or employer-led flexibility, and changes to the working schedule are often declared unilaterally due to a shortage of replacement labor [12]. According to Karasek's job-strain model, this loss of control over time has negative mental/psychological effects due to increased occupational stress [13]. However, there are no investigations on the health effects of changes in WTA, given that sleep disorders are associated with psychiatric illness, industrial accidents, cardiovascular diseases, as well as mortality [14,15,16,17]. Therefore, there is need for research in this area. This study aimed to investigate the effects of changes in WTA on sleep disorders. In addition, we aimed to investigate whether the effects of WTA changes on sleep disturbance differ according to sex.
METHODS
This study used data from the 5th Korean Working Conditions Survey (KWCS), conducted by the Korean Occupational Safety and Health Research Institute (OSHRI) in 2017. Based on the European Working Conditions Survey (EWCS) and the UK Labor Force Survey (LFS), the KWCS was designed to ascertain the overall work environment, including labor type, employment type, occupation type, industry, and risk factors. Using multistage systematic cluster sampling, trained research assistants were employed for data collection, they interviewed 50,205 employed individuals aged 15 years or older, extracted from across the country using multistage systematic cluster sampling. The survey data were weighted with reference to the economically active population of Korea to obtain estimates of parameters for the entire economically active population. This weighting procedure first obtained the design weights (sampling weights) to account for sample selection, and then adjusted the weights so that the estimates coincided with the known totals for the population.
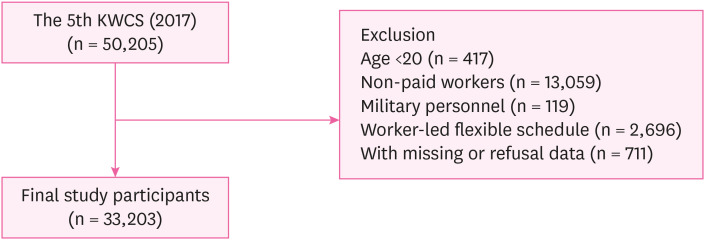
Of the 50, 205 participants in the 5th KWCS, we studied paid workers aged 20 years or older. Age <20 (417 participants), Self-employed without employees, self-employed/employers of labor, unpaid family workers, and other workers (13,059 participants) were excluded. Military personnel (119 participants) were excluded from the study as well as workers with a worker-led flexible schedule (2,696 participants), whose response to the question “How are your time arrangements set?” was “You can adapt your working hours within certain limits” or “Your working hours are entirely determined by yourself,” were excluded. This is because we were unable to verify whether there had actually been any changes in their work schedule. In addition, those who did not respond to any of the questions about the variables used in this study or did not answer or refused to answer (711 participants) were excluded from this study. The final analysis included 33,203 workers (18,964 male and 14,239 female). A schematic diagram of the study participants is shown in Fig. 1.
Change in working time arrangement
The change in WTA means change of the working schedule or volume of working time. It includes change of start/end time of the work, or amount of working time. We defined “Change in working time arrangement” as “Yes response” to the following question: “Do changes to your working time arrangements occur regularly? (If yes) How long before are you informed about these changes?” The possible answers were: “No”, “Yes, the same day”, “Yes, the day before”, “Yes, several days in advance”, “Yes, several weeks in advance”.
Sleep disturbance
In the symptoms of sleep disturbance section, the response to “How often did you have any of the following sleep related problems?” which included the options of “Difficulty falling asleep,” “Repeatedly waking during sleep,” and “Waking up with a feeling of exhaustion and fatigue,” the response options for all 3 types of sleep disturbances were “Daily,” “Once a week,” “Several times a month,” “Rarely,” and “Never.” “Daily,” “Once a week,” and “Several times a month” responses were regrouped as “Yes”; “Rarely” and “Never” responses were regrouped as “No.”
Covariates
The participants' general and occupational factors were selected as covariates. General factors included sex, age, education level, marital status, and monthly earning. Participants were categorized based on age into range of 20–29 years, 30–39 years, 40–49 years, 50–59 years, and ≥60 years, while based on education level as high school graduation or less and college or above. Based on monthly earning participants were categorized into <2 million KRW, 2–2.99 million KRW, and ≥3 million KRW. Occupational factors included occupation, employment status, and size of workplace, shift work, as well as weekly working hours. Participants were categorized based on the Korean Standard Classification of Occupations, into the three groups of white-collar, pink-collar, and blue-collar jobs. Administrators, professionals and related workers, as well as clerks were classified as white-collar while services and sales workers were classified as pink-collar, and trained agriculturists, foresters, fishery workers, artisans, equipment/machine operating and assembling workers, as well as simple laborers were classified as blue-collar. Additionally, based on employment status participants were categorized into 2 groups, regular employees, and temporary/part-time employees. Size of workplace was defined in terms of the current number of employees at the participant's workplace, and participants were categorized into <10 persons, 10–299 persons, and ≥300 persons. Shift work was determined based on the item “I work shifts,” and participants answered “Yes” or “No.” In addition, based on weekly working hours participants were categorized into ≤40, 41–52, and ≥53 hours.
Survey sample weights were used in all analysis to produce appropriate estimates and standard errors. χ2 tests were performed to compare the relationship between WTA change and symptoms of sleep disturbance according to the participants' sex, and a logistic regression analysis was performed to estimate the odds ratios (OR) at 95% confidence intervals (CIs) for sleep disturbance symptoms depending on WTA change. These OR was adjusted for age, marital status, education level, occupation, employment status, shift work, size of workplace, and monthly earning. Because there may be sex differences in the effects of WTA change on the risk of sleep disorders, we performed a stratified analysis. After dividing the participants into 6 total groups based on whether or not they experienced WTA changes and their weekly working hours (≤40, 41–52, ≥53 hours), we calculated OR using subjects without WTA change and weekly working hours ≤40 as the reference. Also, p for trend analysis was conducted to determine whether there was a tendency to change in the odds ratio of sleep disorder symptoms according to increase in working hours. The statistical significance was set at p<0.05. Statistical Package for the Social Science (SPSS) for Windows version 25.0 (SPSS Inc., Chicago, IL, USA) was used for all statistical analysis.
The Institutional Review Board of Ajou University Hospital approved this study (AJIRB-SBR-EXP-19-543).
RESULTS
Among the 33,203 participants included in the study, there were 18,964 (57.1%) males and 14,239 (42.9%) females, for sleep disturbance symptoms, females showed a higher prevalence of difficulties falling asleep (males, 10.3%; females, 12.3%) and waking up repeatedly during the sleep (males, 9.4%; females, 11.2%), as well as waking up with a feeling of exhaustion and fatigue (males, 12.2%; females, 12.9%) (Table 1). All were statistically significant except for between marital status and waking up with a feeling of exhaustion and fatigue and between employment status and difficulty falling asleep. Table 2 shows the prevalence of sleep disturbance symptoms based on the presence or absence of WTA change, by sex. In both male and female participants, WTA change was associated with higher prevalence of difficulties falling asleep, waking up repeatedly during the sleep, as well as waking up with a feeling of exhaustion and fatigue compared to the reference group.
Table 1
General characteristics of the study population according to sleep disturbance symptoms
Table 2
The relationship between change in working time arrangement and sleep disturbance according to sex
Table 3 shows the OR and CI for sleep disturbance with WTA change. In both sexes, WTA change is associated with increased OR of all sleep disturbance symptoms compared to the reference group. The group with change in WTA showed elevated OR values of 1.91 (95% CI: 1.73–2.11), 1.93 (95% CI: 1.74–2.14), 2.47 (95% CI: 2.26–2.71) for male workers; and 1.93 (95% CI: 1.73–2.16), 2.02 (95% CI: 1.80–2.27), 2.24 (95% CI: 2.01–2.50) for female workers, for difficulty in falling asleep, waking up repeatedly during the sleep, waking up with a feeling of exhaustion, and fatigue, respectively. The adjusted ORs for sleep disturbance symptoms according to other characteristics were shown in Supplementary Table 1.
Table 3
Adjusted odds ratios for sleep disturbance symptoms by change on WTA according to sex
Tables 4 and 5 shows the OR and 95% CI for sleep disturbance with WTA change and working hours. In male workers, there was general trend of increasing risk of all sleep disturbance symptoms with longer working hours with statistically significant differences. In the case of WTA change, the OR was further increased. The group working ≥53 hours per week with WTA change showed the highest risk of difficulty falling asleep (OR: 2.57, 95% CI: 1.94–3.40), waking up repeatedly during the sleep (OR: 2.82, 95% CI: 2.10–3.77) and waking up with a feeling of exhaustion and fatigue (OR: 3.96, 95% CI: 3.10–5.07).
Table 4
Adjusted odds ratios for sleep disturbance by working hours and change on WTAs of male workers
Table 5
Adjusted odds ratios for sleep disturbance by working hours and change on working time arrangements of female workers
In female workers, although not as pronounced as male and with slight fluctuations(The group working ≤40 hours per week with WTA change showed the highest risks of difficulty falling asleep [OR: 2.24, 95% CI: 1.86–2.70]), there was also trend of increasing risk of sleep disturbance symptoms with longer working hours and WTA change. The group working ≥53 hours per week with WTA change showed the highest risk of waking up repeatedly during the sleep (OR: 2.66, 95% CI: 1.86–3.82) and waking up with a feeling of exhaustion and fatigue (OR: 3.25, 95% CI: 2.35–4.49).
DISCUSSION
The aim of this study was to investigate the relationship between symptoms of sleep disturbance and unilaterally notified WTA changes using a representative sample of Korean workers. The results showed positive correlations of WTA changes with sleep disturbance symptoms. Participants who experienced change in working time arrangement had higher risk of all 3 types of sleep disturbance symptoms. Even when participants were stratified by sex and working hours, and factors such as age, monthly earning, shift work, employment type, and occupation were adjusted for all subgroups with WTA changes showed higher OR for all 3 types of sleep disturbance symptoms compared to the reference group.
There are many possible explanations for our results. WTA change requires workers to commute at a different time than usual. This also means they have to sleep and wake up at different times. These changes can lower the quality of sleep [18]. Also, WTA changes could cause sleep disturbance by increasing WFC. Unpredictable working hours show a strong correlation with WFC [19,20], and WFC can cause sleep disturbance [21]. Furthermore, stress-mediated mechanisms could also be considered because changes in WTA can increase stress when applied with low control in a job demand-control model [13], and unpredictable schedules are known to increase perceived stress in practice [22]. It is well established that stress causes sleep disturbance through over-activation of the hypothalamic-pituitary-adrenal (HPA) axis and increased sympathetic tone [23].
While worker-led flexibility shows positive effects on health, including sleep, by increasing social interaction and health-related behaviors [24], employer-led flexibility and changes in working time that are unilaterally announced by the employer are likely to cause changes towards “social desynchronization.” Familial/social support acts as a protective factor against sleep disturbance [25,26], but when this support decreases, it can lead to elevated risk of sleep disorders. In addition, WTA change could also increase the risk of sleep disturbance via negative effects on dietary lifestyle and physical activity [27].
We confirmed that there is a trend that the risk of sleep disturbance symptoms increase as WTA change occurs and working hours increase in both male and female participants. However, this pattern was slightly different between male and female participants(The results of trend analysis are presented in Supplementary Tables 2 and 3). In contrast to the male participant, which increased completely with the increase in working hours, there were cases where the female participant did not. These sex differences may be caused by both physiological and psychologic factors. Physiologically, women are affected by reproductive hormones throughout the life span, which is related to sleep. Hormones such as luteinizing hormone, follicle stimulate hormone, progesterone, and estrogen evoke changes in circadian rhythms and sleep architecture [28]. Psychologically, women often report more anxiety, depression, and irritability, which are highly related with sleep disturbance [29]. Adjusting to the role of motherhood and caring baby/children through the night may result in insufficient sleep, as well as negative emotions [28,30].
Other possible explanation is by “total working time.” Research has shown that average paid labor time is longer for males, but “total working time,” which includes unpaid labor time such as housework and childcare, is longer for females than males [1]. In this present study, when the frequency of housework was analyzed according to paid-working time (Supplementary Figs. 1 and 2), males showed no significant difference in the ratio of participants performing housework everyday with differences in working time, whereas females showed a significant increase in the ratio of participants performing housework everyday with shorter working hours. This increase in unpaid labor time for female participants could have contributed to sleep disturbance for females.
The strengths of this study are as follows. First, this study is the first to investigate the effects on sleep symptoms of WTA change during employer-led flexibility work, which is the common work schedule for Korean workers. Second, we used large-scale, representative data for Korean workers. Third, unlike previous studies, the 5th KWCS enabled a multidimensional approach to evaluation of sleep disorder symptoms.
This study also had several limitations. First, as a cross-sectional study, it was not possible to investigate the causal relationship between WTA changes and sleep disturbance symptoms. For this purpose, it will be necessary to perform research in the future with a longitudinal design. Second, because there were no data on frequency or variation of WTA change, it was not possible to analyze its dose-response effect with sleep disturbance. Third, because this study used self-reported sleep disturbance tool, the validity of sleep disturbance diagnosis could be restricted. It will be necessary to conduct research using medical records, such as validated diagnostic instruments, hospital visits, and medication usage. Finally, due to limitations of the data, we were unable to account for health status that can affect sleep disturbance, such as disease history and body mass index, lifestyle habits such as alcohol consumption, smoking, and caffeine intake.
CONCLUSION
Workers who receive notification of WTA changes show a high risk of sleep disturbance. Therefore, it will be necessary to make efforts to reduce work schedule unpredictability and establish true worker-led flexibility, as well as to implement health care in addition to impairment management programs, including sleep, for workers with frequent WTA changes.
ACKNOWLEDGEMENTS
We would like to thank the Safety and Health Policy Research Department (Occupational Safety and Health Research Institute) for granting access to the raw data of Fifth Korean Working Conditions Survey (KWCS).
Abbreviations
CI
confidence interval
EWCS
European Working Conditions Survey
HPA
hypothalamic-pituitary-adrenal
ILO
International Labor Organization
KWCS
Korean Working Conditions Survey
LFS
Labor Force Survey
OR
odds ratios
OSHRI
Occupational Safety and Health Research Institute
SPSS
Statistical Package for the Social Science
WFC
work-family conflict
WTA
working time arrangements
-
Competing interests: The authors declare that they have no competing interest.
-
Author Contributions:
NOTES
SUPPLEMENTARY MATERIALS
Supplementary Table 1
Adjusted odd ratios for sleep disturbance symptoms by worker characteristics
Supplementary Table 2
Adjusted odds ratios for sleep disturbance by working hours and change in WTAs of male workers
Supplementary Table 3
Adjusted odds ratios for sleep disturbance by working hours and change in WTAs of female workers
Supplementary Fig. 1
Frequency of household according to working hours in male workers.
Supplementary Fig. 2
Frequency of household according to working hours in female workers.
- 1. Fagan C, Lyonette C, Smith M, Saldaña-Tejeda A. The influence of working time arrangements on work-life integration or ‘balance’: a review of the international evidence. Geneva: International Labour Organization; 2012.
- 2. Virtanen M, Ferrie JE, Gimeno D, Vahtera J, Elovainio M, Singh-Manoux A, et al. Long working hours and sleep disturbances: the Whitehall II prospective cohort study. Sleep 2009;32(6):737–745. 19544749.ArticlePubMedPMC
- 3. Bannai A, Tamakoshi A. The association between long working hours and health: a systematic review of epidemiological evidence. Scand J Work Environ Health 2014;40(1):5–18. 24100465.ArticlePubMed
- 4. International Labour Organization. Working time in the twenty-first century: discussion report for the Tripartite Meeting of Experts on Working-time Arrangements. Geneva: International Labour Organization; 2011.
- 5. Merkus SL, Holte KA, Huysmans MA, van Mechelen W, van der Beek AJ. Nonstandard working schedules and health: the systematic search for a comprehensive model. BMC Public Health 2015;15(1):1084. 26498045.ArticlePubMedPMCPDF
- 6. Ala-Mursula L, Vahtera J, Kouvonen A, Väänänen A, Linna A, Pentti J, et al. Long hours in paid and domestic work and subsequent sickness absence: does control over daily working hours matter? Occup Environ Med 2006;63(9):608–616. 16728502.ArticlePubMedPMC
- 7. Hughes EL, Parkes KR. Work hours and well-being: the roles of work-time control and work-family interference. Work Stress 2007;21(3):264–278.Article
- 8. Joyce K, Pabayo R, Critchley JA, Bambra C. Flexible working conditions and their effects on employee health and wellbeing. Cochrane Database Syst Rev 2010;2010(2):CD008009.ArticlePubMedPMC
- 9. Nicol AM, Botterill JS. On-call work and health: a review. Environ Health 2004;3(1):15. 15588276.ArticlePubMedPMCPDF
- 10. Vedaa Ø, Harris A, Bjorvatn B, Waage S, Sivertsen B, Tucker P, et al. Systematic review of the relationship between quick returns in rotating shift work and health-related outcomes. Ergonomics 2016;59(1):1–14. 26072668.ArticlePubMed
- 11. Chung H. Dualization and the access to occupational family-friendly working-time arrangements across Europe. Soc Policy Adm 2018;52(2):491–507.ArticlePDF
- 12. Kim YO, Kim JS, Lee SH. Work Family Compatibility Survey, 2017. Sejong: Ministry of Employment and Labor; 2017.
- 13. Karasek R, Theorell T. Healthy work: stress, productivity and the reconstruction of working life. New York: Basic Books; 1990.
- 14. Salo P, Oksanen T, Sivertsen B, Hall M, Pentti J, Virtanen M, et al. Sleep disturbances as a predictor of cause-specific work disability and delayed return to work. Sleep 2010;33(10):1323–1331. 21061854.ArticlePubMedPMC
- 15. Parthasarathy S, Vasquez MM, Halonen M, Bootzin R, Quan SF, Martinez FD, et al. Persistent insomnia is associated with mortality risk. Am J Med 2015;128(3):268–75.e2. 25447616.ArticlePubMedPMC
- 16. Jansson-Fröjmark M, Lindblom K. A bidirectional relationship between anxiety and depression, and insomnia? A prospective study in the general population. J Psychosom Res 2008;64(4):443–449. 18374745.ArticlePubMed
- 17. Elwood P, Hack M, Pickering J, Hughes J, Gallacher J. Sleep disturbance, stroke, and heart disease events: evidence from the Caerphilly cohort. J Epidemiol Community Health 2006;60(1):69–73. 16361457.ArticlePubMedPMC
- 18. James B. No rest for the weary: commuting, hours worked, and sleep. Munich: Munich Personal RePEc Archive; 2015.
- 19. Jansen NW, Kant I, Kristensen TS, Nijhuis FJ. Antecedents and consequences of work-family conflict: a prospective cohort study. J Occup Environ Med 2003;45(5):479–491. 12769054.ArticlePubMed
- 20. Steiber N. Reported levels of time-based and strain-based conflict between work and family roles in Europe: a multilevel approach. Soc Indic Res 2009;93(3):469–488.ArticlePDF
- 21. Buxton OM, Lee S, Beverly C, Berkman LF, Moen P, Kelly EL, et al. Work-family conflict and employee sleep: evidence from IT workers in the Work, Family and Health Study. Sleep (Basel) 2016;39(10):1871–1882.Article
- 22. Scholarios D, Hesselgreaves H, Pratt R. Unpredictable working time, well-being and health in the police service. Int J Hum Resour Manage 2017;28(16):2277–2298.Article
- 23. Kudielka BM, Kirschbaum C. Sex differences in HPA axis responses to stress: a review. Biol Psychol 2005;69(1):113–132. 15740829.ArticlePubMed
- 24. Martens M, Nijhuis FJ, Van Boxtel MP, Knottnerus J. Flexible work schedules and mental and physical health. A study of a working population with non-traditional working hours. J Organ Behav 1999;20(1):35–46.Article
- 25. Ailshire JA, Burgard SA. Family relationships and troubled sleep among U.S. adults: examining the influences of contact frequency and relationship quality. J Health Soc Behav 2012;53(2):248–262. 22653715.ArticlePubMedPMCPDF
- 26. Cacioppo JT, Hawkley LC, Berntson GG, Ernst JM, Gibbs AC, Stickgold R, et al. Do lonely days invade the nights? Potential social modulation of sleep efficiency. Psychol Sci 2002;13(4):384–387. 12137144.ArticlePubMedPDF
- 27. Dixon J, Carey G, Strazdins L, Banwell C, Woodman D, Burgess J, et al. Contemporary contestations over working time: time for health to weigh in. BMC Public Health 2014;14(1):1068. 25308889.ArticlePubMedPMCPDF
- 28. Nowakowski S, Meers J, Heimbach E. Sleep and women's health. Sleep Med Rev 2013;4(1):1–22.ArticlePubMedPMC
- 29. Guidozzi F. Gender differences in sleep in older men and women. Climacteric 2015;18(5):715–721. 26249643.ArticlePubMed
- 30. Sloan EP. Sleep deprivation and postpartum mental health: case report. Arch Women Ment Health 2011;14(6):509–511.
REFERENCES
REFERENCES
Figure & Data
REFERENCES
Citations
Citations to this article as recorded by 
- Diversity of flexible working time arrangements and workers' health: An analysis of a workers’ panel and linked employer-employee data for France
Christine Erhel, Mathilde Guergoat-Larivière, Malo Mofakhami
Social Science & Medicine.2024; 356: 117129. CrossRef
 Cite
CiteAssociation between change in working time arrangements and sleep disturbance

Fig. 1 Schematic diagram depicting study participants.KWCS: Korean Working Condition Survey.
Fig. 1
Association between change in working time arrangements and sleep disturbance
| Characteristics | Total (n=33,203) | Difficulty falling asleep | p-value | Waking up repeatedly during the sleep | p-value | Waking up with a feeling of exhaustion and fatigue | p-value | ||||
|---|---|---|---|---|---|---|---|---|---|---|---|
| Yes | No | Yes | No | Yes | No | ||||||
| Sex | <0.001 | <0.001 | <0.001 | ||||||||
| Male | 18,964 (57.1) | 1,954 (10.3) | 17,010 (89.7) | 1,784 (9.4) | 17,180 (90.6) | 2,318 (12.2) | 16,646 (87.8) | ||||
| Female | 14,239 (42.9) | 1,747 (12.3) | 12,492 (87.7) | 1,590 (11.2) | 12,649 (88.8) | 1,841 (12.9) | 12,398 (87.1) | ||||
| Age | <0.001 | <0.001 | <0.001 | ||||||||
| 20–29 | 6,016 (18.1) | 662 (11.0) | 5,354 (89.0) | 539 (9.0) | 5,477 (91.0) | 710 (11.8) | 5,306 (88.2) | ||||
| 30–39 | 8,396 (25.3) | 853 (10.2) | 7,543 (89.8) | 747 (8.9) | 7,649 (91.1) | 909 (10.8) | 7,487 (89.2) | ||||
| 40–49 | 8,478 (25.5) | 898 (10.6) | 7,580 (89.4) | 835 (9.8) | 7,643 (90.2) | 1,061 (12.5) | 7,417 (87.5) | ||||
| 50–59 | 6,611 (19.9) | 803 (12.2) | 5,808 (87.8) | 762 (11.5) | 5,849 (88.5) | 933 (14.1) | 5,678 (85.9) | ||||
| ≥60 | 3,702 (11.2) | 487 (13.2) | 3,215 (86.8) | 491 (13.3) | 3,211 (86.7) | 547 (14.8) | 3,155 (85.2) | ||||
| Marital status | 0.002 | 0.002 | 0.210 | ||||||||
| Yes | 27,473 (82.7) | 2,995 (10.9) | 24,478 (89.1) | 2,743 (10.0) | 24,730 (90.0) | 3,414 (12.4) | 24,059 (87.6) | ||||
| No | 5,730 (17.3) | 707 (12.3) | 5,023 (87.7) | 631 (11.0) | 5,099 (89.0) | 746 (13.0) | 4,984 (87.0) | ||||
| Education level | <0.001 | <0.001 | <0.001 | ||||||||
| High school or less | 12,988 (39.1) | 1,591 (12.2) | 11,397 (87.8) | 1,483 (11.4) | 11,505 (88.6) | 1,916 (14.8) | 11,072 (85.2) | ||||
| College or above | 20,215 (60.9) | 2,111 (10.4) | 18,104 (89.6) | 1,891 (9.4) | 18,324 (90.6) | 2,244 (11.1) | 17,971 (88.9) | ||||
| Occupation | <0.001 | <0.001 | <0.001 | ||||||||
| White collar | 15,897 (47.9) | 1,667 (10.5) | 14,230 (89.5) | 1,489 (9.4) | 14,408 (90.6) | 1,713 (10.8) | 14,184 (89.2) | ||||
| Pink collar | 7,531 (22.7) | 970 (12.9) | 6,561 (87.1) | 802 (10.7) | 6,729 (89.3) | 1,015 (13.5) | 6,516 (86.5) | ||||
| Blue collar | 9,775 (29.4) | 1,066 (10.9) | 8,709 (89.1) | 1,082 (11.1) | 8,693 (88.9) | 1,432 (14.6) | 8,343 (85.4) | ||||
| Employment status | 0.438 | 0.017 | <0.001 | ||||||||
| Regular | 27,349 (82.4) | 3,033 (11.1) | 24,316 (88.9) | 2,729 (10.0) | 24,620 (90.0) | 3,350 (12.2) | 23,999 (87.8) | ||||
| Temporary/part-time | 5,854 (17.6) | 670 (11.4) | 5,184 (88.6) | 645 (11.0) | 5,209 (89.0) | 810 (13.8) | 5,044 (86.2) | ||||
| Shift work | <0.001 | <0.001 | <0.001 | ||||||||
| Yes | 3,810 (11.5) | 543 (14.3) | 3,267 (85.7) | 491 (12.9) | 3,319 (87.1) | 639 (16.8) | 3,171 (83.2) | ||||
| No | 29,393 (88.5) | 3,159 (10.7) | 26,234 (89.3) | 2,883 (9.8) | 26,510 (90.2) | 3,521 (12.0) | 25,872 (78.0) | ||||
| No. of employees | <0.001 | <0.001 | <0.001 | ||||||||
| <10 | 11,708 (35.3) | 1,396 (11.9) | 10,312 (88.1) | 1,274 (10.9) | 10,434 (89.1) | 1,557 (13.3) | 10,151 (86.7) | ||||
| 10–299 | 16,365 (49.3) | 1,822 (11.1) | 14,543 (88.9) | 1,643 (10.0) | 14,722 (90.0) | 2,022 (12.4) | 14,343 (87.6) | ||||
| ≥300 | 5,130 (15.4) | 484 (9.4) | 4,646 (90.6) | 457 (8.9) | 4,673 (91.1) | 582 (11.3) | 4,548 (88.7) | ||||
| Income (10,000 won/month) | <0.001 | <0.001 | <0.001 | ||||||||
| <200 | 10,887 (32.8) | 1,437 (13.2) | 9,450 (86.8) | 1,295 (11.9) | 9,592 (88.1) | 1,483 (13.6) | 9,404 (86.4) | ||||
| 200–299 | 9,667 (29.1) | 1,007 (10.4) | 8,660 (89.6) | 930 (9.6) | 8,737 (90.4) | 1,171 (12.1) | 8,496 (87.9) | ||||
| ≥300 | 12,649 (38.1) | 1,258 (10.0) | 11,391 (90.0) | 1,150 (9.1) | 11,499 (90.9) | 1,506 (11.9) | 11,143 (88.1) | ||||
| Working hours/week | <0.001 | <0.001 | <0.001 | ||||||||
| ≤40 | 19,746 (59.5) | 2,020 (10.2) | 17,726 (89.8) | 1,807 (9.1) | 17,939 (90.9) | 2,074 (10.5) | 17,672 (89.5) | ||||
| 41–52 | 9,141 (27.5) | 1,102 (12.1) | 8,039 (87.9) | 1,000 (10.9) | 8,141 (89.1) | 1,307 (14.3) | 7,834 (85.7) | ||||
| ≥53 | 4,316 (13.0) | 580 (13.4) | 3,736 (86.6) | 567 (13.2) | 3,749 (86.8) | 779 (18.1) | 3,537 (81.9) | ||||
| Change on working time arrangement | <0.001 | <0.001 | <0.001 | ||||||||
| Yes | 7,942 (23.9) | 1,326 (16.7) | 6,616 (83.3) | 1,229 (15.5) | 6,713 (84.5) | 1,686 (21.2) | 6,256 (78.8) | ||||
| No | 25,261 (76.1) | 2,376 (9.4) | 22,885 (90.6) | 2,145 (8.5) | 23,116 (91.5) | 2,474 (9.8) | 22,787 (90.2) | ||||
| Variables | Male | p-value | Female | p-value | |||||
|---|---|---|---|---|---|---|---|---|---|
| Total | WTA change | Total | WTA change | ||||||
| Yes | No | Yes | No | ||||||
| Difficulty falling asleep | <0.001 | <0.001 | |||||||
| Yes | 1,954 (10.3) | 759 (15.4) | 1,195 (8.5) | 1,747 (12.3) | 567 (18.7) | 1,180 (10.5) | |||
| No | 17,010 (89.7) | 4,159 (84.6) | 12,851 (91.5) | 12,492 (87.7) | 2,457 (81.3) | 10,035 (89.5) | |||
| Waking up repeatedly during the sleep | <0.001 | <0.001 | |||||||
| Yes | 1,784 (9.4) | 706 (14.4) | 1,078 (7.7) | 1,590 (11.2) | 524 (17.3) | 1,066 (9.5) | |||
| No | 17,180 (90.6) | 4,213 (85.6) | 12,967 (92.3) | 12,649 (88.8) | 2,500 (82.7) | 10,149 (90.5) | |||
| Waking up with a feeling of exhaustion and fatigue | <0.001 | <0.001 | |||||||
| Yes | 2,318 (12.2) | 1,034 (21.0) | 1,284 (9.1) | 1,841 (12.9) | 651 (21.5) | 1,190 (10.6) | |||
| No | 16,646 (87.8) | 3,884 (79.0) | 12,762 (90.9) | 12,398 (87.1) | 2,372 (78.5) | 10,026 (89.4) | |||
| Variables | Difficulty falling asleep | Waking up repeatedly during the sleep | Waking up with a feeling of exhaustion and fatigue | |
|---|---|---|---|---|
| Male | ||||
| No change on WTA | 1 (Reference) | 1 (Reference) | 1 (Reference) | |
| Change on WTA | 1.91 (1.73–2.11) | 1.93 (1.74–2.14) | 2.47 (2.26–2.71) | |
| Female | ||||
| No change on WTA | 1 (Reference) | 1 (Reference) | 1 (Reference) | |
| Change on WTA | 1.93 (1.73–2.16) | 2.02 (1.80–2.27) | 2.24 (2.01–2.50) | |
| Variables | Working hours (hours/week) | |||
|---|---|---|---|---|
| ≤40 | 41–52 | ≥53 | ||
| Difficulty falling asleep | ||||
| No change on WTA | 1 (Reference) | 1.23 (1.00–1.51) | 1.65 (1.29–2.11) | |
| Change on WTA | 2.16 (1.75–2.67) | 2.26 (1.79–2.85) | 2.57 (1.94–3.40) | |
| Waking up repeatedly during the sleep | ||||
| No change on WTA | 1 (Reference) | 1.23 (0.99–1.54) | 1.83 (1.43–2.33) | |
| Change on WTA | 2.13 (1.72–2.65) | 2.44 (1.91–3.10) | 2.82 (2.10–3.77) | |
| Waking up with a feeling of exhaustion and fatigue | ||||
| No change on WTA | 1 (Reference) | 1.34 (1.09–1.64) | 2.00 (1.60–2.51) | |
| Change on WTA | 2.83 (2.33–3.43) | 3.18 (2.56–3.93) | 3.96 (3.10–5.07) | |
| Variables | Working hours (hours/week) | |||
|---|---|---|---|---|
| ≤40 | 41–52 | ≥53 | ||
| Difficulty falling asleep | ||||
| No change on WTA | 1 (Reference) | 1.34 (1.12–1.60) | 1.16 (0.91–1.48) | |
| Change on WTA | 2.24 (1.86–2.70) | 2.08 (1.63–2.67) | 1.78 (1.22–2.61) | |
| Waking up repeatedly during the sleep | ||||
| No change on WTA | 1 (Reference) | 1.37 (1.14–1.65) | 1.23 (0.95–1.58) | |
| Change on WTA | 2.26 (1.87–2.74) | 2.18 (1.70–2.79) | 2.66 (1.86–3.82) | |
| Waking up with a feeling of exhaustion and fatigue | ||||
| No change on WTA | 1 (Reference) | 1.69 (1.41–2.02) | 1.71 (1.35–2.15) | |
| Change on WTA | 2.71 (2.25–3.26) | 2.93 (2.32–3.69) | 3.25 (2.35–4.49) | |
Table 1 General characteristics of the study population according to sleep disturbance symptoms
All numbers reflect weighted frequencies rounded to the nearest whole number. Values are presented as number of patients (%).
Table 2 The relationship between change in working time arrangement and sleep disturbance according to sex
All numbers reflect weighted frequencies rounded to the nearest whole number. Values are presented as number of patients (%).
Table 3 Adjusted odds ratios for sleep disturbance symptoms by change on WTA according to sex
Adjusted for age, marriage, education level, occupation, employment status, shift-work, working hours, number of employees, monthly income. Values are presented as odds ratio (95% confidence interval).
WTA: working time arrangement.
Table 4 Adjusted odds ratios for sleep disturbance by working hours and change on WTAs of male workers
Adjusted for age, marriage, education level, occupation, employment status, shift-work, number of employees, monthly earning. Values are presented as odds ratio (95% confidence interval).
WTA: working time arrangement.
Table 5 Adjusted odds ratios for sleep disturbance by working hours and change on working time arrangements of female workers
Adjusted for age, marriage, education level, occupation, employment status, shift-work, number of employees, monthly earning. Values are presented as odds ratio (95% confidence interval).
WTA: working time arrangement.

