
Articles
- Page Path
- HOME > Ann Occup Environ Med > Volume 30; 2018 > Article
- Research Article Performance assessment on the Korean Computerized Neurobehavioral Test using a mobile device and a conventional computer: an experimental study
- Young Seok Byun1, Sung Kyu Park1, Joon Sakong1,2, Man Joong Jeon1,2
-
Annals of Occupational and Environmental Medicine 2018;30:55.
DOI: https://doi.org/10.1186/s40557-018-0264-6
Published online: August 29, 2018
1 Department of Occupational and Environmental Medicine, Yeungnam University Hospital, 3rd floor, Yeong-ui-gwan, 170, Hyeonchung-ro, Namgu, Daegu, 42415 Republic of Korea
2 Department of Preventive Medicine and Public Health, College of Medicine, Yeungnam University, Yeungnam University Hospital, 170, Hyeonchung-ro, Namgu, Daegu, 42415 Republic of Korea
• Received: April 14, 2018 • Accepted: August 5, 2018
© The Author(s). 2018
Open AccessThis article is distributed under the terms of the Creative Commons Attribution 4.0 International License (http://creativecommons.org/licenses/by/4.0/), which permits unrestricted use, distribution, and reproduction in any medium, provided you give appropriate credit to the original author(s) and the source, provide a link to the Creative Commons license, and indicate if changes were made. The Creative Commons Public Domain Dedication waiver (http://creativecommons.org/publicdomain/zero/1.0/) applies to the data made available in this article, unless otherwise stated.
Abstract
-
Background The Korean Computerized Neurobehavioral Test (KCNT) is a psychological assessment tool used as part of Workers’ Special Health Examinations in Korea. Due to the spread of mobile technology, this study aimed to compare results of the KCNT administered on a tablet PC versus a desktop computer, and, therefore, assess the clinical applicability of mobile devices.
-
Methods A total of 72 participants enrolled in this study. Their age, sex, and years of formal education were collected during an interview, as well as their typing speed. The test battery comprised five subtests: Simple Reaction Time test, Choice Reaction Time test, Digit Addition test, Symbol-Digit Substitution test, and Finger Tapping Speed test. Participants repeated the KCNT test battery in a randomly assigned order using four different testing systems: a desktop computer equipped with a conventional 106-key keyboard (System 1), a desktop computer equipped with a simplified keyboard (System 2), a tablet PC with a simplified 17-key on-screen keyboard (System 3), and a tablet PC equipped with a simplified keyboard (System 4).
-
Results Results of the Digit Addition test did not differ significantly for different testing systems. In contrast, results of the Simple Reaction Time test, Choice Reaction Time test, Symbol-Digit Substitution test, and Finger Tapping test were lower for the tablet PC (Systems 3 and 4) compared to the desktop computer (Systems 1 and 2). Systems 1 and 2 did not show significantly different results. Performance on System 3 was inferior to that on System 4, only for the Choice Reaction Time test and Finger Tapping Speed test. There were also significant differences in performance by computer familiarity when adjusted for age and education; however, the performance of each group on the test systems showed similar patterns.
-
Conclusions It is not recommended to use a tablet PC to administer the KCNT to evaluate neurobehavioral performance for the Simple Reaction Time test and Choice Reaction Time test; however, tablet PCs with an on-screen keyboard may be used to perform the Digit Addition test, and the Symbol-Digit Substitution test and Finger Tapping Speed test to a limited degree.
Background
Within recent years, the use of mobile devices such as smartphones and tablet PCs has been growing rapidly. In countries with developing economies in 2013, the rate (median) of adult smartphone users was reported as 21%, and increased to 28 and 37% in 2014 and 2015, respectively [1]. In 2015, adult smartphone ownership was reported to be as high as 68% among economically advanced countries [1]. The number of tablet PC users worldwide also increased from 0.70 billion in 2013 to 0.91 billion in 2014, and was predicted to surpass one billion by 2017, with growth predicted to stay over 10% [2].
Therefore, application of mobile technology in the medical sector has drawn much attention. The World Health Organization addressed the “unprecedented spread of mobile technologies” as a new horizon for health and defined the application of such powerful innovations as “mHealth” in 2011 [3]. In the same year, the Korea Food and Drug Administration (KFDA) also released guidelines for the review and approval of mobile picture archiving and communication systems (PACS) for secure and controlled clinical use [4]. Use of mHealth in clinical settings can already be seen, such as diagnoses using mobile image interpretation of computed tomography (CT) examinations and hospital inpatient rounding programs [5–8].
Based on the above, it is evident that the Korean Computerized Neurobehavioral Test (KCNT) could be applied clinically using mobile devices. The KCNT is a powerful, standardized tool in the assessment of neurobehavioral functions with high sensitivity, fidelity, and validity. It is also a more practical tool compared to interview-based tests such as the WHO Neurobehavioral Core Test Battery (WHO-NCTB) and psychological assessment tools applied as part of the Workers’ Special Health Examinations to screen workers at risk for exposure to neurotoxic chemicals [9–13].
Currently, while performing the KCNT, desktop computers are recommended and preferred over laptop computers, despite desktop computers’ inferior portability. This is because the performance of examinees with lower computer profiency is known to be influenced by the type of computer [14, 15]. In this study, we aimed to primarily evaluate the results of the KCNT performed on a tablet PC versus a desktop computer, and, therefore, assess the clinical applicability of mobile devices.
Methods
This study was conducted from May to December 2017. Participants were selected using convenience sampling. Those who visited the hospital for a health examination were asked to participate and were interviewed for eligibility according to the inclusion and exclusion criteria. Then, they were asked to complete the KCNT. To control confounding variables such as age, sex, and education, every participant repeated the battery of the KCNT using four different test devices (later referred to as Systems) in a randomly assigned order. This study was approved by the institutional review board of Yeungnam University (IRB File No. YU 2017-04-001-001). Seventy-four people volunteered and none were ineligible to participate. However, data from two participants were inappropriate for analysis and were excluded. Therefore, 72 participants were included in this study.
People who were aged over 19 and under 65 years were selected if they did not meet the exclusion criteria. They were excluded if they had any of the following [16–20]: a past medical history of or present serious condition that could affect neurobehavioral performance such as head trauma or neurological disease; potential occupational exposure to neurotoxins revealed during an interview; and physical disabilities that could influence the neurobehavioral test, such as hearing impairment, color vision deficiency, or severe lower back pain.
General characteristics were collected during the interview, including age, sex, and years of formal education. Participants’ typing speed was also tested to objectively evaluate computer familiarity. Typing speed was defined as the number of Korean characters typed in a minute.
Four different testing systems were used in this study (Fig. 1): a desktop computer equipped with a conventional 106-key keyboard (System 1), a desktop computer equipped with a simplified keyboard (System 2), a tablet PC with a simplified 17-key on-screen keyboard (System 3), and a tablet PC equipped with a simplified keyboard (System 4). In System 3, the tablet PC display was a capacitive screen digitizer and an on-screen keyboard was used as the input device. The tablet PC used in this study had a display with a diagonal length of 10 in., whereas the monitor connected to the desktop computer had a display with a diagonal length of 24 in..
Fig. 1

The test systems. Four different test systems were used in this study: a System 1, a desktop computer equipped with a conventional 106-key keyboard; b System 2, a desktop computer equipped with a simplified 17-key keyboard; c System 3, a tablet PC with an on-screen keyboard; d System 4, a tablet PC equipped with a simplified 17-key keyboard
The test battery comprised five subtests selected by the authors [9, 14, 15]: Simple Reaction Time (SRT) test, Choice Reaction Time (CRT) test, Digit Addition (DA) test, Symbol-Digit Substitution (SDS) test, and Finger Tapping Speed (FTS) test. Since every participant performed the KCNT multiple times, there was a risk of biases due to mental fatigue and learning effect [21, 22]. To minimize these biases, participants performed the test in a completely counter-balanced, randomly and evenly assigned order. That is, there were 24 possible combinations of the four systems, and every participant was assigned a random sequence in which to serially perform the KCNT.
All subtests, except for the FTS test, had three common parameters: correct response rate (RateCR), mean reaction time of correct responses (RTmean), and standard deviation of the reaction time (SDRT), where reaction time is expressed in milliseconds. In contrast, there were only two parameters for the FTS test: average number of taps during 10-s trials using the dominant hand and the non-dominant hand, respectively (FTSD and FTSND).
Statistical analyses were performed using IBM SPSS Statistics Version 22. General characteristics were described using frequencies, percentages, means, and standard deviations. To assess performance, parameters generated from each subtest were analyzed. Repeated measures analysis of variance (ANOVA) and the Friedman test were used to compare performance for the four different systems. For the ANOVA and Friedman test, Bonferroni test and Wilcoxon signed-rank test were applied as post-hoc procedures, respectively. Analysis of covariance (ANCOVA) was used to compare performance between groups with different computer familiarity. For ANCOVA, Bonferroni test was applied as a post-hoc procedure. A p-value below 0.05 was considered statistically significant.
Results
General characteristics of all 72 participants are listed and summarized in Table 1. Participants were on average 40.3 ± 12.8 years old and 50% were male. Seventy-one participants (98.6%) completed high school education or higher; one participant completed only middle school education. Their typing speed was 258.2 ± 164.5 characters per minute on average. Forty participants (55.6%) could type more than 200 characters per minute, and were classified as Group III (very familiar with computers). Twenty-three participants (31.9%) had a typing speed of lower than 200 characters per minute and were classified as Group II (relatively familiar with computers). Nine participants (12.5%) with a typing speed of near zero were classified as Group I (no competency using computers).
Table 1
General characteristics of all participants
SD standard deviation, Group I participants with typing speed of near zero (no competency using computers), Group II participants with typing speed less than 200 characters/min (relatively familiar with computers), Group III participants with typing speed of 200 characters/min or greater (very familiar with computers)
aNumber of Korean characters typed in a minute
Performance of all participants was evaluated by comparing test parameters among Systems 1, 2, 3, and 4 (Table 2). The mean reaction time of the SRT test showed a significant difference between systems (p < 0.001). Post-hoc analysis showed that the mean reaction time for Systems 3 and 4 was greater than that of Systems 1 and 2. The mean reaction time for the CRT test also showed differences between systems (p < 0.001). In contrast to the results from the SRT test, post-hoc analysis showed that the mean reaction time for the CRT test using System 3 was significantly greater than that of System 4. The mean reaction time for the CRT test using Systems 3 and 4 was significantly greater than that of Systems 1 and 2. Although the mean reaction time for the SDS test was similar between systems (p = 0.961), the correct response rate significantly differed (p < 0.001); there was no difference between System 1 and System 2, but the rate was lower for System 3. Performance on the DA test did not show significant differences by system type for all parameters (RTmean, p = 0.364; SDRT, p = 0.664; RateCR, p = 0.751). Similarly, for the FTS test, results using dominant hand did not differ between systems (p = 0.350), but the results using non-dominant hand showed a decreased performance in System 3 compared to Systems 1, 2 and 4 (p < 0.001).
Table 2
Performance on the KCNT between test systems
System 1 a desktop computer equipped with a conventional 106-key keyboard, System 2 a desktop computer equipped with a simplified 17-key keyboard, System 3 a tablet PC with an on-screen keyboard, System 4 a tablet PC equipped with a simplified 17-key keyboard, SD standard deviation, SRT simple reaction time, CRT choice reaction time, DA digit addition, SDS symbol-digit substitution, FTS finger tapping speed, RT
mean
mean reaction time, SD
RT
standard deviation of reaction time, Rate
CR
correct response rate, FTS
D
finger tapping speed of dominant hand, FTS
ND
finger tapping speed of non-dominant hand
RTmean and SDRT are in millisecond (ms); FTSD and FTSND are in average number of taps per 10 s
*Calculated by repeated measures ANOVA
aThe numbers 1, 2, 3, and 4 represent Systems 1, 2, 3, and 4, respectively. Analyzed by Bonferroni
If performance differed by computer familiarity group, further analysis would be required to compare test systems stratifying by computer familiarity. Therefore, test results from Groups I, II, and III were compared for different systems (Table 3), even though this study did not primarily aim to assess the effect of computer familiarity on the performance of computerized neurobehavioral tests. Since the general characteristics differed by each group, the results had to be adjusted by age and the length of formal education.
Table 3
Performance on the KCNT between computer familiarity groups by test systems
System 1 a desktop computer equipped with a conventional 106-key keyboard, System 2 a desktop computer equipped with a simplified 17-key keyboard, System 3 a tablet PC with an on-screen keyboard, System 4 a tablet PC equipped with a simplified 17-key keyboard, SE standard error, SRT simple reaction time, CRT choice reaction time, DA digit addition, SDS symbol-digit substitution, FTS finger tapping speed, RT
mean
mean reaction time, SD
RT
standard deviation of reaction time, Rate
CR
correct response rate, FTS
D
finger tapping speed of dominant hand, FTS
ND
finger tapping speed of non-dominant hand, Group I participants with typing speed of near zero (no competency using computers), Group II participants with typing speed less than 200 characters/min (relatively familiar with computers), Group III participants with typing speed of 200 characters/min or greater (very familiar with computers)
RTmean and SDRT are in millisecond (ms); FTSD and FTSND are in average number of taps per 10 s
†Calculated by ANCOVA
aMean and SE are estimates adjusted by age and education as covariates
bThe numbers 1, 2, and 3 represent Group I, Group II, and Group III, respectively. Analyzed by Bonferroni
The mean reaction time for the SRT test, correct response rate for the DA test, and mean reaction time for the SDS test showed significant differences among the computer familiarity groups. Post-hoc analyses revealed that the performance of Group II for the SRT test was consistently lower than that of Group I throughout the test systems. Group I had the lowest correct response rate for the DA test when tested with Systems 1, 2, and 3. For the SDS test, Group I showed lower performance in terms of reaction time than Group II when tested with System 2 and 3.
Since performance differed by computer familiarity group (Table 3), the performance of each group classified by computer familiarity was evaluated by comparing test parameters among Systems 1, 2, 3, and 4 (Table 4).
Table 4
Performance on the KCNT between test systems by computer familiarity groups
System 1 a desktop computer equipped with a conventional 106-key keyboard, System 2 a desktop computer equipped with a simplified 17-key keyboard, System 3 a tablet PC with an on-screen keyboard, System 4 a tablet PC equipped with a simplified 17-key keyboard, SD standard deviation, SRT simple reaction time, CRT choice reaction time, DA digit addition, SDS symbol-digit substitution, FTS finger tapping speed, RT
mean
mean reaction time, SD
RT
standard deviation of reaction time, Rate
CR
correct response rate, FTS
D
finger tapping speed of dominant hand, FTS
ND
finger tapping speed of non-dominant hand, Group I participants with typing speed of near zero (no competency using computers), Group II participants with typing speed less than 200 characters/min (relatively familiar with computers), Group III participants with typing speed of 200 characters/min or greater (very familiar with computers)
RTmean and SDRT are in millisecond (ms); FTSD and FTSND are in average number of taps per 10 s
*Calculated by repeated measures ANOVA or Friedman test
aThe numbers 1, 2, 3, and 4 represent Systems 1, 2, 3, and 4, respectively. Analyzed by Bonferroni or Wilcoxon signed-rank test
bNot statistically significant in post-hoc analysis
The mean reaction time for the SRT test showed a significant difference between systems for all three groups, and the post-hoc analyses demonstrated that the mean reaction time for the SRT test was greater for Systems 3 and 4 than for Systems 1 and 2 for all three groups, which was consistent with the results reported in Table 2. However, there were significant differences between Systems 1 and 2 for Group I and between Systems 3 and 4 for Group II. The mean reaction time for the CRT test also showed a significant difference between systems for all groups, and the post-hoc analyses showed the similar results to those reported in Table 2. In all groups, the mean reaction times for the CRT test using Systems 1 and 2 did not show significant differences and were greater than that for System 3. Performance using System 4, however, was superior to that using System 3 for Group II and Group III. The mean reaction time for the SDS test showed no statistically significant difference between systems for all three groups. Finally, performance on the DA and FTS tests did not differ by type of system, for all three groups.
Discussion
Performance on the DA test did not differ significantly by test system. As for the FTS test, the performance using dominant hand did not demonstrate significant differences among test systems, but the test performed using non-dominant hand showed a significantly decreased performance in System 3 compared to Systems 1, 2 and 4. The DA test and the FTSD did not seem to be influenced by the type of computers and input devices. On the other hand, for the SRT and CRT tests, and to some extent the SDS test, performance decreased on the tablet PC versus the desktop computer.
We postulated that participants who were unfamiliar with computers might show inferior performance because they would find it more difficult to adapt to the newly introduced tablet PC system. However, the performance of each computer familiarity group on the test systems showed similar patterns. For the SRT and CRT tests, all three computer familiarity groups uniformly showed decreased performance when tested with Systems 3 and 4. Moreover, reaction time for the SDS test also showed homogenous results among these groups. Therefore, computer unfamiliarity did not appear to lead to the decreased performance on the KCNT when using the tablet PC.
Accordingly, use of a tablet PC for the KCNT to evaluate performance on the SRT and CRT tests is not recommended; however, tablet PCs with an on-screen keyboard may be used to administer the DA test, and only limitedly the SDS and FTS tests.
The only difference between Systems 1 and 2 was the input method, that is, the keyboard. The results of this study showed that overall performance in four out of five subtests was slightly higher using a simplified keyboard than using a conventional one, but these differences in performance were not shown to be statistically significant for all subtests (Table 2).
Considering these results, there was no significant difference between the conventional full-key keyboard and the simplified keyboard in this study. Nevertheless, previous studies demonstrated that using a relatively complex conventional 106-key keyboard may lower examinees’ performance compared to using a simplified keyboard, and therefore, use of a simplified keyboard was recommended [9, 14].
Systems 2 and 4 were a desktop computer and a tablet PC, respectively, both equipped with a simplified keyboard. The difference between these two systems was the size of the display with other conditions kept equivalent. The performance results between Systems 2 and 4 suggested that the size of the display did not influence the tests related to higher cognitive functions (i.e., DA and SDS tests) but did influence the tests related to simple and basic cognitive functions (i.e., SRT and CRT tests). Similarly, previous studies also reported that diminished stimuli dimension led to a latency in reaction time [23]. Moreover, size, contrast, and luminance of visual stimuli have been shown to be major determinants of detection threshold affecting neurobehavioral performance on computerized tests [24].
On the other hand, Kim et al. used a simplified keyboard and found a laptop and desktop computer only showed marginal differences in performance, which were not statistically significant [15]. However, we believe that only minor differences were found because there was not much difference in the size of the display: the monitor had a display with a diagonal length of 17 in. and that of the laptop computer was 15 in. Kim’s study implies that, if the size of the display is similar, the platform of the KCNT system, whether a desktop or laptop computer, will not affect performance significantly.
Despite the aforementioned efforts to explain the results, it is not possible to claim with certainty that the size of stimuli was the only difference between System 2 and System 4 influencing the participants’ performance, because we have not compared a desktop computer against a tablet PC with similar screen sizes. However, it is certain that performance significantly differed when using the desktop computer versus tablet PC.
Systems 3 and 4 were based on a tablet PC with the same display size but different input devices. An on-screen keyboard was implemented in System 3 and a simplified keyboard was used in System 4. To our surprise, Systems 3 and 4 did not show any performance differences for almost all parameters except for the CRT and FTS tests, similar to how Systems 1 and 2 showed similar performances (Table 3). Although the difference in mean reaction time for the CRT test between Systems 3 and 4 was only 58.5 ± 81.2 ms, it was indeed statistically significant at p < 0.05. FTSND also showed a difference (3.2 ± 5.9 taps, p < 0.001), whereas FTSD did not.
It seems that change of input method does not greatly influence the results of tests involving higher-order cognitive functions that require longer reaction times, such as the DA and SDS tests. Likewise, basic tasks such as the SRT and FTSD tests barely require examinees to scan the keyboard because tapping a spacebar or a control key is all that is needed to complete the tests. Hence, no differences were observed between an on-screen keyboard and a simplified keyboard.
The CRT test, on the other hand, demands examinees to perceive stimuli on the display, scan arrow keys on the keyboard, and give correct responses as quickly as possible. Our interpretation of the results is that the simplified keyboard with tactile feedback was superior to the on-screen keyboard in such a test. While physical keyboards offer visual-auditory-tactile feedback, on-screen keyboards only provide visual-auditory feedback. The results of this study implied that the contribution of tactile feedback to the test performance was more substantial on non-dominant hand than dominant hand for the FTS test and on the CRT test than the SRT test. Numerous previous studies reported that tactile feedback improves performance of various tasks [25–28]. The fact that a conventional 106-key keyboard and a 17-key simplified keyboard provide the same type of feedback also explains why there was no significant difference for the CRT between Systems 1 and 2.
Software and touchscreen latency
The KCN software used in this study was the KCN system by MaxMedica Inc. In its user’s guide, the minimum requirements for the system, such as the operating system, central processing unit, memory, disk space, and the display resolution, are clearly specified [29]. In this study, the desktop and tablet PC system both met these requirements. Therefore, it was reasonable to assume that they would produce results with the same level of accuracy. In addition, the maximum theoretical polling rate of a standard keyboard is 1000 Hz (i.e., every 1 ms), and the standard report rate of a capacitive screen digitizer installed on a mobile device is approximately 100 Hz (i.e., every 10 ms) [30]. However, the similar performance of the KCNT between Systems 3 and 4 implies that “touchscreen latency” was not a major contributor to consistently decreased performance on the tablet PC compared to that on the desktop computer. Given that the input device, whether the simplified keyboard or the on-screen keyboard, did not significantly influence the responsiveness of the participants, we carefully assume that the latency would have been reflected in the difference in the mean reaction time of the SRT test between Systems 3 and 4, which was at most 22.4 ms.
Standard deviation of the reaction time
The SDRT for the CRT test was significantly larger when performed on the desktop computer than on the tablet PC (Tables 2 and 4), and it was also significantly larger for the SRT test on the desktop computer compared to the tablet PC in all three computer familiarity groups (Table 4). It suggests that the variability of the test results is greater on the tablet PC and also that the tests are less reliable than those performed on the desktop computer. Therefore, along with the decreased performance demonstrated in this study, it would not be recommended to build a test system with a tablet PC.
The relatively small number of participants in the computer familiarity groups is a limitation of this study. There were only 9 participants in Group I, whereas Groups II and III had 23 and 40 participants, respectively. This was because most participants were somewhat familiar with the use of computers. With the current high level of computer literacy in the population, obtaining a large number of participants unfamiliar with computers would require a much larger number of overall participants.
Conclusions
This study evaluated and assessed performance on the KCNT in four different settings. It is not recommended to use a tablet PC for the KCNT to evaluate neurobehavioral performance for the SRT and CRT tests; however, tablet PCs with an on-screen keyboard may be used to perform the DA test, and only limitedly the SDS and FTS tests.
The datasets generated in the study are available from the authors upon reasonable request.
Abbreviations
CRT
Choice reaction time
DA
Digit addition
DC
Digit classification
FTS
Finger tapping speed
FTSD
Average number of taps per 10 s using dominant hand
FTSND
Average number of taps per 10 s using non-dominant hand
KCNT
Korean Computerized Neurobehavioral Test
RateCR
Correct response rate
RTmean
Mean reaction time
SDRT
Standard deviation of reaction time
SDS
Symbol digit substitution
SRT
Simple reaction time
- 1. http://www.pewglobal.org/files/2016/02/pew_research_center_global_technology_report_final_february_22__2016.pdf.
- 2. http://www.emarketer.com/Article/Tablet-Users-Surpass-1-Billion-Worldwide-2015/1011806.
- 3. http://apps.who.int/iris/bitstream/10665/44607/1/9789241564250_eng.pdf.
- 4. http://sev.iseverance.com/2013_common/include/board/download.asp?con_no=46758&obj_no=50808.
- 5. Schlechtweg PM, Kammerer FJ, Seuss H, Uder M, Hammon M. Mobile image interpretation: diagnostic performance of CT exams displayed on a tablet computer in detecting abdominopelvic hemorrhage. J Digit Imaging 2016;29:183–188. 10.1007/s10278-015-9829-x. 26438423.ArticlePubMedPMCPDF
- 6. Fleischmann R, Duhm J, Hupperts H, Brandt SA. Tablet computers with mobile electronic medical records enhance clinical routine and promote bedside time: a controlled prospective crossover study. J Neurol 2015;262:532–540. 10.1007/s00415-014-7581-7. 25476692.ArticlePubMedPMCPDF
- 7. Crowson MG, Kahmke R, Ryan M, Scher R. Utility of daily mobile tablet use for residents on an otolaryngology head & neck surgery inpatient service. J Med Syst 2016;40:55. 10.1007/s10916-015-0419-8. 26645319.ArticlePubMedPDF
- 8. Motulsky A, Wong J, Cordeau J-P, Pomalaza J, Barkun J, Tamblyn R. Using mobile devices for inpatient rounding and handoffs: an innovative application developed and rapidly adopted by clinicians in a pediatric hospital. J Am Med Inform Assoc 2017;24:e69–e78. 27554824.ArticlePubMedPMCPDF
- 9. Jeon M-J, Kim C-Y, Chung J-H, Lim W-T, Sakong J. Effects of familiarity with computer and type of keyboard on computerized neurobehavioral performance tests. Korean J Occup Environ Med. 2004;16:178–190.ArticlePDF
- 10. Sakong J, Chung J-H, Lee H-Y. Interrelation of neuropsychiatric symptom and neurobehavioral test among workers exposed to organic solvents. Korean J Occup Environ Med. 1997;9:49–60.ArticlePDF
- 11. Chung J-H, Kim C-Y, SaKong J, Jeon M-J, Park H-C. Development of Korean neurobehavioral test battery -assessment of the validity of traditional and computerized neurobehavioral tests. J Prev Med Pub Health 1998;31:692–707.
- 12. Sakong J, Jeon M-J, Sung N-J, Kim G-T. Impact of subjects’ characteristics and test conditions on reliability of neurobehavioral tests. Korean J Occup Environ Med 2003;15:188–195.
- 13. Sakong J, Chung J-H, Jeon M-J, Shin M-S. Evaluation of reliability of traditional and computerized neurobehavioral tests. Korean J Occup Environ Med. 2000;12:494–500.ArticlePDF
- 14. Baek NJ, Park GI, Byun YS, Jeon MJ, Sakong J. Effects of computer familiarity and computer type on the performance of Korean computerized neurobehavioral test. Ann Occup Environ Med 2016;28:44. 10.1186/s40557-016-0129-9. 27617101.ArticlePubMedPMCPDF
- 15. Kim G-T, Kim C-Y, Sakong J. Effect of the type of computer on computerized neurobehavioral performance tests. Korean J Occup Environ Med. 2004;16:276–286.ArticlePDF
- 16. Kim Y-C, Jeon M-J, Hong Y-C, Lee C-G, Ha M-N, Kwon H-J, et al. Association between blood lead concentration and computerized neurobehavioral performance in Korean elementary school students. Korean J Occup Environ Med. 2011;23:183–191.ArticlePDF
- 17. Sakong J, Jeon M-J, Yun S-H, Hong Y-C, Lee C-G, Kim Y-K, et al. Association of blood mercury level and neurobehavioral performance in Korean elementary school students. Korean J Occup Environ Med. 2010;22:324–330.ArticlePDF
- 18. Jeon MJ. Neurobehavioral performance in fishery divers suffered from decompression sickness. Kosin Med J 2008;23:182–187.
- 19. Sakong J, Baek S-O, Jeon M-J. Formaldehyde, volatile organic compounds inside newly produced vehicle and neurobehavioral performance of vehicle drivers. J Korean Soc Indoor Environ 2009;6:111–122.
- 20. Kim D-S, Kim S-J, Park S-Y, Jeon M-J, Kim G-T, Kim C-Y, et al. The effects of indoor air quality on the neurobehavioral performance of elementary school children. Korean J Occup Environ Med. 2007;19:65–72.ArticlePDF
- 21. U.S. National Committee for the International Union of Psychological Science, Commission on Behavioral and Social Sciences and Education, Division of Behavioral and Social Sciences and Education, National Research Council. Behavioral measures of neurotoxicity. 1990, Washington, DC: National Academies Press.
- 22. Weiss B, Elsner J. Risk assessment for neurobehavioral toxicity. 1997, Darby: DIANE Publishing.
- 23. Kim JS, Kim SA, Lee CY, Park SW, Nam SH, Lee JY, et al. Effects of number and method of visual stimuli on simple reaction time. Korean J Occup Environ Med. 1996;8:477–489.ArticlePDF
- 24. Hudnell HK, Otto DA, House DE. The influence of vision on computerized neurobehavioral test scores: a proposal for improving test protocols. Neurotoxicol Teratol 1996;18:391–400. 10.1016/0892-0362(96)00040-2. 8866529.ArticlePubMed
- 25. Viau A, Najm M, Chapman CE, Levin MF. Effect of tactile feedback on movement speed and precision during work-related tasks using a computer mouse. Hum Factors 2005;47:816–826. 10.1518/001872005775571023. 16553068.ArticlePubMedPDF
- 26. Burke JL, Prewett MS, Gray AA, Yang L, Stilson FRB, Coovert MD, et al. Comparing the effects of visual-auditory and visual-tactile feedback on user performance: a meta-analysis. Proc 8th Int Conf Multimodal Interfaces. 2006, Banff: ACM; 108–117.
- 27. Santos-Carreras L, Leuenberger K, Samur E, Gassert R, Bleuler H. Tactile feedback improves performance in a palpation task: results in a VR-based testbed. Presence Teleoperators Virtual Environ 2012;21:435–451. 10.1162/PRES_a_00126.Article
- 28. Rabin E, Chen J, Muratori L, DiFrancisco-Donoghue J, Werner WG. Haptic feedback from manual contact improves balance control in people with Parkinson’s disease. Gait Posture 2013;38:373–379. 10.1016/j.gaitpost.2012.12.008. 23313411.ArticlePubMedPMC
- 29. MaxMedica Inc. KCN Test User’s Guide. 2012, Seoul: MaxMedica Inc..
- 30. https://docs.microsoft.com/en-us/previous-versions/windows/hardware/cert-program/devicedigitizer-requirements.
REFERENCES
Notes
Figure & Data
REFERENCES
Citations
Citations to this article as recorded by 
- How Do ImPACT Quick Test Scores Compare with ImPACT Online Scores in Non-Concussed Adolescent Athletes?
R J Elbin, Nathan R D’Amico, Matthew McCarthy, Melissa N Womble, Sydne O’Connor, Philip Schatz
Archives of Clinical Neuropsychology.2020; 35(3): 326. CrossRef
 Cite
CitePerformance assessment on the Korean Computerized Neurobehavioral Test using a mobile device and a conventional computer: an experimental study
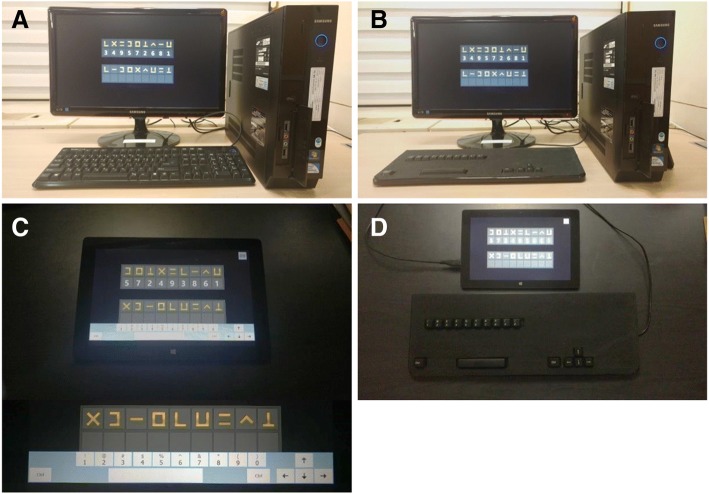
Fig. 1
The test systems. Four different test systems were used in this study: a System 1, a desktop computer equipped with a conventional 106-key keyboard; b System 2, a desktop computer equipped with a simplified 17-key keyboard; c System 3, a tablet PC with an on-screen keyboard; d System 4, a tablet PC equipped with a simplified 17-key keyboard
Fig. 1
Performance assessment on the Korean Computerized Neurobehavioral Test using a mobile device and a conventional computer: an experimental study
| Characteristics | n (%) | Mean (SD) |
|---|---|---|
| Age (years) | ||
| 20–29 | 22 (30.6) | 40.3 (12.8) |
| 30–39 | 14 (19.4) | |
| 40–49 | 14 (19.4) | |
| 50–59 | 16 (22.2) | |
| ≥ 60 | 6 (8.4) | |
| Sex | ||
| Male | 36 (50.0) | |
| Female | 36 (50.0) | |
| Education | ||
| Elementary school | 0 (0.0) | |
| Middle school | 1 (1.4) | |
| High school | 14 (19.5) | |
| University/College | 52 (72.2) | |
| Post-graduate school | 5 (6.9) | |
| Typing speeda | ||
| Group I | 9 (12.5) | 258.2 (164.5) |
| Group II | 23 (31.9) | |
| Group III | 40 (55.6) | |
| Total | 72 (100.0) | |
| KCNT | Type of system | F-value | p-value* | Post-hoca | |||
|---|---|---|---|---|---|---|---|
| System 1 | System 2 | System 3 | System 4 | ||||
| Mean (SD) | Mean (SD) | Mean (SD) | Mean (SD) | ||||
| SRT | |||||||
| RTmean | 391.0 (133.6) | 381.1 (131.6) | 532.7 (177.7) | 510.3 (193.4) | 150.670 | < 0.001 | (3 = 4) > (1 = 2) |
| SDRT | 71.5 (70.3) | 72.2 (47.0) | 115.0 (133.9) | 123.1 (270.1) | 2.528 | 0.098 | |
| RateCR | 0.998 (0.010) | 1.000 (0.004) | 0.997 (0.010) | 0.997 (0.011) | 1.282 | 0.282 | |
| CRT | |||||||
| RTmean | 590.6 (107.4) | 593.0 (117.2) | 750.4 (116.1) | 691.9 (109.2) | 171.785 | < 0.001 | 3 > 4 > (2 = 1) |
| SDRT | 95.2 (35.6) | 105.8 (53.6) | 124.8 (58.0) | 114.8 (47.2) | 6.105 | 0.001 | (3 = 4) > 1 |
| RateCR | 0.994 (0.014) | 0.994 (0.013) | 0.991 (0.018) | 0.996 (0.009) | 1.714 | 0.176 | |
| DA | |||||||
| RTmean | 2518.4 (534.1) | 2498.6 (496.7) | 2557.8 (463.4) | 2513.2 (545.6) | 1.068 | 0.364 | |
| SDRT | 497.3 (320.6) | 508.9 (351.1) | 539.9 (287.2) | 527.8 (375.8) | 0.528 | 0.664 | |
| RateCR | 0.865 (0.161) | 0.852 (0.144) | 0.870 (0.148) | 0.862 (0.161) | 0.403 | 0.751 | |
| SDS | |||||||
| RTmean | 2016.7 (397.8) | 2018.4 (339.2) | 2013.3 (385.3) | 2025.9 (364.8) | 0.099 | 0.961 | |
| SDRT | 534.4 (369.6) | 534.1 (200.7) | 616.9 (286.2) | 612.1 (255.0) | 2.624 | 0.058 | |
| RateCR | 0.988 (0.023) | 0.988 (0.020) | 0.970 (0.042) | 0.978 (0.036) | 6.824 | < 0.001 | 3 < (2 = 1) |
| FTS | |||||||
| FTSD | 72.0 (8.5) | 72.3 (8.3) | 71.3 (9.5) | 72.0 (8.3) | 1.053 | 0.350 | |
| FTSND | 65.4 (8.9) | 66.2 (9.2) | 63.0 (9.4) | 66.2 (9.0) | 13.378 | < 0.001 | (2 = 4 = 1) > 3 |
| KCNT | Type of system | Computer familiarity | F-value | p-value† | Post-hocb | |||
|---|---|---|---|---|---|---|---|---|
| Group I | Group II | Group III | ||||||
| Mean (SE)a | Mean (SE)a | Mean (SE)a | ||||||
| SRT | RTmean | System 1 | 265.3 (58.1) | 422.7 (30.6) | 401.0 (26.9) | 4.353 | 0.017 | 2 > 1 |
| System 2 | 222.4 (56.6) | 407.7 (29.8) | 401.6 (26.2) | 6.126 | 0.004 | 2 > 1 | ||
| System 3 | 341.4 (72.7) | 568.0 (38.3) | 555.4 (33.7) | 5.576 | 0.006 | 2 > 1 | ||
| System 4 | 333.2 (83.3) | 540.1 (43.9) | 533.0 (38.6) | 3.521 | 0.035 | 2 > 1 | ||
| SDRT | System 1 | 49.1 (35.0) | 65.6 (18.4) | 79.9 (16.2) | 0.231 | 0.794 | ||
| System 2 | 46.7 (22.9) | 78.8 (12.1) | 74.2 (10.6) | 1.169 | 0.317 | |||
| System 3 | 51.0 (65.5) | 98.5 (34.5) | 138.8 (30.3) | 0.537 | 0.587 | |||
| System 4 | 64.7 (130.5) | 128.6 (68.8) | 133.1 (60.4) | 0.135 | 0.874 | |||
| RateCR | System 1 | 0.994 (0.005) | 0.997 (0.002) | 0.999 (0.002) | 0.303 | 0.739 | ||
| System 2 | 1.000 (0.002) | 1.000 (0.001) | 1.000 (0.001) | 0.032 | 0.969 | |||
| System 3 | 0.993 (0.005) | 0.997 (0.003) | 0.999 (0.002) | 0.435 | 0.649 | |||
| System 4 | 0.991 (0.005) | 0.999 (0.003) | 0.997 (0.002) | 1.596 | 0.210 | |||
| CRT | RTmean | System 1 | 616.5 (39.4) | 592.5 (20.8) | 583.7 (18.2) | 0.236 | 0.791 | |
| System 2 | 645.6 (48.1) | 594.5 (25.3) | 580.3 (22.3) | 0.679 | 0.511 | |||
| System 3 | 735.0 (42.0) | 745.2 (22.1) | 756.9 (19.4) | 0.085 | 0.919 | |||
| System 4 | 721.1 (41.0) | 679.3 (21.6) | 692.6 (19.0) | 0.697 | 0.502 | |||
| SDRT | System 1 | 119.7 (16.1) | 112.9 (8.5) | 79.5 (7.5) | 3.160 | 0.049 | 2 > 3 | |
| System 2 | 124.5 (25.4) | 127.6 (13.4) | 89.1 (11.8) | 1.698 | 0.191 | |||
| System 3 | 116.6 (28.5) | 135.7 (15.0) | 120.4 (13.2) | 0.500 | 0.609 | |||
| System 4 | 101.0 (22.6) | 120.6 (11.9) | 114.7 (10.5) | 0.492 | 0.614 | |||
| RateCR | System 1 | 0.985 (0.007) | 0.997 (0.004) | 0.994 (0.003) | 1.920 | 0.155 | ||
| System 2 | 0.995 (0.006) | 0.998 (0.003) | 0.992 (0.003) | 0.900 | 0.411 | |||
| System 3 | 0.995 (0.009) | 0.988 (0.005) | 0.992 (0.004) | 0.403 | 0.670 | |||
| System 4 | 0.987 (0.004) | 0.995 (0.002) | 0.999 (0.002) | 2.119 | 0.128 | |||
| DA | RTmean | System 1 | 2684.4 (248.5) | 2803.4 (131.0) | 2317.1 (115.1) | 3.006 | 0.056 | |
| System 2 | 2768.9 (238.0) | 2660.4 (125.5) | 2344.8 (110.3) | 1.349 | 0.267 | |||
| System 3 | 2644.9 (217.0) | 2727.1 (114.4) | 2440.9 (100.5) | 1.394 | 0.255 | |||
| System 4 | 2617.7 (265.7) | 2703.8 (140.1) | 2380.0 (123.1) | 1.178 | 0.314 | |||
| SDRT | System 1 | 466.1 (157.4) | 593.9 (83.0) | 448.7 (72.9) | 1.059 | 0.353 | ||
| System 2 | 565.0 (174.6) | 500.2 (92.1) | 501.3 (80.9) | 0.079 | 0.925 | |||
| System 3 | 641.2 (141.3) | 628.9 (74.5) | 465.9 (65.5) | 0.966 | 0.386 | |||
| System 4 | 696.8 (184.7) | 638.1 (97.4) | 426.3 (85.6) | 0.986 | 0.379 | |||
| RateCR | System 1 | 0.645 (0.067) | 0.853 (0.036) | 0.921 (0.031) | 5.830 | 0.005 | 1 < (2 = 3) | |
| System 2 | 0.625 (0.059) | 0.791 (0.031) | 0.939 (0.027) | 8.408 | 0.001 | 1 < 2 < 3 | ||
| System 3 | 0.680 (0.061) | 0.868 (0.032) | 0.913 (0.028) | 5.544 | 0.006 | 1 < (2 = 3) | ||
| System 4 | 0.704 (0.070) | 0.857 (0.037) | 0.901 (0.033) | 2.852 | 0.065 | |||
| SDS | RTmean | System 1 | 2328.7 (143.1) | 2045.3 (75.4) | 1930.0 (66.3) | 2.564 | 0.085 | |
| System 2 | 2280.2 (111.0) | 2006.8 (58.5) | 1966.2 (51.4) | 3.461 | 0.037 | 1 > 2 | ||
| System 3 | 2306.9 (120.9) | 1984.4 (63.7) | 1963.8 (56.0) | 4.019 | 0.022 | 1 > 2 | ||
| System 4 | 2215.2 (129.2) | 2021.8 (68.1) | 1985.7 (59.8) | 1.292 | 0.282 | |||
| SDRT | System 1 | 836.6 (164.4) | 521.8 (86.7) | 473.7 (76.2) | 2.095 | 0.131 | ||
| System 2 | 635.8 (94.5) | 460.4 (49.8) | 553.6 (43.8) | 2.822 | 0.067 | |||
| System 3 | 819.3 (135.8) | 585.8 (71.6) | 589.2 (62.9) | 1.681 | 0.194 | |||
| System 4 | 709.1 (118.7) | 558.1 (62.6) | 621.3 (55.0) | 1.183 | 0.313 | |||
| RateCR | System 1 | 0.979 (0.011) | 0.989 (0.006) | 0.990 (0.005) | 0.466 | 0.630 | ||
| System 2 | 0.991 (0.010) | 0.993 (0.005) | 0.984 (0.005) | 0.656 | 0.522 | |||
| System 3 | 0.946 (0.021) | 0.968 (0.011) | 0.976 (0.010) | 0.740 | 0.481 | |||
| System 4 | 0.962 (0.018) | 0.982 (0.009) | 0.979 (0.008) | 0.791 | 0.458 | |||
| FTS | FTSD | System 1 | 69.6 (3.9) | 69.7 (2.0) | 73.8 (1.8) | 0.820 | 0.445 | |
| System 2 | 69.3 (3.7) | 70.0 (2.0) | 74.2 (1.7) | 0.913 | 0.406 | |||
| System 3 | 69.1 (4.3) | 71.6 (2.3) | 71.5 (2.0) | 0.186 | 0.830 | |||
| System 4 | 68.6 (3.9) | 70.9 (2.1) | 73.4 (1.8) | 0.457 | 0.635 | |||
| FTSND | System 1 | 59.2 (4.0) | 64.5 (2.1) | 67.2 (1.8) | 1.273 | 0.287 | ||
| System 2 | 58.2 (4.1) | 65.1 (2.2) | 68.7 (1.9) | 2.058 | 0.136 | |||
| System 3 | 57.0 (4.2) | 63.2 (2.2) | 64.3 (1.9) | 1.279 | 0.285 | |||
| System 4 | 59.1 (4.1) | 67.4 (2.2) | 67.2 (1.9) | 2.327 | 0.105 | |||
| KCNT | Computer familiarity | Type of system | F or χ2 | p-value* | Post-hoca | ||||
|---|---|---|---|---|---|---|---|---|---|
| System 1 | System 2 | System 3 | System 4 | ||||||
| Mean (SD) | Mean (SD) | Mean (SD) | Mean (SD) | ||||||
| SRT | RTmean | Group I | 355.2 (36.8) | 320.9 (48.9) | 490.2 (28.6) | 453.2 (48.2) | 60.757 | < 0.001 | (3 = 4) > 1 > 2 |
| Group II | 425.6 (163.5) | 415.3 (148.7) | 575.1 (203.2) | 535.2 (186.2) | 59.296 | < 0.001 | 3 > 4 > (1 = 2) | ||
| Group III | 379.1 (126.4) | 375.0 (130.3) | 517.9 (179.8) | 508.9 (216.7) | 87.240 | < 0.001 | (3 = 4) > (1 = 2) | ||
| SDRT | Group I | 65.6 (41.0) | 59.2 (37.1) | 92.5 (46.0) | 90.8 (40.1) | 11.800 | 0.008 | 4 > 1 | |
| Group II | 70.8 (37.7) | 79.8 (51.7) | 103.5 (70.8) | 101.4 (96.3) | 15.887 | 0.001 | 3 > (2 = 1) | ||
| Group III | 73.2 (88.6) | 70.8 (46.5) | 126.6 (170.4) | 142.8 (355.4) | 16.620 | 0.001 | 3 > (1 = 2) | ||
| RateCR | Group I | 0.997 (0.010) | 1.000 (0.000) | 0.993 (0.014) | 0.993 (0.014) | 3.000 | 0.392 | ||
| Group II | 0.999 (0.007) | 1.000 (0.000) | 0.997 (0.013) | 1.000 (0.000) | 2.000 | 0.572 | |||
| Group III | 0.998 (0.011) | 0.999 (0.005) | 0.998 (0.007) | 0.996 (0.013) | 1.979 | 0.577 | |||
| CRT | RTmean | Group I | 716.2 (111.3) | 714.5 (165.7) | 862.8 (73.4) | 822.3 (121.2) | 15.838 | 0.001 | (3 = 4) > (1 = 2) |
| Group II | 633.3 (99.3) | 630.0 (104.6) | 803.0 (92.0) | 725.0 (96.1) | 51.470 | < 0.001 | 3 > 4 > (1 = 2) | ||
| Group III | 537.8 (73.1) | 544.3 (81.2) | 694.9 (104.6) | 643.6 (80.7) | 133.278 | < 0.001 | 3 > 4 > (2 = 1) | ||
| SDRT | Group I | 105.1 (50.6) | 100.6 (37.1) | 114.1 (21.9) | 113.9 (51.9) | 0.306 | 0.820 | ||
| Group II | 111.0 (34.5) | 123.6 (77.9) | 137.9 (70.2) | 129.4 (50.0) | 2.374 | 0.499 | |||
| Group III | 83.8 (28.5) | 96.8 (35.4) | 119.7 (55.7) | 106.7 (43.6) | 22.110 | < 0.001 | (3 = 4) > 1 | ||
| RateCR | Group I | 0.993 (0.015) | 0.995 (0.009) | 0.991 (0.015) | 0.993 (0.010) | 0.643 | 0.887 | ||
| Group II | 1.000 (0.000) | 0.998 (0.006) | 0.987 (0.021) | 0.997 (0.007) | 14.211 | 0.003 | 3 < 1 | ||
| Group III | 0.991 (0.017) | 0.991 (0.016) | 0.993 (0.017) | 0.996 (0.010) | 3.182 | 0.364 | |||
| DA | RTmean | Group I | 2624.4 (534.6) | 2709.1 (490.3) | 2715.3 (246.9) | 2562.7 (270.8) | 0.597 | 0.623 | |
| Group II | 2718.3 (553.1) | 2611.4 (525.7) | 2738.1 (480.4) | 2660.8 (510.7) | 5.087 | 0.166 | |||
| Group III | 2379.6 (492.1) | 2386.4 (461.8) | 2418.8 (451.2) | 2417.1 (597.4) | 3.540 | 0.316 | |||
| SDRT | Group I | 396.0 (230.1) | 507.1 (334.2) | 530.3 (326.1) | 551.9 (413.2) | 0.867 | 0.833 | ||
| Group II | 559.9 (384.4) | 477.0 (213.9) | 580.2 (285.7) | 566.5 (319.2) | 3.783 | 0.286 | |||
| Group III | 484.0 (296.7) | 527.7 (418.0) | 518.9 (284.3) | 500.1 (403.5) | 2.190 | 0.534 | |||
| RateCR | Group I | 0.653 (0.295) | 0.688 (0.143) | 0.674 (0.298) | 0.674 (0.301) | 0.067 | 0.977 | ||
| Group II | 0.848 (0.117) | 0.810 (0.127) | 0.886 (0.097) | 0.848 (0.133) | 7.415 | 0.060 | |||
| Group III | 0.922 (0.089) | 0.914 (0.115) | 0.905 (0.079) | 0.913 (0.088) | 3.375 | 0.337 | |||
| SDS | RTmean | Group I | 2591.9 (550.5) | 2555.1 (307.8) | 2647.1 (392.5) | 2508.6 (364.8) | 1.267 | 0.737 | |
| Group II | 2132.5 (245.0) | 2114.5 (220.6) | 2112.9 (283.1) | 2157.3 (293.3) | 2.113 | 0.549 | |||
| Group III | 1820.6 (261.6) | 1842.4 (242.8) | 1813.3 (232.1) | 1841.7 (260.1) | 0.810 | 0.847 | |||
| SDRT | Group I | 885.4 (932.6) | 691.0 (223.0) | 846.0 (362.8) | 802.4 (299.2) | 3.267 | 0.352 | ||
| Group II | 481.8 (133.3) | 491.7 (136.5) | 587.7 (146.2) | 616.7 (275.4) | 4.604 | 0.014 | 3 > 1 | ||
| Group III | 485.7 (166.8) | 523.1 (213.9) | 582.1 (310.2) | 566.6 (216.3) | 4.950 | 0.175 | |||
| RateCR | Group I | 0.985 (0.024) | 0.988 (0.020) | 0.957 (0.028) | 0.960 (0.065) | 9.182 | 0.027 | b | |
| Group II | 0.993 (0.024) | 0.993 (0.015) | 0.975 (0.041) | 0.982 (0.033) | 6.843 | 0.077 | |||
| Group III | 0.987 (0.023) | 0.985 (0.023) | 0.969 (0.045) | 0.980 (0.028) | 4.727 | 0.193 | |||
| FTS | FTSD | Group I | 67.7 (10.1) | 66.9 (8.4) | 65.6 (7.8) | 66.9 (9.3) | 0.982 | 0.373 | |
| Group II | 68.7 (6.3) | 68.9 (6.3) | 69.0 (9.1) | 70.0 (6.7) | 0.704 | 0.474 | |||
| Group III | 74.9 (8.2) | 75.4 (8.1) | 73.8 (9.5) | 74.3 (8.3) | 1.216 | 0.302 | |||
| FTSND | Group I | 57.6 (7.2) | 57.6 (7.4) | 55.2 (10.2) | 57.2 (8.4) | 1.418 | 0.262 | ||
| Group II | 63.1 (7.0) | 64.4 (7.1) | 61.2 (8.4) | 66.2 (7.4) | 14.175 | < 0.001 | 3 < (2 = 4) and (3 = 1) < 4 | ||
| Group III | 68.4 (8.9) | 69.2 (9.2) | 65.9 (8.7) | 68.2 (9.0) | 18.223 | < 0.001 | 3 < (1 = 2) | ||
Table 1
General characteristics of all participants
aNumber of Korean characters typed in a minute
Table 2
Performance on the KCNT between test systems
RTmean and SDRT are in millisecond (ms); FTSD and FTSND are in average number of taps per 10 s
*Calculated by repeated measures ANOVA
aThe numbers 1, 2, 3, and 4 represent Systems 1, 2, 3, and 4, respectively. Analyzed by Bonferroni
Table 3
Performance on the KCNT between computer familiarity groups by test systems
RTmean and SDRT are in millisecond (ms); FTSD and FTSND are in average number of taps per 10 s
†Calculated by ANCOVA
aMean and SE are estimates adjusted by age and education as covariates
bThe numbers 1, 2, and 3 represent Group I, Group II, and Group III, respectively. Analyzed by Bonferroni
Table 4
Performance on the KCNT between test systems by computer familiarity groups
RTmean and SDRT are in millisecond (ms); FTSD and FTSND are in average number of taps per 10 s
*Calculated by repeated measures ANOVA or Friedman test
aThe numbers 1, 2, 3, and 4 represent Systems 1, 2, 3, and 4, respectively. Analyzed by Bonferroni or Wilcoxon signed-rank test
bNot statistically significant in post-hoc analysis

