
Articles
- Page Path
- HOME > Ann Occup Environ Med > Volume 28; 2016 > Article
- Research Article The effect of aircraft noise on sleep disturbance among the residents near a civilian airport: a cross-sectional study
- Kyeong Min Kwak1,2, Young-Su Ju1, Young-Jun Kwon1, Yun Kyung Chung1, Bong Kyu Kim1,2, Hyunjoo Kim3, Kanwoo Youn4
-
Annals of Occupational and Environmental Medicine 2016;28(1):38.
DOI: https://doi.org/10.1186/s40557-016-0123-2
Published online: September 2, 2016
1Department of Occupational and Environmental Medicine, Hallym University Sacred Heart Hospital, Anyang, South Korea
2Department of Occupational and Environmental Health, Graduate School of Public Health, Seoul National University, Seoul, South Korea
3Department of Occupational and Environmental Medicine, Ewha Womans University Mokdong Hospital, Seoul, South Korea
4Department of Occupational and Environmental Medicine, Wonjin Institute for Occupational and Environmental Health Green Hospital, Seoul, South Korea
• Received: March 13, 2016 • Accepted: August 22, 2016
© The Author(s). 2016
Open AccessThis article is distributed under the terms of the Creative Commons Attribution 4.0 International License (http://creativecommons.org/licenses/by/4.0/), which permits unrestricted use, distribution, and reproduction in any medium, provided you give appropriate credit to the original author(s) and the source, provide a link to the Creative Commons license, and indicate if changes were made. The Creative Commons Public Domain Dedication waiver (http://creativecommons.org/publicdomain/zero/1.0/) applies to the data made available in this article, unless otherwise stated.
Abstract
-
Background Aircraft noise is a major environmental noise problem. This study was conducted in order to investigate the relationship between sleep disturbance and exposure to aircraft noise on the residents who are living near an airport.
-
Methods There were 3308 residents (1403 in the high exposure group, 1428 in the low exposure group, and 477 in the non-exposure group) selected as the subjects for this study. The Insomnia severity Index (ISI) and Epworth Sleepiness Scale (ESS) questionnaires were used to evaluate sleep disturbance.
-
Results The mean ISI and ESS scores were 6.9 ± 6.4 and 5.5 ± 3.7, respectively, and the average scores were significantly greater in the aircraft noise exposure group, as compared to the non-exposure group. The percentage of the abnormal subjects, which were classified according to the results of the ISI and ESS, was also significantly greater in the noise exposure group, as compared to the control group. The odd ratios for insomnia and daytime hypersomnia were approximately 3 times higher in the noise exposure group, as compared to the control group.
-
Conclusions The prevalence of insomnia and daytime hypersomnia was higher in the aircraft noise exposure group, as compared to the control group. Further study is deemed necessary in order to clarify the causal relationship.
Background
Noise is defined as any unwanted, or mentally or physically harmful sound [1]. As described in its definition, noise involves psychological factors as well as physiological features. As a result, it may unfavorably affect a person’s hearing ability or cause various health problems, such as hypertension [2], myocardial infarction [3], psychological disease [4], and sleep disturbance [5].
With the rapid growth of air traffic, aircraft noise has recently become a major environmental noise problem. The aircraft noise can affect a person’s hearing ability [6], blood pressure [7], mental health [8], and sleep quality [9, 10]. A continuous exposure to aircraft noise increases the frequency of waking up during sleep and decreases slow-wave sleep, sometimes called deep sleep. This condition can cause a decreased quality of sleep and sleep disturbance [9]. Sleep disturbance is an important health issue and it has been associated with other health problems [10]. Sleep deprivation, which is caused by sleep disturbance, is related to obesity, hypertension, diabetes, cardiovascular disease, depression, and increased risk of mortality [11–15]. Many studies have been conducted on the effect of aircraft noise on sleep [16, 17]; however, the population sizes of most studies are insufficient. There are only a few studies conducted in the large populations of more than 1000 subjects [18, 19]. Large population studies that directly evaluate sleep disturbance have not sufficiently supported the clear correlation between noises and sleep disturbance.
This study conducted a survey on more than 3000 subjects by using a structured questionnaire. The purpose of this study is to investigate the relationship between sleep disturbance and exposure to aircraft noise on residents who are living near an airport.
Methods
This study did not measure the aircraft noise level directly, but instead, we used the result of the aircraft noise measurement in the official announcement of the Seoul Regional Aviation Administration (SRAA) [20] that was issued on October 8, 2010. This announcement was based on the noise measurement of the areas near the Gimpo International Airport that was performed by noise specialists in 2008. For this measurement, 50 sites were chosen to measure the aircraft noise, and the Weighted Equivalent Continuous Perceived Noise Level (WECPNL) was used as the noise metric. The WECPNL was recommended by the International Civil Aviation Organization (ICAO) for measuring the aircraft noise [21]. The WECPNL used in Korea is defined as follows [22]:
[TeX:] \documentclass[12pt]{minimal}
\usepackage{amsmath}
\usepackage{wasysym}
\usepackage{amsfonts}
\usepackage{amssymb}
\usepackage{amsbsy}
\usepackage{mathrsfs}
\usepackage{upgreek}
\setlength{\oddsidemargin}{-69pt}
\begin{document}$$ \mathrm{WECPNL} = \kern0.5em {\overline{\mathrm{L}}}_{\mathrm{A}}\kern0.5em +\kern0.5em 10 \log \kern0.5em \left({\mathrm{N}}_2\kern0.5em +\kern0.5em 3{\mathrm{N}}_3\kern0.5em +\kern0.5em 10\left({\mathrm{N}}_1\kern0.5em +\kern0.5em {\mathrm{N}}_4\right)\right) - 27, $$\end{document}WECPNL = L ¯ A + 10 log N 2 + 3 N 3 + 10 N 1 + N 4 − 27 ,
where [TeX:] \documentclass[12pt]{minimal}
\usepackage{amsmath}
\usepackage{wasysym}
\usepackage{amsfonts}
\usepackage{amssymb}
\usepackage{amsbsy}
\usepackage{mathrsfs}
\usepackage{upgreek}
\setlength{\oddsidemargin}{-69pt}
\begin{document}$$ {\overline{\mathrm{L}}}_{\mathrm{A}} $$\end{document}L ¯ A  is the energy mean of all maximum aircraft noise level during daytime. N1 is the number of flight events during midnight from 00:00 to 07:00, N2 is the number of events during daytime from 07:00 to 19:00, N3 is the number of flight events during nighttime from 19:00 to 22:00, and N4 is the number of flight events during late nighttime from 22:00 to 24:00.
is the energy mean of all maximum aircraft noise level during daytime. N1 is the number of flight events during midnight from 00:00 to 07:00, N2 is the number of events during daytime from 07:00 to 19:00, N3 is the number of flight events during nighttime from 19:00 to 22:00, and N4 is the number of flight events during late nighttime from 22:00 to 24:00.This study has chosen the aircraft noise exposure areas based on the official announcement of SRAA. This announcement divided the areas near the Gimpo International Airport into 3 districts (type 1 [95+ WECPNL]), type 2 [90–95 WECPNL], and type 3 [75–90 WECPNL]) based on the aircraft noise level. There were no residents living in type 1 and 2 districts. The type 3 district was divided again into 3 subdistricts (‘Ga’ [85–90 WECPNL], ‘Na’ [80–85 WECPNL], and ‘Da’ [75–80 WECPNL]).
According to this official announcement by SRAA, the areas in Seoul City near the Gimpo International Airport, which required measurement for noise monitoring, were selected for this study. This study classified ‘Ga’ and ‘Na’ into a high noise exposure group (80-90 WECPNL) and ‘Da’ into a low noise exposure group (75-80 WECPNL) (Fig. 1). ‘A’-dong was selected as the control area with similar demographic, socioeconomic, and geologic characteristics, and without aircraft noise, as it is far from the airport. However, the control area did not have a noise measurement result.

This study was conducted as a door-to-door visit by the researchers from March to April 2015 in order to investigate the effect of aircraft noise on the health of the residents living near the Gimpo International Airport. Adults, who are 20 years old and above, were included in the study, but those who are older than 75 years old were excluded. A total of 3531 residents (1516 in the high exposure group, 1515 in the low exposure group, and 500 in the non-exposure group) participated in this survey. The 166 residents (61 in the high exposure group, 90 in the low exposure group, and 15 in the non-exposure group), who had been treated for depression within 1 year, were excluded from the study. In addition, 57 residents (27 in the high exposure group, 22 in the low exposure group, and 8 in the non-exposure group), whose questionnaire missed a significant amount of information, were also excluded from the study. Finally, 3308 residents (1428 in the high exposure group, 1403 in the low exposure group, and 477 in the non-exposure group) were selected as subjects for the analysis.
Survey tools for insomnia and daytime hypersomnia were used to evaluate sleep disturbance. The Insomnia Severity Index (ISI) [23, 24] was used to measure insomnia. The ISI is a self-reported questionnaire that consists of 7 questions for evaluating the difficulties of sleep onset and sleep maintenance, satisfaction with current sleep pattern, interference with daily functioning, noticeability of impairment attributed to the sleep problem, and degree of distress or concern caused by the sleep problem. Each question is scored between 0 and 4, and a higher score means a more severe status. The total score is ranged between 0 and 28. A score of 0-7 is considered as normal, 8-14 is considered as sub-threshold insomnia, 15–21 is considered as moderate insomnia, and 22–28 is considered as severe insomnia. The Epworth Sleep Scale (ESS) [25] was used in order to measure daytime hypersomnia. ESS uses a scoring system from 0 to 3 to indicate the degree of drowsiness in 8 different situations. A score of 3 indicates that a person feels sleepy the most. The total score is ranged from 0 to 24 and a score above 10 is considered as daytime hypersomnia.
A technical analysis was performed in order to investigate the demographic and sociological characteristics, as well as the degree of sleep disturbance of the subjects. ANOVA and Chi-square test were used to investigate if there was any difference in the demographic and sociological characteristics between the groups. The Mantel-Haenszel Chi-square test was performed to investigate if the demographic and sociological characteristics, as well as the degree of noise exposure, were related to insomnia or daytime hypersomnia. In addition, the results that showed a significance in the univariate analysis (age, sex, education level, residency period, smoking, drinking, exercise, and medical history) were corrected by using a multiple logistic regression model. The odds ratio and 95 % confidence interval were obtained for the effect of the exposure degree on insomnia and daytime hypersomnia.
Results
There were 3308 subjects, and their characteristics were analyzed by using a frequency analysis. The female subjects accounted for 66.4 % among the entire subjects, which were twice the number of the male subjects. The mean age of the subjects was 50.5 years old. Based on the age groups, 764 (23.1 %) subjects aged 60–69 years old accounted for the majority of the subjects, closely followed by the group with 739 (22.3 %) subjects aged 50–59 years old. For the education level, high school drop-out or graduate took up the greatest portion with a total of 1407 subjects (42.5 %). For the residency period, the greatest number of subjects, which was 826 (28.7 %), had lived for over 15 years in their residences.
A total of 1253 (37.9 %) subjects answered that they drink, while 489 (14.8 %) subjects answered that they are current smokers. A great number of subjects (1515, 45.8 %) answered that they exercise regularly. There were 283 (8.6 %) subjects who had been hospitalized or had undergone operations in the previous year.
For sex, the male subjects accounted for a significantly greater portion in the high exposure group (36.1 %) than the low exposure group (31.4 %) and the control group (32.1 %). The mean age and age distribution did not show any significant difference between the groups.
The education level results showed that the subjects, who received a high school education level or an even higher education, were smaller in numbers in the high exposure group and low exposure group, as compared to the control group (69.1 % vs 71.3 % vs 81.4 %), and the difference was statistically significant. For the residency period, 29.0 % of the subjects in the high exposure group and 31.4 % in the low exposure group lived in the area for 15 years or longer, which was significantly higher than that of the control group (20.3 %). For the drinking factor, 39.4 % of the subjects in the high exposure group and 40.5 % in the control group answered that they drink, which was significantly higher than that of the low exposure group (35.4 %). There was no significant difference in the results for the smoking factor between the groups. The 45.6 % of the subjects in the high exposure group and 44.3 % of the subjects in the low exposure group answered that they exercise regularly, which was significantly lower than that of the control group (50.9 %). The 10.1 % of the subjects in the high exposure group had been hospitalized or had undergone operations in the previous year, which was significantly higher than that of the low exposure group (7.6 %) and the control group (6.5 %).
The mean score of the ISI in all subjects was 6.9 ± 6.4. There were 1956 (59.1 %) subjects in the normal group, 897 (27.1 %) subjects in the sub-threshold insomnia group, 382 (11.6 %) subjects in the moderate insomnia group, and 73 (2.2 %) subjects in the severe insomnia group. The mean score of ESS was 5.5 ± 3.7. There were 2853 (86.2 %) subjects in the normal group, and 455 (13.8 %) subjects in the daytime hypersomnia group.
The ISI scores of the three groups were compared, and the results showed that the mean score increased from the control group to the high exposure group, thereby showing 4.1 ± 5.1 in the control group, 7.2 ± 6.5 in the low exposure group, and 7.6 ± 6.4 in the high exposure group. The post-hoc results showed that the difference of the scores between the control group and low exposure group, and between the control group and high exposure group were statistically significant. The percentage of the subjects with moderate or severe insomnia increased from the control group to high exposure group, thereby showing 26 (5.4 %) for the control group, 195 (13.9 %) for the low exposure group, and 234 (16.4 %) for the high exposure group. The Mantel-Haenszel Chi-square test results showed that the percentage of the subjects with insomnia had a statistically significant difference among the groups.
Likewise, the ESS scores of the three groups were compared, and the results showed that the mean score also increased from the control group to the high exposure group, thereby showing 4.1 ± 3.0 in the control group, 5.4 ± 3.7 in the low exposure group, and 6.0 ± 3.8 in the high exposure group. The post-hoc analysis results showed that the difference between all groups were statistically significant. The percentage of the subjects with daytime hypersomnia increased from the control group to high exposure group, thereby showing 26 (5.5 %) for the control group, 189 (13.5 %) for the low exposure group, and 240 (16.8 %) for the high exposure group. The Mantel-Haenszel Chi-square test results showed that the percentage of the subjects with daytime hypersomnia had a statistically significant difference among the groups (Table 1).
Table 1
General characteristics and Insomnia Severity Index (ISI)/Epworth Sleepiness Scale (ESS) results by noise exposure groups
The percentages of the subjects, who were considered as having sub-threshold insomnia, moderate insomnia, and severe insomnia based on ISI, were significantly higher in females (28.7 %, 12.6 %, and 2.8 %, respectively) than in males. The subjects with more severe insomnia showed greater mean age. Likewise, the percentages of the older subjects, who were considered as having sub-threshold insomnia, moderate insomnia, and severe insomnia, were higher than the younger subjects. The lower education level was associated with a high percentage of the subjects with insomnia, thereby disregarding the subjects with no education. The subjects, who have lived longer in the area, showed more insomnia. Meanwhile, the subjects, who had been hospitalized or had undergone operations in the previous year, had more insomnia. The subjects who are non-smokers and non-drinkers, as well as the subjects who exercise regularly, had more insomnia.
Based on the ESS, the percentage of the subjects suffering from daytime hypersomnia was 14.4 % in females, which was significantly higher than in males. The subjects with daytime hypersomnia showed greater mean age. The older subjects also showed more daytime hypersomnia. The lower education level was associated with a high percentage of subjects with daytime hypersomnia. The subjects, who have lived longer in the area, showed more daytime hypersomnia. Meanwhile, the subjects, who had been hospitalized or had undergone an operation in the previous year, showed more insomnia. No statistically significant relationship between smoking, drinking, exercise, and daytime hypersomnia was confirmed (Table 2).
Table 2
Insomnia Severity Index (ISI)/Epworth Sleepiness Scale (ESS) according to subject characteristics
The variables that showed significance in the univariate analysis were corrected by using the multiple logistic regression model. The odds ratio and 95 % confidence interval for the degree of noise exposure and sleep disturbance were obtained. For insomnia, the variables, including sex, age, education level, and residency period, were corrected in the first regression model. The other variables, including operation and hospitalization history for the previous year, smoking, drinking, and regular exercise performance, were additionally corrected in the second model.
The risk of insomnia was 3.45 times (95 % CI 2.64-4.50) higher in the low exposure group and 3.24 times (95 % CI 2.48-4.22) higher in the high exposure group, as compared to that of the control group. The risk of insomnia was 3.41 times (95 % CI 2.61-4.46) higher in the low exposure group and 3.26 times (95 % CI 2.50-4.25) in the high exposure group after additionally correcting the factors of operation and hospitalization history, smoking, drinking, and regular exercise (Model 2), as compared to that of the control group. The female subjects showed a significantly greater risk of insomnia than the males in both Model 1 (OR 1.51, 95 % CI 1.30-1.77) and Model 2 (OR 1.55, 95 % CI 1.24-1.94). The older aged group had a greater risk of insomnia than the younger aged group, and the odds ratio increased with age. However, the risk of insomnia was not significantly different according to the education level and residency period in both Models 1 and 2. The risk of insomnia was 1.71 times (95 % CI 1.35-2.17) greater in the subjects, who had been hospitalized or had undergone operations in the previous year, than the subjects who had not. For the lifestyle habits, the risk of insomnia was not significantly different according to smoking or drinking factors. However, the subjects who regularly exercised had 1.3 times (1.12-1.50) greater risk of insomnia than those who do not (Table 3).
Table 3
Multiple logistic regression model for Insomnia Severity Index (ISI) according to subject characteristics
For daytime hypersomnia, the variables that showed significance in the univariate analysis were also corrected by using a multiple logistic regression model. The variables, including sex, age, education level, and residency period, were corrected in the first regression model. Another variable of operation and hospitalization history for the previous year was additionally corrected in the second model. The results showed a similar pattern as those in the multivariate analysis of insomnia. The risk of daytime hypersomnia was 2.58 times greater (95 % 1.65-4.04) in the low exposure group and 3.43 times greater (95 % CI 2.20-5.34) in the high exposure group, as compared to the control group. In Model 2, the risk of daytime hypersomnia was still greater in the low and high exposure groups, 2.57 times (95 % CI 1.64-4.03) and 3.39 times (95 % CI 2.17-5.28), respectively, as compared to the control group even after the additional variable of the operation and hospitalization history in the previous year has been corrected. The odds ratio of Model 2 was similar to that of Model 1. The female subjects showed a greater risk of daytime hypersomnia than the males in both Model 1 (OR 1.30, 95 % CI 1.03-1.63) and Model 2 (OR 1.29, 95 % CI 1.03-1.62). The older subjects had a greater risk of daytime hypersomnia, as shown in the results for insomnia. The odds ratio increased with age. The risk of daytime hypersomnia was 1.41 times greater (95 % CI 1.02-1.93) in the subjects, who had been hospitalized or had undergone operations in the previous year, than those who had not (Table 4).
Table 4
Multiple logistic regression model for Epworth Sleepiness Scale (ESS) according to subject characteristics
Discussion
The subjects within the exposed area showed a significantly higher mean of ISI than the subjects within the non-exposed area. The ESS mean also showed significantly higher results in the subjects within the exposed area than the subjects within the non-exposed area. The percentage of insomnia and daytime hypersomnia, which were classified according to the results of the ISI and ESS, was also significantly greater in the subjects within the exposed area than the subjects within the non-exposed area. The multiple logistic regression model reflecting the corrected variables, including sex, age, education level, residency period, lifestyle habits, operation, and hospitalization history, showed approximately 3 times higher risk of insomnia and daytime hypersomnia in the subjects within the exposed area than the subjects within the non-exposed area. In summary, the degree of noise exposure and sleep disturbance showed significant association based on the results.
The number of aircraft arrivals and departures by time from Gimpo International Airport can be found from the Airport Statistics [26] that was published by the Korea Airports Corporation. The average number of flight events daily was 51.6 in the evening from 18:00 to 22:00, and 19.5 after 22:00 during this study period between March and April of 2015. The air services during the evening and nighttime change the depth of sleep, maintain wakefulness, and disturb the process of falling into sleep [27]. This study used WECPNL as the noise metric. The WECPNL is an appropriate metric for reflecting the impact on sleep because the flight events during the evening and nighttime are weighted in this metric. As a result, it can be assumed that the air traffic has a direct impact on the sleep pattern of the residents in the area, where the survey was performed, thereby increasing the risk of sleep disturbance (Table 5).
Table 5
Daily average number of flight events in Gimpo International Airport (2015. 3. ~ 2015. 4.)
The previous studies have confirmed that continuous exposure to noise can increase the risk of sleep disturbance [28–31]. There are a few studies that evaluated the relationship between aircraft noise and sleep disturbance, including a community-based cross-sectional study, which is similar to this study, that was conducted by Kim et al. [9]. The sleep quality of the residents adjacent to the airport was evaluated by using the Pittsburgh Sleep Quality Index (PSQI) [32]. The results showed that the quality of sleep was poor in the residents, who were exposed to the aircraft noise, and there was a greater risk of sleep disturbance.
Sleep is also influenced by the sex and age of a person [33]. In this study, female and older subjects showed significant results in terms of their association with sleep disturbance. The prevalence of sleep disturbance showed a difference according to the education level and residency period of the subjects in the univariate analysis. However, the multiple logistic regression model results did not show a statistical significance after the adjustment of such variables.
The subjects, who had been hospitalized or had undergone operations in the previous year, also showed a higher prevalence of sleep disturbance. The chronic comorbidities and health status that may affect the sleep quality [34] and the reverse effect of sleep disturbance can also be considered. Patients with sleep disturbance are more likely to develop affective disorders [35, 36]. Likewise, the prevalence of the hospitalizations or operations was greater in the noise exposure group than that in the control group. It could be considered as a health effect of the aircraft noise [6–10].
For the lifestyle habits, there was no variable that showed a significant association with the occurrence of daytime hypersomnia. In the univariate analysis, the prevalence of insomnia showed some difference based on the lifestyle habits, but only regular exercise performance showed a significance in the multivariate analysis. The subjects, who exercised regularly, showed a higher prevalence of insomnia, which was different from the general understanding that regular exercise improves the quality of sleep [37, 38]. However, exercise near bedtime changes the circardian phase [39], increases the core body temperature [40], and increases the physiological arousal [41], which would disturb sleep. However, this study did not collect the information on the exercise time, so the relationship could not be confirmed. On the contrary, this is a cross-sectional study and a reverse causation can be suspected. It is possible that people, who experience sleep disturbance, tend to exercise more than others.
There are some limitations to this study. First, the subjects of the exposure group were selected based on the official announcement of the Seoul Regional Aviation Administration 5 years earlier without using a direct noise measurement. As it used the past noise level, the current exposure to the noise could not be accurately reflected, and the possibility of a misclassification could not be ruled out. Second, a subjective method was used to evaluate sleep disturbance rather than objective methods, such as EEG and polysomnography. There was a study that evaluated sleep disturbance by using EEG and polysomnography [42], but these objective methods are practically difficult to use in a large-scale epidemiological study. Third, other factors that might have an impact on sleep, such as drinking coffee and watching television at night, were not taken into consideration.
Despite such limitations, this was a large-scale epidemiological study that enrolled more than 3000 subjects. It was the largest scale study among those on aircraft noise conducted in South Korea. This study was significant, as it was conducted on the residents, who live in city areas near the airport, whereas the previous studies on aircraft noise were conducted in the suburbs or towns located outside the city.
Sleep disturbance caused by aircraft noise is an important public health issue. In particular, the airport, on which this study was conducted, was located near the city with residents living in the area, and this might lead to more serious problems. The air services during the evening or nighttime also have a direct impact on the sleep pattern of the residents. For this reason, appropriate measures need to be considered.
Conclusion
In conclusion, the prevalence of insomnia and daytime hypersomnia was higher in the residents, who are exposed to aircraft noise, as compared to the control group. This study was significant, as it was a large-scale epidemiological study. Further research needs to be conducted by using a direct measurement of the noise and objective sleep evaluation methods in order to clarify the cause-effect relationship.
Acknowledgements
This study was conducted with financial support from Seoul Metropolitan City in 2015.
KMK analyzed the data and drafted the manuscript. YSJ suggested the study design, analyzed the data, and revised the manuscript. YJKwon collected and interpreted the data. YKC participated to analyze the data. BKK helped to draft the manuscript. HJK participated in the study design. KWY participated to collect the data. All authors read and approved the final manuscript.
The authors declare that they have no competing interests.
- 1. Kim KS. Hearing Loss. Occupational Disease. 2007, 1. Seoul: Gyechuk Munwhasa.
- 2. Haralabidis AS, Dimakopoulou K, Vigna-Taglianti F, Giampaolo M, Borgini A, Dudley M-L, et al. Acute effects of night-time noise exposure on blood pressure in populations living near airports. Eur Heart J 2008;29:658–64. 10.1093/eurheartj/ehn013. 18270210.PubMed
- 3. Willich SN, Wegscheider K, Stallmann M, Keil T. Noise burden and the risk of myocardial infarction. Eur Heart J 2006;27:276–82. 10.1093/eurheartj/ehi658. 16308324.ArticlePubMed
- 4. Hardoy MC, Carta MG, Marci AR, Carbone F, Cadeddu M, Kovess V, et al. Exposure to aircraft noise and risk of psychiatric disorders: the Elmas survey. Soc Psychiatry Psychiatr Epidemiol 2005;40:24–6. 10.1007/s00127-005-0837-x. 15624071.ArticlePubMedPDF
- 5. Muzet A. Environmental noise, sleep and health. Sleep Med Rev 2007;11:135–42. 10.1016/j.smrv.2006.09.001. 17317241.ArticlePubMed
- 6. Chen TJ, Chen SS, Hsieh PY, Chiang HC. Auditory effects of aircraft noise on people living near an airport. Arch Environ Occup Health 1997;52(1):45–50. 10.1080/00039899709603799.Article
- 7. Rosenlund M, Berglind N, Pershagen G, Järup L, Bluhm G. Increased prevalence of hypertension in a population exposed to aircraft noise. Occup Environ Med 2001;58:769–73. 10.1136/oem.58.12.769. 11706142.ArticlePubMedPMC
- 8. Tarnopolsky A, Watkins G, Hand DJ. Aircraft noise and mental health: I. Prevalence of individual symptoms. Psychol Med 1980;10:683–98. 10.1017/S0033291700054982. 7208727.ArticlePubMed
- 9. Kim SJ, Chai SK, Lee KW, Park J-B, Min K-B, Kil HG, et al. Exposure–response relationship between aircraft noise and sleep quality: A community-based cross-sectional study. Osong Public Health Res Perspect 2014;5:108–14. 10.1016/j.phrp.2014.03.004. 24955321.ArticlePubMedPMC
- 10. http://www.euro.who.int/__data/assets/pdf_file/0017/43316/E92845.pdf.
- 11. Grandner MA, Jackson NJ, Pak VM, Gehrman PR. Sleep disturbance is associated with cardiovascular and metabolic disorders. J Sleep Res 2012;21:427–33. 10.1111/j.1365-2869.2011.00990.x. 22151079.ArticlePubMedPMC
- 12. Vgontzas AN, Liao D, Pejovic S, Calhoun S, Karataraki M, Basta M, et al. Insomnia with short sleep duration and mortality: the Penn State cohort. Sleep 2010;33:1159–64. 20857861.ArticlePubMedPMC
- 13. Phillips B, Mannino DM. Do insomnia complaints cause hypertension or cardiovascular disease. J Clin Sleep Med 2007;3:489–94. 17803012.ArticlePubMedPMCPDF
- 14. Mallon L, Broman J-E, Hetta J. Relationship between insomnia, depression, and mortality: a 12-year follow-up of older adults in the community. Int Psychogeriatr 2000;12:295–306. 10.1017/S1041610200006414. 11081951.ArticlePubMed
- 15. http://publicapps.caa.co.uk/docs/33/ERCD1208.pdf.
- 16. Michaud DS, Fidell S, Pearsons K, Campbell KC, Keith SE. Review of field studies of aircraft noise-induced sleep disturbance. Acoust Soc Am 2007;121:32–41. 10.1121/1.2400613.ArticlePDF
- 17. Perron S, Tétreault L-F, King N, Plante C, Smargiassi A. Review of the effect of aircraft noise on sleep disturbance in adults. Noise Health 2012;14:58–67. 10.4103/1463-1741.95133. 22517305.ArticlePubMed
- 18. Franssen EAM, Wiechen CMAG, Nagelkerke NJD, Lebret E. Aircraft noise around a large international airport and its impact on general health and medication use. Occup Environ Med 2004;61:405–13. 10.1136/oem.2002.005488. 15090660.ArticlePubMedPMC
- 19. Floud S, Vigna-Taglianti F, Hansell A, Blangiardo M, Houthuijs D, Breugelmans O, et al. Medication use in relation to noise from aircraft and road traffic in six European countries: results of the HYENA study. Occup Environ Med 2011;68:518–24. 10.1136/oem.2010.058586. 21084328.ArticlePubMed
- 20. http://www.moi.go.kr/frt/sub/a05/gwanboMain/screen.do.
- 21. Lim C, Kim J, Hong J, Lee S, Lee S. The relationship between civil aircraft noise and community annoyance in Korea. J Sound Vib 2007;299:575–86. 10.1016/j.jsv.2006.06.064.Article
- 22. Lim C, Kim J, Hong J, Lee S. Effect of background noise levels on community annoyance from aircraft noise. Acoust Soc Am 2008;123:766–71. 10.1121/1.2821985.ArticlePDF
- 23. Bastien CH, Vallieres A, Morin CM. Validation of the Insomnia Severity Index as an outcome measure for insomnia research. Sleep Med 2001;2:297–307. 10.1016/S1389-9457(00)00065-4. 11438246.ArticlePubMed
- 24. Ensrud KE, Joffe H, Guthrie KA, Larson JC, Reed SD, Newton KM, et al. Effect of escitalopram on insomnia symptoms and subjective sleep quality in healthy menopausal women with hot flashes: a randomized controlled trial. Menopause 2012;19:848. 10.1097/gme.0b013e3182476099. 22433978.PubMedPMC
- 25. Johns MW. A new method for measuring daytime sleepiness: the Epworth sleepiness scale. Sleep 1991;14:540–5. 1798888.ArticlePubMed
- 26. http://www.airport.co.kr/user/www/396/stats/airportStats/jsp/LayOutPage.do.
- 27. Porter ND, Kershaw AD, Ollerhead JB. Adverse effects of night-time aircraft noise: Civil Aviation Authority in London. 2000.
- 28. Jakovljević B, Belojević G, Paunović K, Stojanov V. Road traffic noise and sleep disturbances in an urban population: cross-sectional study. Croat Med J 2006;47:125–33. 16489705.PubMedPMC
- 29. Marks A, Griefahn B. Associations between noise sensitivity and sleep, subjectively evaluated sleep quality, annoyance, and performance after exposure to nocturnal traffic noise. Noise Health 2007;9:1. 10.4103/1463-1741.34698. 17851221.ArticlePubMed
- 30. Öhrström E. Longitudinal surveys on effects of changes in road traffic noise—annoyance, activity disturbances, and psycho-social well-being. J Acoust Soc Am 2004;115:719–29. 10.1121/1.1639333. 15000184.ArticlePubMedPDF
- 31. Miedema HM, Vos H. Associations between self-reported sleep disturbance and environmental noise based on reanalyses of pooled data from 24 studies. Behav Sleep Med 2007;5:1–20. 10.1207/s15402010bsm0501_1. 17313321.ArticlePubMed
- 32. Buysse DJ, Reynolds CF, Monk TH, Hoch CC, Yeager AL, Kupfer DJ. Quantification of subjective sleep quality in healthy elderly men and women using the Pittsburgh Sleep Quality Index (PSQI). Sleep 1991;14:331–8. 1947597.PubMed
- 33. Thase ME. Depression and sleep: pathophysiology and treatment. Dialogues Clin Neurosci 2006;8:217–26. 16889107.ArticlePubMedPMC
- 34. Katz DA, McHorney CA. The relationship between insomnia and health-related quality of life in patients with chronic illness. J Fam Pract 2002;51:229–36. 11978233.PubMed
- 35. Ford DE, Kamerow DB. Epidemiologic study of sleep disturbances and psychiatric disorders: an opportunity for prevention? JAMA 1989;262(11):1479–84. 10.1001/jama.1989.03430110069030. 2769898.ArticlePubMed
- 36. Eaton WW, Badawi M, Melton B. Prodromes and precursors: Epidemiologic data for primary prevention of disorders with slow onset. Am J Psychiatry 1995;152:967–72. 10.1176/ajp.152.7.967. 7793466.ArticlePubMed
- 37. Youngstedt SD, Kline CE. Epidemiology of exercise and sleep*. Sleep Biol Rhythms 2006;4:215–21. 10.1111/j.1479-8425.2006.00235.x. 25374476.ArticlePubMedPMC
- 38. Driver HS, Taylor SR. Exercise and sleep. Sleep Med Rev 2000;4:387–402. 10.1053/smrv.2000.0110. 12531177.ArticlePubMed
- 39. Buxton OM, Lee CW, L'Hermite-Balériaux M, Turek FW, Van Cauter E. Exercise elicits phase shifts and acute alterations of melatonin that vary with circadian phase. Am J Physiol Regul Integr Comp Physiol 2003;284:R714–R24. 10.1152/ajpregu.00355.2002. 12571075.ArticlePubMed
- 40. Davies C. Thermoregulation during exercise in relation to sex and age. Eur J Appl Physiol Occup Physiol 1979;42:71–9. 10.1007/BF00421907. 510285.ArticlePubMedPDF
- 41. Hauri P. Effects of evening activity on early night sleep. Psychophysiology 1968;4:267–77. 10.1111/j.1469-8986.1968.tb02767.x.ArticlePubMed
- 42. Pirrera S, De Valck E, Cluydts R. Nocturnal road traffic noise: A review on its assessment and consequences on sleep and health. Environ Int 2010;36:492–8. 10.1016/j.envint.2010.03.007. 20406712.ArticlePubMed
REFERENCES
Figure & Data
REFERENCES
Citations
Citations to this article as recorded by 
- Environmental Noise Exposure and the Risk of Sleep Disturbance: A Systematic Review and Meta-Analysis
Zitong Li
Noise and Health.2026; 28(131): 267. CrossRef - Characterizing temporal trends in populations exposed to aircraft noise around U.S. airports: 1995–2015
Daniel D. Nguyen, Jonathan I. Levy, Chanmin Kim, Kevin J. Lane, Matthew C. Simon, Jaime E. Hart, Eric A. Whitsel, Trang VoPham, Andrew Malwitz, Junenette L. Peters
Journal of Exposure Science & Environmental Epidemiology.2025; 35(1): 70. CrossRef - Assessing Annoyance and Sleep Disturbance Related to Changing Aircraft Noise Context: Evidence from Tan Son Nhat Airport
Thulan Nguyen, Tran Thi Hong Nhung Nguyen, Makoto Morinaga, Yasuhiro Hiraguri, Takashi Morihara
International Journal of Environmental Research and Public Health.2025; 22(8): 1296. CrossRef - Benchmarking the aircraft noise mapping package developed for a unified urban environmental modelling tool
Linus Yinn Leng Ang, Fangsen Cui, Hee Joo Poh
Noise Mapping.2024;[Epub] CrossRef - Traffic-Related High Sleep Disturbance in the LIFE-Adult Cohort Study: A Comparison to the WHO Exposure-Response-Curves
Melanie Schubert, Karla Romero Starke, Julia Gerlach, Matthias Reusche, Pauline Kaboth, Wolfram Schmidt, Dieter Friedemann, Janice Hegewald, Hajo Zeeb, Andrea Zülke, Steffi G. Riedel-Heller, Andreas Seidler
International Journal of Environmental Research and Public Health.2023; 20(6): 4903. CrossRef - The impact of marine engine noise exposure on seafarer fatigue: A China case
Renda Cui, Zhengjiang Liu, Xinjian Wang, Zaili Yang, Shiqi Fan, Yaqing Shu
Ocean Engineering.2022; 266: 112943. CrossRef - Environmental Noise and Effects on Sleep: An Update to the WHO Systematic Review and Meta-Analysis
Michael G. Smith, Makayla Cordoza, Mathias Basner
Environmental Health Perspectives.2022;[Epub] CrossRef - Aircraft noise and vehicle traffic-related air pollution interact to affect preterm birth risk in Los Angeles, California
Sam E. Wing, Timothy V. Larson, Neelakshi Hudda, Sarunporn Boonyarattaphan, Irish Del Rosario, Scott Fruin, Beate Ritz
Science of The Total Environment.2022; 829: 154678. CrossRef - The impact of aircraft noise on vascular and cardiac function in relation to noise event number: a randomized trial
Frank P Schmidt, Johannes Herzog, Boris Schnorbus, Mir Abolfazl Ostad, Larissa Lasetzki, Omar Hahad, Gianna Schäfers, Tommaso Gori, Mette Sørensen, Andreas Daiber, Thomas Münzel
Cardiovascular Research.2021; 117(5): 1382. CrossRef - The Evolutionarily Mismatched Impact of Urbanization on Insomnia Symptoms: a Short Review of the Recent Literature
Jiaqing O, Catrin Pugh-Jones, Bethany Clark, Jenna Trott, Lei Chang
Current Psychiatry Reports.2021;[Epub] CrossRef - Aircraft Noise of Airport Community in Korea
Soo Hee Oh, Kyoungwon Lee
Audiology and Speech Research.2020; 16(1): 1. CrossRef - Evidence Relating to Environmental Noise Exposure and Annoyance, Sleep Disturbance, Cardio-Vascular and Metabolic Health Outcomes in the Context of IGCB (N): A Scoping Review of New Evidence
Irene van Kamp, Sendrick Simon, Hilary Notley, Christos Baliatsas, Elise van Kempen
International Journal of Environmental Research and Public Health.2020; 17(9): 3016. CrossRef - Effects of sound environment on the sleep of college students in China
Qi Meng, Jingwen Zhang, Jian Kang, Yue Wu
Science of The Total Environment.2020; 705: 135794. CrossRef - Association between Shift Work and Neurocognitive Function among Firefighters in South Korea: A Prospective before–after Study
Kyeongmin Kwak, Bong-Kyu Kim, Tae-Won Jang, Chang Sun Sim, Yeon-Soon Ahn, Kyeong-Sook Choi, Kyoung Sook Jeong
International Journal of Environmental Research and Public Health.2020; 17(13): 4647. CrossRef - Health effects of pollution on the residential population near a Brazilian airport: A perspective based on literature review
Laís Fajersztajn, Mariana Tavares Guimarães, Etienne Duim, Tarsila Guimarães Vieira da Silva, Mirna Namie Okamura, Suzan Lúcia Brancher Brandão, Ana Elisa Ribeiro, Ludmila Macêdo Naud, Shane O'Sullivan, Paulo Hilário Nascimento Saldiva, Maria Regina Alves
Journal of Transport & Health.2019; 14: 100565. CrossRef - Impact of airport noise on the health situation of host communities: a case study of Obong victor Attah international airport, Akwa Ibom state, Nigeria
Raimi Morufu Olalekan, Ihuoma Blossom ADINDU
MOJ Public Health.2019; 8(2): 74. CrossRef - A statistical evaluation on flight operational characteristics affecting aircraft noise during take-off
Paolo Gagliardi, Luca Teti, Gaetano Licitra
Applied Acoustics.2018; 134: 8. CrossRef - Spatial clusters of daytime sleepiness and association with nighttime noise levels in a Swiss general population (GeoHypnoLaus)
Stéphane Joost, José Haba-Rubio, Rebecca Himsl, Peter Vollenweider, Martin Preisig, Gérard Waeber, Pedro Marques-Vidal, Raphaël Heinzer, Idris Guessous
International Journal of Hygiene and Environmental Health.2018; 221(6): 951. CrossRef - Development of Airport Noise Mapping using Matlab Software (Case Study: Adi Soemarmo Airport – Boyolali, Indonesia)
Pertiwi Andarani, Haryono Setiyo Huboyo, Diny Setyanti, Wiwik Budiawan, Hadiyanto, Sudarno, Maryono
E3S Web of Conferences.2018; 31: 12007. CrossRef - Comparative Study of the Effect of Aircraft Noise on Emotional States Between Airport Neighboring and City Residents
Bahman Kord Tamini, Mostafa Mirbaluchzahi Pak
Shiraz E-Medical Journal.2016;[Epub] CrossRef - Environmental Noise and Sleep Disturbance: Night-to-Night Variability of Sleep/Wake Pattern
Seockhoon Chung, Soyoung Youn, Chul Lee, Min-Woo Jo, Jangho Park, Seong Woo Jo, Jiho Lee, Joo Hyun Sung, Chang Sun Sim
Sleep Medicine Research.2016; 7(2): 78. CrossRef
 Cite
CiteThe effect of aircraft noise on sleep disturbance among the residents near a civilian airport: a cross-sectional study
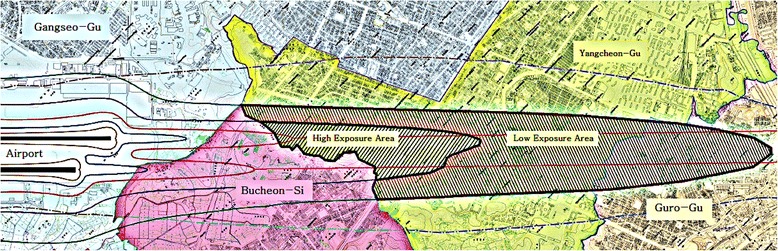
Fig. 1 Aircraft noise map in the vicinity of Gimpo International Airport
Fig. 1
The effect of aircraft noise on sleep disturbance among the residents near a civilian airport: a cross-sectional study
| Characteristics | All groups | Control | Low-exposure (75-80 WECPNL) | High-exposure (80-90 WECPNL) | p-value | |
|---|---|---|---|---|---|---|
| n = 3308(%) | n = 477(%) | n = 1403(%) | N = 1428(%) | |||
| Sexa) | Male | 1111(33.6) | 153(32.1) | 443(31.6) | 515(36.1) | 0.0308 |
| Female | 2197(66.4) | 324(67.9) | 960(68.4) | 913(63.9) | ||
| Mean age(years)b) | 50.5 ± 14.2 | 50.5 ± 14.4 | 50.6 ± 14.1 | 50.4 ± 14.2 | 0.9116 | |
| Age(years)a) | 20-29 | 268(8.1) | 44(9.2) | 110(7.8) | 114(8.0) | 0.4197 |
| 30-39 | 585(17.7) | 81(17.0) | 240(17.1) | 264(18.5) | ||
| 40-49 | 656(19.8) | 77(16.1) | 300(21.4) | 279(19.5) | ||
| 50-59 | 739(22.3) | 121(25.4) | 297(21.2) | 321(22.5) | ||
| 60-69 | 764(23.1) | 108(22.6) | 330(23.5) | 326(22.8) | ||
| 70-74 | 296(9.0) | 46(9.6) | 126(9.0) | 124(8.7) | ||
| Educationa) | Never | 77(2.3) | 4(0.8) | 26(1.8) | 47(3.3) | <0.0001 |
| Elementary school | 343(10.4) | 28(5.9) | 134(9.6) | 181(12.7) | ||
| Middle school | 512(15.5) | 57(11.9) | 242(17.3) | 213(14.9) | ||
| High school | 1407(42.5) | 225(47.2) | 552(39.3) | 630(44.1) | ||
| College or more | 969(29.3) | 163(34.2) | 449(32.0) | 357(25.0) | ||
| Residency period(year)a) | ≥15 | 826(28.7) | 86(20.3) | 382(31.4) | 358(29.0) | <0.0001 |
| 10-14 | 655(22.8) | 120(28.4) | 287(23.6) | 248(20.1) | ||
| 5-9 | 679(23.6) | 101(23.9) | 260(21.4) | 318(25.7) | ||
| <5 | 716(24.9) | 116(27.4) | 288(23.7) | 312(25.2) | ||
| Drinkinga) | No | 2055(62.1) | 284(59.5) | 906(64.6) | 865(60.6) | 0.0408 |
| Yes | 1253(37.9) | 193(40.5) | 497(35.4) | 563(39.4) | ||
| Smokinga) | Never | 2546(77.4) | 369(77.4) | 1102(78.5) | 1075(75.3) | 0.2182 |
| Past smoker | 273(8.2) | 43(9.0) | 101(7.2) | 129(9.0) | ||
| Current smoker | 489(14.8) | 65(13.6) | 200(14.3) | 224(15.7) | ||
| Regular Exercisea) | No | 1793(54.2) | 234(49.1) | 782(55.7) | 777(54.4) | 0.0398 |
| Yes | 1515(45.8) | 243(50.9) | 621(44.3) | 651(45.6) | ||
| Operation or hospitalization within 1 yeara) | No | 3025(91.4) | 446(93.5) | 1296(92.4) | 1283(89.9) | 0.0123 |
| Yes | 283(8.6) | 31(6.5) | 107(7.6) | 145(10.1) | ||
| ISIc) | Meanb) | 6.9 ± 6.4 | 4.1 ± 5.1 | 7.2 ± 6.5 | 7.6 ± 6.4 | <0.0001 |
| Normal | 1956(59.1) | 376(78.8) | 782(55.7) | 798(55.9) | <0.0001 | |
| Sub-threshold insomnia | 897(27.1) | 75(15.7) | 426(30.4) | 396(27.7) | ||
| Moderate insomnia | 382(11.6) | 25(5.2) | 155(11.1) | 202(14.2) | ||
| Severe insomnia | 73(2.2) | 1(0.2) | 40(2.8) | 32(2.2) | ||
| ESSc) | Meanb) | 5.5 ± 3.7 | 4.1 ± 3.0 | 5.4 ± 3.7 | 6.0 ± 3.8 | <0.0001 |
| Normal | 2853(86.2) | 451(94.5) | 1214(86.5) | 1188(83.2) | <0.0001 | |
| Daytime hypersomnia | 455(13.8) | 26(5.5) | 189(13.5) | 240(16.8) |
| Characteristics | ISI | ESS | |||||
|---|---|---|---|---|---|---|---|
| Normal | Sub-threshold insomnia | Moderated insomnia | Severe insomnia | Normal | Daytime hypersomnia | ||
| Sex | Male | 726(65.4) | 267(24.0) | 106(9.5) | 12(1.1)c)*** | 972(87.5) | 139(12.5)a) |
| Female | 1230(56.0) | 630(28.7) | 276(12.6) | 61(2.8) | 1881(85.6) | 316(14.4) | |
| Mean age(years)b) | 48.7 ± 14.3 | 52.0 ± 13.6 | 54.6 ± 13.2 | 57.7 ± 11.9** | 49.9 ± 14.2 | 54.2 ± 13.1** | |
| Age(years)c) | 20-29 | 200(74.6) | 56(20.9) | 11(4.1) | 1(0.4)**** | 250(93.3) | 18(6.7)**** |
| 30-39 | 389(66.5) | 140(23.9) | 52(8.9) | 4(0.7) | 527(90.1) | 58(9.9) | |
| 40-49 | 409(62.3) | 164(25.0) | 70(10.7) | 13(2.0) | 570(86.9) | 86(13.1) | |
| 50-59 | 420(56.8) | 218(29.5) | 85(11.5) | 16(2.2) | 631(85.4) | 108(14.6) | |
| 60-69 | 394(51.6) | 229(30.0) | 112(14.7) | 29(3.8) | 637(83.4) | 127(16.6) | |
| 70-74 | 144(48.7) | 90(30.4) | 52(17.6) | 10(3.4) | 238(80.4) | 58(19.6) | |
| Educationc) | Never | 41(53.2) | 22(28.6) | 12(15.6) | 2(2.6)**** | 63(81.8) | 14(18.2)**** |
| Elementary School | 174(50.7) | 104(30.3) | 58(16.9) | 7(2.1) | 279(81.3) | 64(18.7) | |
| Middle school | 267(52.1) | 150(29.3) | 74(14.5) | 21(4.1) | 434(84.8) | 78(15.2) | |
| High school | 849(60.3) | 365(25.9) | 160(11.4) | 33(2.4) | 1199(85.2) | 208(14.8) | |
| College or more | 625(64.5) | 256(26.4) | 78(8.1) | 10(1.0) | 878(90.6) | 91(9.4) | |
| Residency period(year)c) | ≥15 | 446(54.0) | 253(30.6) | 108(13.1) | 19(2.3)**** | 685(82.9) | 141(17.1)*** |
| 10-14 | 381(58.2) | 179(27.3) | 76(11.6) | 19(2.9) | 571(87.2) | 84(12.8) | |
| 5-9 | 418(61.6) | 165(24.3) | 80(11.8) | 16(2.4) | 592(87.2) | 87(12.8) | |
| <5 | 442(61.7) | 195(27.2) | 68(9.5) | 11(1.5) | 625(87.3) | 91(12.7) | |
| Drinking | No | 1164(56.6) | 573(27.9) | 265(12.9) | 53(2.6)c)**** | 1776(86.4) | 279(13.6)a) |
| Yes | 792(63.2) | 324(25.9) | 117(9.3) | 20(1.6) | 1077(86.0) | 176(14.0) | |
| Smokingc) | Never | 1474(57.9) | 708(27.8) | 300(11.8) | 64(2.5)*** | 2190(86.0) | 356(14.0) |
| Past smoker | 180(65.9) | 68(24.9) | 24(8.8) | 1(0.4) | 229(83.9) | 44(16.1) | |
| Current smoker | 302(61.8) | 121(24.7) | 58(11.9) | 8(1.6) | 434(88.8) | 55(11.2) | |
| Regular Exercise | No | 1111(62.0) | 454(25.3) | 199(11.1) | 29(1.6)c)**** | 1532(85.4) | 261(14.6)a) |
| Yes | 845(55.8) | 443(29.2) | 183(12.1) | 44(2.9) | 1321(87.2) | 194(12.8) | |
| Operation or hospitalization within 1 year | No | 1830(60.5) | 801(26.5) | 329(10.9) | 65(2.2)c)**** | 2625(86.8) | 400(13.2)a)* |
| Yes | 126(44.5) | 96(33.9) | 53(18.7) | 8(2.8) | 228(80.6) | 55(19.4) | |
| Noise exposure Groupc) | Control | 376(78.8) | 75(15.7) | 25(5.2) | 1(0.2)**** | 451(94.6) | 26(5.4)**** |
| Low-exposure | 782(55.7) | 426(30.4) | 155(11.1) | 40(2.8) | 1214(86.5) | 189(13.5) | |
| High-exposure | 798(55.9) | 396(27.7) | 202(14.2) | 32(2.2) | 1188(83.2) | 240(16.8) | |
| Characteristics | Model 1 | Model 2 | |||
|---|---|---|---|---|---|
| OR | 95 % CI | OR | 95 % CI | ||
| Sex | Male | 1.0 | 1.0 | ||
| Female | 1.54 | 1.31-1.81 | 1.57 | 1.24-1.97 | |
| Age(years) | 20-29 | 1.0 | 1.0 | ||
| 30-39 | 1.39 | 0.95-2.04 | 1.40 | 0.95-2.06 | |
| 40-49 | 1.74 | 1.22-2.50 | 1.73 | 1.21-2.49 | |
| 50-59 | 2.27 | 1.59-3.25 | 2.17 | 1.51-3.12 | |
| 60-69 | 2.97 | 2.05-4.30 | 2.76 | 1.89-4.02 | |
| 70-74 | 3.88 | 2.52-5.98 | 3.64 | 2.35-5.65 | |
| Education | Never | 1.0 | 1.0 | ||
| Elementary school | 1.07 | 0.64-1.77 | 1.09 | 0.65-1.81 | |
| Middle school | 1.22 | 0.74-2.01 | 1.25 | 0.76-2.07 | |
| High school | 1.15 | 0.70-1.89 | 1.19 | 0.73-1.96 | |
| College or more | 1.17 | 0.69-1.96 | 1.18 | 0.73-1.98 | |
| Residency period(year) | <5 | 1.0 | 1.0 | ||
| 5-9 | 0.93 | 0.75-1.16 | 0.93 | 0.75-1.16 | |
| 10-14 | 1.02 | 0.82-1.27 | 1.01 | 0.81-1.26 | |
| ≥15 | 0.96 | 0.77-1.19 | 0.96 | 0.77-1.19 | |
| Noise exposure group | Control | 1.0 | 1.0 | ||
| Low-exposure | 3.45 | 2.64-4.50 | 3.41 | 2.61-4.46 | |
| High-exposure | 3.24 | 2.48-4.22 | 3.26 | 2.50-4.25 | |
| Drinking | No | 1.0 | |||
| Yes | 0.98 | 0.82-1.16 | |||
| Smoking | Never | 1.0 | |||
| Past smoker | 0.86 | 0.62-1.21 | |||
| Current smoker | 1.16 | 0.88-1.53 | |||
| Regular Exercise | No | 1.0 | |||
| Yes | 1.25 | 1.07-1.45 | |||
| Operation or hospitalization within 1 year | No | 1.0 | |||
| Yes | 1.75 | 1.37-2.25 | |||
| Characteristics | Model 1 | Model 2 | |||
|---|---|---|---|---|---|
| OR | 95 % CI | OR | 95 % CI | ||
| Sex | Male | 1.0 | 1.0 | ||
| Female | 1.22 | 0.97-1.55 | 1.22 | 0.97-1.55 | |
| Age(years) | 20-29 | 1.0 | 1.0 | ||
| 30-39 | 2.22 | 1.07-4.58 | 2.20 | 1.06-4.54 | |
| 40-49 | 3.04 | 1.53-6.03 | 3.03 | 1.53-6.01 | |
| 50-59 | 3.25 | 1.65-6.41 | 3.19 | 1.62-6.30 | |
| 60-69 | 3.77 | 1.89-7.53 | 3.65 | 1.83-7.29 | |
| 70-74 | 4.53 | 2.13-9.62 | 4.39 | 2.06-9.33 | |
| Education | Never | 1.0 | 1.0 | ||
| Elementary school | 1.02 | 0.52-1.99 | 1.04 | 0.53-2.05 | |
| Middle school | 0.90 | 0.46-1.77 | 0.93 | 0.47-1.82 | |
| High school | 1.16 | 0.60-2.24 | 1.20 | 0.62-2.32 | |
| College or more | 0.73 | 0.36-1.50 | 0.75 | 0.37-1.54 | |
| Residency period(year) | <5 | 1.0 | 1.0 | ||
| 5-9 | 0.88 | 0.64-1.22 | 0.89 | 0.64-1.22 | |
| 10-14 | 0.86 | 0.63-1.19 | 0.86 | 0.62-1.20 | |
| ≥15 | 1.05 | 0.77-1.43 | 1.05 | 0.77-1.43 | |
| Noise exposure group | Control | 1.0 | 1.0 | ||
| Low-exposure | 2.58 | 1.65-4.04 | 2.57 | 1.64-4.03 | |
| High-exposure | 3.43 | 2.20-5.34 | 3.39 | 2.17-5.28 | |
| Operation or hospitalization within 1 year | No | 1.0 | |||
| Yes | 1.41 | 1.00-1.97 | |||
| Time | Daily average number of flight events | ||
|---|---|---|---|
| Arrival | Departure | Total | |
| 0:00-6:00 | 0 | 0 | 0 |
| 6:00-7:00 | 0 | 6.0 | 6.0 |
| 07:00-12:00 | 46.7 | 68.0 | 114.7 |
| 12:00-18:00 | 77.1 | 78.0 | 155.1 |
| 18:00-22:00 | 51.6 | 43.2 | 94.8 |
| 22:00-23:00 | 19.3 | 0.1 | 19.4 |
| 23:00-24:00 | 0.1 | 0 | 0.1 |
| Total | 194.8 | 195.3 | 390.1 |
Table 1 General characteristics and Insomnia Severity Index (ISI)/Epworth Sleepiness Scale (ESS) results by noise exposure groups
a)By Chi-square test
b)By ANOVA
c)By Mantel-Haenszel Chi-square test
Table 2 Insomnia Severity Index (ISI)/Epworth Sleepiness Scale (ESS) according to subject characteristics
a)By Chi-square test
b)By ANOVA
c)By Mantel-Haeszel Chi-square test
*
Table 3 Multiple logistic regression model for Insomnia Severity Index (ISI) according to subject characteristics
Table 4 Multiple logistic regression model for Epworth Sleepiness Scale (ESS) according to subject characteristics
Table 5 Daily average number of flight events in Gimpo International Airport (2015. 3. ~ 2015. 4.)

