
Articles
- Page Path
- HOME > Ann Occup Environ Med > Volume 36; 2024 > Article
- Original Article The association of shift work and TyG index among male workers in a chemical plant of Korea: a cross-sectional study
-
Gwangin Baek
 , Yong-Jin Lee, Soon-Chan Kwon, Young-Sun Min, Jisuk Yun, Tae Jin Ahn, Eun-Chul Jang
 -
Annals of Occupational and Environmental Medicine 2024;36:e18.
DOI: https://doi.org/10.35371/aoem.2024.36.e18
Published online: July 10, 2024
Department of Occupational and Environmental Medicine, Soonchunhyang University Cheonan Hospital, Cheonan, Korea.
- Correspondence: Eun-Chul Jang. Department of Occupational and Environmental Medicine, Soonchunhyang University Cheonan Hospital, 31 Suncheonhyang 6-gil, Dongnam-gu, Cheonan 31151, Korea. oemdr10@gmail.com
• Received: December 28, 2023 • Revised: March 31, 2024 • Accepted: April 17, 2024
Copyright © 2024 Korean Society of Occupational & Environmental Medicine
This is an Open Access article distributed under the terms of the Creative Commons Attribution Non-Commercial License (https://creativecommons.org/licenses/by-nc/4.0/) which permits unrestricted non-commercial use, distribution, and reproduction in any medium, provided the original work is properly cited.
- 126 Views
- 3 Download
Abstract
-
Background Disturbance of circadian rhythms caused by shift work has adverse effects on insulin resistance. Many previous studies have confirmed that shift work and insulin resistance are related using homeostasis model assessment-insulin resistance, one of the insulin resistance indicators. However, the triglycerides and glucose index (TyG index) has recently been studied as an insulin resistance indicator. The aim of this study is to investigate the association of shift work and TyG index, one of the indirect indicators of insulin resistance, using results of health checkups in one workplace.
-
Methods Based on medical examination data collected in February 2019, a total of 3,794 subjects from one chemical plant in Korea were selected for this study. Cut-off value of TyG index for predicting development of diabetes mellitus (DM) was 4.69. A multiple logistic regression analysis was performed after adjusting for age, employment period, obesity, abdominal obesity, smoking, drinking, physical activity, hypertension, stroke, heart disease.
-
Results As a result of logistic regression analysis, compared to day workers, odds ratio (OR) with a TyG index above cut-off value for predicting development of DM in shift workers was 1.220 after adjusting for age, employment period, obesity, abdominal obesity, smoking, drinking, physical activity, hypertension, stroke, heart disease (Model 1, OR: 1.276; 95% confidence interval [CI]: 1.099–1.482; Model 2, OR: 1.232; 95% CI: 1.055–1.438; Model 3, OR: 1.220, 95% CI: 1.030–1.444).
-
Conclusions There was a significant association between shift work and TyG index among male workers in a chemical plant. More research studies on the association between shift work and TyG index are needed in the future.
BACKGROUND
In today’s modern society, many people work as shift workers in various occupations. In industrialized societies, shift workers account for approximately 15%–20% of all workers.1 In Korea, shift workers account for 11.6%–13.9% of wage workers according to 8th Korea National Health and Nutrition Examination Survey and the 6th Korean Working Condition Survey.2 According to the International Labour Office, shift work is defined as a method of organization of working time in which workers succeed one another at the workplace so that the establishment can operate longer than the hours of work of individual workers at different daily and night hours.3 Health effects of shift work have been studied steadily. Results have shown that shift work is associated with diabetes.4,5,6
In terms of pathophysiological causes of diabetes, insulin resistance is a hallmark of type 2 diabetes.7
Several methods can be used to assess insulin resistance, including insulin tolerance test, hyperinsulinemic euglycemic clamp (HIEC) technique, insulin suppression test, and so on. Of these methods, the HIEC technique is the gold standard for assessing insulin resistance. However, these methods are time-consuming, labor intensive, and expensive to use clinically.8,9 For these reasons, indirect methods have been proposed for estimating insulin resistance, including homeostasis model assessment-insulin resistance (HOMA-IR), visceral adiposity index, lipid accumulation product, and recently triglycerides and glucose (TyG) index.10 Among them, HOMA-IR is a currently widely used indirect indicator of insulin resistance.11 TyG index was made with the idea that insulin action based on lipids may help identify subjects with insulin resistance and that hypertriglyceridemia is the characteristic dyslipidemia in subjects with insulin resistance. Also, it has been reported that elevated triglycerides (TGs) levels interfere with glucose metabolism in muscles, consistent with the hypothesis that TG elevation in serum and tissue is related to decreased insulin sensitivity. And in 2010, Unger et al.12 showed that TyG index could be a useful estimate of insulin resistance. TyG index was compared to the HIEC technique, and was shown to have good sensitivity and specificity for insulin resistance detection. However, in a study including HOMA-IR which has previously been used as a representative of indirect indicators of insulin resistance, the TyG index was a better predictor than other indirect indicators of insulin resistance for predicting the development of diabetes mellitus (DM).13 In addition, when calculating HOMA-IR, fasting insulin and fasting blood sugar (FBS) levels are required, but when calculating the TyG index, only TG and FBS levels are required instead of fasting insulin, which are values that are examined during special health examinations of shift workers, so there is an advantage that it can be obtained only by special health examination results. Therefore, the purpose of this study is to investigate the association of shift work and TyG index, one of the indirect indicators of insulin resistance, using results of health checkups in one workplace.
METHODS
This study used health examination records of workers in a chemical plant of Korea. The medical examination period was from February 11, 2019 to February 28, 2019. A total of 3,794 people aged 21 to 62 years underwent health examinations. Among them, 8 subjects were excluded due to insufficient data. In addition, 234 subjects with lipid-lowering medications and 118 subjects with a clinical history of DM were excluded.13 And the chemical plant, the subject of this study is a company that manufactures various batteries and electronic materials. In this study, workers were exposed to a total of 42 hazardous substances including noise, organic compounds such as methanol, acetonitrile, metals such as iron oxide, acids such as hydrogen chloride, gases such as sulfur dioxide, dusts such as mineral dusts. Based on guidelines for worker’s health examination published in December 2021 by Korea Occupational Safety & Health Agency, harmful factor affecting their FBS or lipid levels was acetonitrile.14 Accordingly, 208 people who were exposed to acetonitrile were excluded. Female workers were excluded because among the final 3,226 subjects, there were only 198 (6.1%) female workers. Among male workers, there were 1,094-day workers and 1,934 shift workers. Thus, the number of shift workers was approximately 1.8 times the number of day workers. Among female workers, there were 167-day workers and 31 shift workers, with the majority being day workers. Female workers were excluded because the ratio of day workers to shift workers in female workers was significantly different from that in male workers. And for shift work, the minimum exposure period was established as 6 months, and 2 subjects were excluded accordingly. Finally, a total of 3,026 subjects were analyzed in this study (Fig. 1).

Age, employment period, smoking, drinking, physical activity, body mass index (BMI), and waist circumference were obtained from measurements and questionnaires. Age was classified into 4 groups: “20–29 years,” “30–39 years,” “40–49 years,” and “50 years or older.” Employment period was defined as the period from the start of work to the date of health examination. Employment period was classified into 3 groups: “less than 10 years,” “10–19 years,” and “20 years or more.” Physical activity was classified into 3 groups of “risk,” “recommended exercise,” and “strong recommendation” according to the criteria of the World Health Organization guidelines on physical activity by examining weekly aerobic activity information through a health examination questionnaire.15 “Risk” was defined as < 150 minutes of moderate-intensity aerobic physical activity, or < 75 minutes of vigorous-intensity aerobic physical activity, or an equivalent combination of moderate-intensity and vigorous-intensity activity throughout the week. “Recommended exercise” was defined as 150–300 minutes of moderate-intensity aerobic physical activity, or 75–150 minutes of vigorous-intensity aerobic physical activity, or an equivalent combination of moderate-intensity and vigorous-intensity activity throughout the week. “Strong recommendation” was defined as moderate-intensity aerobic physical activity to > 300 minutes, or vigorous-intensity aerobic physical activity > 150 minutes, or an equivalent combination of moderate-intensity and vigorous-intensity activity throughout the week. Smoking status was classified into 3 groups: “non-smokers,” “past-smokers,” and “current-smokers.” Drinking status was classified into 3 groups: “non-drinkers,” “people who drink equal to or less than once a week,” and “people who drink more than once a week.” BMI was classified into 2 groups: “< 25 kg/m2(non-obesity)” and “≥ 25 kg/m2(obesity).”16 Waist circumference was classified into 2 groups: “< 90 cm (non-abdominal obesity)” and “≥ 90 cm (abdominal obesity).”16
Shift workers were defined as workers if they performed a monthly average of more than four 8-hour work shifts that included hours from 12 a.m. to 5 a.m. for 6 months or if they worked more than 60 hours per month on average between 10 p.m. and 6 a.m. for 6 months.17 The shift work at this workplace had a 3-group-3-shift system. Shift workers' work schedule was 06:00–14:00 for day shift, 14:00–22:00 for evening shift, and 22:00–06:00 for night shift.
Those with a clinical history of DM had at least one of the following conditions: fasting glucose concentration was ≥ 126 mg/dL or the use of glucose-lowering medication at the time of examination.13
TyG index was calculated with the following formula13:
The cut-off value of TyG index for predicting development of DM was 4.69.13
Student's t-test and χ2 test were conducted to compare general characteristics, occupational characteristics, physical examination, and laboratory test values after dividing subjects according to shift work. The χ2 test was also conducted to examine variables of study subjects according to the TyG index. Continuous variables were expressed as mean and standard deviation. Categorical variables were expressed as numbers and proportion.
Logistic regression analysis was conducted to investigate the relationship between shift work and TyG index. In the crude model (Model 1), a simple logistic regression analysis was performed to evaluate the association between shift work and TyG index. In Model 2, multiple logistic regression analysis was performed by adjusting for age. In Model 3, multiple logistic regression analysis was performed by adjusting for age, employment period, obesity, abdominal obesity, smoking, drinking, physical activity, hypertension,18 stroke,19 and heart disease.20 All Statistical analyses were performed using SPSS version 26.0 (IBM Corp., Armonk, NY, USA) and p-values of less than 0.05 were considered to be statistically significant.
This study was approved by the Institutional Review Board (IRB) review of Soonchunhyang University Cheonan Hospital (IRB No. 2023-05-027).
RESULTS
Table 1 shows general characteristics and occupational characteristics of subjects according to the presence or absence of shift work. A total of 3,026 people were finally analyzed, of which 1,094 were day workers and 1,932 were shift workers. Regarding age, the average age was 34.47 ± 7.73 years for all workers. Regarding average age, there was no difference statistically. Regarding employment period, the average employment period of day workers was 84.84 ± 94.27 months, which was shorter than the average employment period of shift workers at 124.13 ± 87.60 months. The proportion of those with long-term employment periods of 10–19 years and 20 years or more was higher in shift workers than in day workers. Regarding smoking status, past smokers and current smokers had higher proportions in shift workers than in day workers. For drinking status, “more than once a week” had a higher proportion in day workers than in shift workers. For physical activity, percentage of “risk” was higher in day workers than in shift workers. For BMI, the rate of obesity was higher in shift workers than in day workers. Regarding the rate of abdominal obesity, there was no difference statistically.
Table 1
Characteristics of study subjects by shift work
Table 2 shows results of physical examination and laboratory tests of subjects according to the presence or absence of shift work. Systolic blood pressure (SBP) was 128.95 ± 8.59 mmHg in day workers and 129.97 ± 9.22 mmHg in shift workers. Diastolic blood pressure (DBP) was 79.69 ± 7.36 mmHg in day workers and 81.03 ± 7.51 mmHg in shift workers. Both SBP and DBP were higher in shift workers. Regarding the FBS and total cholesterol and low-density lipoprotein cholesterol and high-density lipoprotein cholesterol, there were no differences statistically. TG was higher in shift workers than in day workers (143.34 ± 92.39 mg/dL in shift workers vs. 135.30 ± 109.77 mg/dL in day workers). TyG index was higher in shift workers than in day workers (4.69 ± 0.27 in shift workers vs. 4.66 ± 0.28 in day workers).
Table 2
Results of the physical examination and laboratory tests of the subjects by shift work
Table 3 shows variables of study subjects according to TyG index. There were 1,626 subjects with a TyG index lower than 4.69 and 1,400 subjects with a TyG index higher than 4.69. Regarding shift work, the proportion of shift workers was higher in high TyG index than in low TyG index. Regarding age, the proportion of age groups over 30s was higher in high TyG index than in low TyG index. Regarding employment period, the proportion of those with long-term employment periods of 10–19 years and 20 years or more was higher in high TyG index than in low TyG index. Regarding smoking status, past smokers and current smokers had higher proportions in high TyG index than in low TyG index. For drinking status, “more than once a week” had a higher proportion in high TyG index than in low TyG index. For physical activity, percentage of “risk” was higher in high TyG index than in low TyG index. For BMI, the rate of obesity (BMI ≥ 25) was higher in high TyG index than in low TyG index. Regarding waist circumference, the rate of abdominal obesity (a waist circumference of ≥ 90 cm) was higher in high TyG index than in low TyG index. Regarding hypertension, the rate of hypertension was higher in high TyG index than in low TyG index. Regarding stroke and heart disease, there were no differences statistically.
Table 3
Variables of study subjects by TyG index
Table 4 shows results of logistic regression analysis to investigate the relationship between shift work and TyG index. In Model 1, a simple logistic regression analysis was performed without adjusting for any factors. Compared to day workers, odds ratio (OR) with a TyG index above cut-off value for predicting development of DM was higher in shift workers (OR: 1.276; 95% confidence interval [CI]: 1.099–1.482). In Model 2, multiple logistic regression analysis was performed by adjusting for age. Compared to day workers, OR with a TyG index above cut-off value for predicting development of DM was higher in shift workers (OR: 1.232; 95% CI: 1.055–1.438). In Model 3, multiple logistic regression analysis was performed by adjusting for age, employment period, obesity, abdominal obesity, smoking, drinking, physical activity, hypertension,18 stroke,19 heart disease.20 Compared to day workers, OR with a TyG index above cut-off value for predicting development of DM was higher in shift workers (OR: 1.220; 95% CI: 1.030–1.444). To exclude the problem of multicollinearity between age and employment period, and between obesity and abdominal obesity, variance inflation factors (VIFs) were calculated. VIF values were 2.106 and 1.395, respectively.
Table 4
Association between shift work and triglycerides and glucose index
| Group | Model 1 | Model 2 | Model 3 |
|---|---|---|---|
| Day workers | 1.000 (reference) | 1.000 (reference) | 1.000 (reference) |
| Shift workers | 1.276 (1.099–1.482)** | 1.232 (1.055–1.438)** | 1.220 (1.030–1.444)* |
DISCUSSION
In this study, there was a relationship between shift work and TyG index. As shown in Table 4, the OR of TyG index above the cut-off value for predicting development of DM for shift workers was 1.220 (95% CI: 1.030–1.444), even after adjusting for age, employment period, obesity, abdominal obesity, smoking, drinking, physical activity, hypertension, stroke, heart disease.
In this study, the cut-off value of TyG index for predicting development of DM was 4.69. This was a value derived from a study by Kim et al.13 reporting cut-off values of surrogate measures for insulin resistance. Kim et al.13 have suggested that the valid cut-off value of TyG index for predicting development of DM is 4.69 using data from a population-based longitudinal study. In their study, this cut-off value had a sensitivity of 62.1% and a specificity of 63.1% with a hazard ratio of 2.17 (95% CI: 1.92–2.45).
Additionally, we analyzed the cut-off value not at 4.69, but at 4.64, which is the 50th percentile of the TyG index value in the study by Kim et al.,13 and 4.49, which is the 25th percentile. When 4.64, the 50th percentile value, was set as the cut-off value, the OR of TyG index above the 4.64 for shift workers was 1.190 (95% CI: 1.006–1.407), even after adjusting for age, employment period, obesity, abdominal obesity, smoking, drinking, physical activity, hypertension, stroke, heart disease. When 4.49, the 25th percentile value, was set as the cut-off value, the OR of TyG index above the 4.49 for shift workers was 1.374 (95% CI: 1.143–1.652), even after adjusting for age, employment period, obesity, abdominal obesity, smoking, drinking, physical activity, hypertension, stroke, heart disease. Both studies showed statistically significant results, and in particular, when the 25th percentile value of 4.49 was used as the cut-off value, the result was more statistically significant than the result of this study. In study by Kim et al.,13 the cut-off value of TyG index for predicting development of DM was 4.69, but additional researches may be needed to find the optimal cut-off value.
As can be seen in Table 3, relationships between heart disorder, stoke, and TyG index were not significant. This was in contrast to previous studies. Such difference might be because subjects of the present study were young with few people having a history of heart disease and stroke. If they had previously suffered from these diseases, they were likely to be not working currently. In addition, the actual number of people diagnosed with those diseases might have been underestimated as it was the result of a survey through a self-report-based questionnaire. According to a Korean stroke epidemiological report in 2018, the prevalence rate of stroke was 1.90% in adult men with age over 19 years, 0.71% in the age group of 19–54, and 4.48% in the age group of 55–74 years.21 However, the prevalence rate of stroke was lower in subjects of this study.
There have been studies on mechanism between shift work and insulin resistance, which is considered pathophysiological cause of diabetes. Circadian rhythm is known to be involved in the mechanism by which shift work affects insulin resistance.22 The shift work at this workplace had a 3-group-3-shift system. In this study, the reason for the relationship between shift work and TyG index might be due to desynchronization of circadian rhythm known as misalignment of internal rhythm and external environments caused by shift work.
Diabetes is a chronic disease that requires lifelong management. It can cause complications. Thus, early detection is important in early stages. However, early detection might be difficult because there are no special subjective symptoms. Thus, the use of TyG index can help us select and manage subjects at high risk of developing diabetes. TyG index can be monitored by periodic health checkups.
Similar to results of this study, previous studies have also confirmed that shift work and insulin resistance indicators are related. In a study conducted by Ledda et al.,23 on healthcare workers in the city of Catania, Italy, there was a positive association between shift work and HOMA-IR, one of the insulin resistance indicators. In a study conducted by Sadeghniiat-Haghighi et al.,24 on professional drivers, shift drivers displayed higher levels of HOMA-IR. However, the majority of previous studies mainly used HOMA-IR as an indicator of insulin resistance, with most previous studies confirming the relationship between shift work and HOMA-IR.
However, in this study, the TyG index rather than the mainly used HOMA-IR was used as an insulin resistance index. This is because the TyG index, like HOMA-IR, is simple, non-invasive, and in-expensive compared to direct indicators of insulin resistance.8,9 In addition, it is a better predictor for diabetes than HOMA-IR.13 Also, according to a study of TyG index as a predictor of diabetes compared to fasting plasma glucose and TGs by Navarro-González et al.,25 the areas under the receiver operating characteristic curves (95% CI) were 0.75 (0.70–0.81) for TyG index, 0.66 (0.60–0.72) for fasting plasma glucose and 0.71 (0.65–0.77) for TGs. The TyG index was a better predictor for diabetes than fasting plasma glucose or TGs. Moreover, the TyG index does not require fasting insulin measurement which is required when calculating HOMA-IR. Only TGs and FBS, which can be tested more easily, are used for calculating TyG index, making it simpler and less expensive than HOMA-IR. And TGs and FBS are values that are examined during special health examinations of shift workers, so there is an advantage that it can be obtained only by special examination results.
This study has several limitations. First, since this study was a cross-sectional study, there was a limit in inferring a causal relationship. Secondly, this study was conducted using medical examination records with a limit to information on shift work. There were limitations due to the nature of medical examinations that provide fixed questionnaires. At the time of medical examination, it was possible to confirm whether the workers were day workers or shift workers, but it was impossible to verify whether day workers exclusively engage in day work and shift workers solely in shift work. And it was also impossible to verify past experiences with shift work. In addition, we could not obtain information on the duration of shift work among employment periods. The employment periods of workers were calculated as the period from the start of work to the date of health examination, and it was not possible to distinguish between pure day working years and pure shift working years. Since there is a study showing that longer duration of shift work is associated with DM,26 the inability to confirm the duration of shift work can be seen as a limitation of this study. Third, in a previous study using TyG index as a predictor for DM, those with glucose concentration ≥ 200 mg/dL in an oral 75-g 2-hour glucose tolerance test and those with HbA1c ≥ 6.5% were also excluded in that study.13 However, this figure was not reflected in the present study because it could not be confirmed in health examination data. Finally, subjects of this study had an average age of 34.47 years, which was younger than the average age of manufacturing workers at 42.1 years in the year of health check-up (in 2019).27 Therefore, it is difficult to generalize these fragmentary research results. In addition, since the average age of the subjects of the existing researches studied on TyG index is significantly higher than that of this study, there is a lack of researches that can be compared with the results of this study. It is thought that further researches are needed in the future
Despite these limitations, this study is significant in that it is a study using TyG index which is not yet widely used because it is relatively recent index, which is easier and cheaper to calculate and simpler than using previously widely used indicators such as HOMA-IR because TyG index can be calculated only with FBS and TGs. In addition, this is the first study on the relationship between shift work and TyG index using more than 3,000 workers in a single workplace.
CONCLUSIONS
There was a significant association between shift work and TyG index among male workers in a chemical plant. Based on previous studies showing that TyG index is valuable as a predictor for diabetes,13,25,28 it will be necessary to consider ways to pay attention to and manage TyG index in terms of health care for shift workers. However, as mentioned earlier, this study had several limitations. Further studies are needed to correct limitations of this study.
Acknowledgements
We would like to thank Harrisco (www.harrisco.net) for English language editing.
-
Funding: This work was supported by the Soonchunhyang University Research Fund.
-
Competing interests: The authors declare that they have no competing interests.
-
Authors contributions:
NOTES
Abbreviations
BMI
body mass index
CI
confidence interval
DBP
diastolic blood pressure
DM
diabetes mellitus
FBS
fasting blood sugar
HDL
high-density lipoprotein
HIEC
hyperinsulinemic euglycemic clamp
HOMA-IR
homeostasis model assessment-insulin resistance
LDL
low-density lipoprotein
OR
odds ratio
SBP
systolic blood pressure
TG
triglyceride
TyG index
triglycerides and glucose index
VIF
variance inflation factor
- 1. Sweileh WM. Analysis and mapping of global research publications on shift work (2012-2021). J Occup Med Toxicol 2022, 17(1):22. 36514070.ArticlePubMedPMCPDF
- 2. Jang TW. Working hours and the regulations for night shift workers. Ann Occup Environ Med 2023, 35(1):e19. 37928372.ArticlePubMedPMCPDF
- 3. International Labour Office. Shift work. Updated 2005]. Accessed December 14, 2023]. https://www.ilo.org/wcmsp5/groups/public/---ed_protect/---protrav/---travail/documents/publication/wcms_170713.pdf .
- 4. Gan Y, Yang C, Tong X, Sun H, Cong Y, Yin X, et al. Shift work and diabetes mellitus: a meta-analysis of observational studies. Occup Environ Med 2015, 72(1):72–78. 25030030.ArticlePubMed
- 5. Li W, Chen Z, Ruan W, Yi G, Wang D, Lu Z. A meta-analysis of cohort studies including dose-response relationship between shift work and the risk of diabetes mellitus. Eur J Epidemiol 2019, 34(11):1013–1024. 31512118.ArticlePubMedPDF
- 6. Gao Y, Gan T, Jiang L, Yu L, Tang D, Wang Y, et al. Association between shift work and risk of type 2 diabetes mellitus: a systematic review and dose-response meta-analysis of observational studies. Chronobiol Int 2020, 37(1):29–46. 31684766.ArticlePubMed
- 7. American Diabetes Association. Understanding insulin resistance. Updated 2009]. Accessed December 14, 2023]. https://diabetes.org/health-wellness/insulin-resistance .
- 8. Patarrão RS, Lautt WW, Macedo MP. Assessment of methods and indexes of insulin sensitivity. Port J Endocrinol Diabetes Metab 2014, 9(1):65–73.Article
- 9. Minh HV, Tien HA, Sinh CT, Thang DC, Chen CH, Tay JC, et al. Assessment of preferred methods to measure insulin resistance in Asian patients with hypertension. J Clin Hypertens (Greenwich) 2021, 23(3):529–537. 33415834.ArticlePubMedPMCPDF
- 10. Ahn N, Baumeister SE, Amann U, Rathmann W, Peters A, Huth C, et al. Visceral adiposity index (VAI), lipid accumulation product (LAP), and product of triglycerides and glucose (TyG) to discriminate prediabetes and diabetes. Sci Rep 2019, 9(1):9693. 31273286.ArticlePubMedPMCPDF
- 11. Son DH, Lee HS, Lee YJ, Lee JH, Han JH. Comparison of triglyceride-glucose index and HOMA-IR for predicting prevalence and incidence of metabolic syndrome. Nutr Metab Cardiovasc Dis 2022, 32(3):596–604. 35090800.ArticlePubMed
- 12. Unger G, Benozzi SF, Perruzza F, Pennacchiotti GL. Triglycerides and glucose index: a useful indicator of insulin resistance. Endocrinol Nutr 2014, 61(10):533–540. 25174769.ArticlePubMed
- 13. Kim B, Choi HY, Kim W, Ahn C, Lee J, Kim JG, et al. The cut-off values of surrogate measures for insulin resistance in the Korean population according to the Korean Genome and Epidemiology Study (KOGES). PLoS One 2018, 13(11):e0206994. 30419056.ArticlePubMedPMC
- 14. Occupational Safety and Health Research Institute (OSHRI). Guidelines for Workers’ Health Examination, Volume 2. Ulsan, Korea: OSHRI; 2021.
- 15. Bull FC, Al-Ansari SS, Biddle S, Borodulin K, Buman MP, Cardon G, et al. World Health Organization 2020 guidelines on physical activity and sedentary behaviour. Br J Sports Med 2020, 54(24):1451–1462. 33239350.ArticlePubMedPMC
- 16. Kim BY, Kang SM, Kang JH, Kang SY, Kim KK, Kim KB, et al. 2020 Korean Society for the Study of Obesity guidelines for the management of obesity in Korea. J Obes Metab Syndr 2021, 30(2):81–92. 34045368.ArticlePubMedPMC
- 17. Ministry of Employment and Labor (KR). Enforcement rules of the Occupational Safety and Health Act. Attached Table 12-2 (special health examination harmful agents). Updated 2019]. Accessed December 14, 2023]. https://www.law.go.kr/LSW/lsInfoP.do?lsiSeq=207627&ancYd=20190131&ancNo=00241&efYd=20190131&nwJoYnInfo=N&efGubun=Y&chrClsCd=010202&ancYnChk=0#0000 .
- 18. Lee DH, Park JE, Kim SY, Jeon HJ, Park JH. Association between the triglyceride-glucose (TyG) index and increased blood pressure in normotensive subjects: a population-based study. Diabetol Metab Syndr 2022, 14(1):161. 36309720.ArticlePubMedPMCPDF
- 19. Yang Y, Huang X, Wang Y, Leng L, Xu J, Feng L, et al. The impact of triglyceride-glucose index on ischemic stroke: a systematic review and meta-analysis. Cardiovasc Diabetol 2023, 22(1):2. 36609319.ArticlePubMedPMCPDF
- 20. Liang S, Wang C, Zhang J, Liu Z, Bai Y, Chen Z, et al. Triglyceride-glucose index and coronary artery disease: a systematic review and meta-analysis of risk, severity, and prognosis. Cardiovasc Diabetol 2023, 22(1):170. 37415168.ArticlePubMedPMCPDF
- 21. Korean Stroke Society. Stroke fact sheet in Korea 2018. Updated 2018]. Accessed December 14, 2023]. http://www.stroke.or.kr/bbs/skin/notice_popup/download.php?code=epidemic1&number=5306 .
- 22. Bahinipati J, Sarangi R, Pathak M, Mohapatra S. Effect of night shift on development of metabolic syndrome among health care workers. J Family Med Prim Care 2022, 11(5):1710–1715. 35800539.ArticlePubMedPMC
- 23. Ledda C, Cinà D, Matera S, Mucci N, Bracci M, Rapisarda V. High HOMA-IR index in healthcare shift workers. Medicina (Kaunas) 2019, 55(5):186. 31121834.ArticlePubMedPMC
- 24. Sadeghniiat-Haghighi K, Abbaslou F, Akbar Sharifian S, Izadi N. Shift work and insulin resistance (HOMA-IR) among professional drivers. Work 2022, 72(2):595–600. 35527601.ArticlePubMed
- 25. Navarro-González D, Sánchez-Íñigo L, Pastrana-Delgado J, Fernández-Montero A, Martinez JA. Triglyceride-glucose index (TyG index) in comparison with fasting plasma glucose improved diabetes prediction in patients with normal fasting glucose: the Vascular-Metabolic CUN cohort. Prev Med 2016, 86:99–105. 26854766.ArticlePubMed
- 26. Kawachi I, Colditz GA, Stampfer MJ, Willett WC, Manson JE, Speizer FE, et al. Prospective study of shift work and risk of coronary heart disease in women. Circulation 1995, 92(11):3178–3182. 7586301.ArticlePubMed
- 27. Ministry of Employment and Labor (KR). Age, days, payment, workers by industry, education, 2019. Updated 2020]. Accessed December 14, 2023]. http://stathtml.moel.go.kr/statHtml/statHtml.do?orgId=118&tblId=DT_118N_PAYN32&conn_path=I2 .
- 28. Lee DY, Lee ES, Kim JH, Park SE, Park CY, Oh KW, et al. Predictive value of triglyceride glucose index for the risk of incident diabetes: a 4-year retrospective longitudinal study. PLoS One 2016, 11(9):e0163465. 27682598.ArticlePubMedPMC
References
Figure & Data
REFERENCES
Citations
Citations to this article as recorded by 
 PubReader
 ePub Link
 Cite
Cite- Figure
-
- Related articles
-
- Burnout, stress, and their correlates among bank employees of South India: a cross-sectional study
- The association of job training duration and risk of depression among wage workers: an analysis of the mediating factors
- Mediation analysis of chronotype, sleep-related factors, and depressive symptoms among workers: a cross-sectional study
- Association between shift work and the risk of hypothyroidism in adult male workers in Korea: a cohort study
- Relationship between job stress and impaired fasting glucose in male steel industry workers: a cross-sectional study
The association of shift work and TyG index among male workers in a chemical plant of Korea: a cross-sectional study
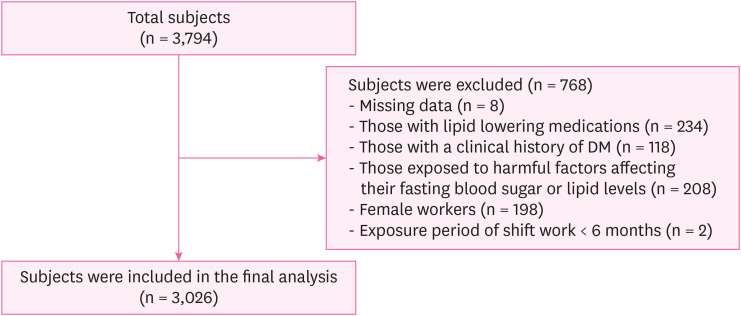
Fig. 1 Flowchart showing the final selection.DM: diabetes mellitus.
Fig. 1
The association of shift work and TyG index among male workers in a chemical plant of Korea: a cross-sectional study
| Variable | Categories | Total (n = 3,026) | Day workers (n = 1,094) | Shift workers (n = 1,932) | |
|---|---|---|---|---|---|
| Age (years) | 34.47 ± 7.73 | 34.23 ± 8.14 | 34.61 ± 7.48 | 0.209a | |
| 20–29 | 888 (29.3) | 363 (33.2) | 525 (27.2) | 0.001b | |
| 30–39 | 1,477 (48.8) | 493 (45.1) | 984 (50.9) | ||
| 40–49 | 491 (16.2) | 166 (15.2) | 325 (16.8) | ||
| 50 over | 170 (5.6) | 72 (6.6) | 98 (5.1) | ||
| Employment period (years) | 109.93 ± 92.01 | 84.84 ± 94.27 | 124.13 ± 87.60 | < 0.001a | |
| < 10 | 2,202 (72.8) | 881 (80.5) | 1,321 (68.4) | < 0.001b | |
| 10–19 | 531 (17.5) | 122 (11.2) | 409 (21.2) | ||
| ≥ 20 | 293 (9.7) | 91 (8.3) | 202 (10.5) | ||
| Smoking | No | 1,320 (43.6) | 539 (49.3) | 781 (40.4) | < 0.001b |
| Past | 641 (21.2) | 229 (20.9) | 412 (21.3) | ||
| Current | 1,065 (35.2) | 326 (29.8) | 739 (38.3) | ||
| Drinking (day/week) | No | 214 (7.1) | 53 (4.8) | 161 (8.3) | 0.001b |
| ≤ 1 | 1,071 (35.4) | 384 (35.1) | 687 (35.6) | ||
| > 1 | 1,741 (57.5) | 657 (60.1) | 1,084 (56.1) | ||
| Physical activity | Risk | 1,523 (50.3) | 612 (55.9) | 911 (47.2) | < 0.001b |
| Recommended exercise | 646 (21.3) | 232 (21.2) | 414 (21.4) | ||
| Strong recommendation | 857 (28.3) | 250 (22.9) | 607 (31.4) | ||
| BMI (kg/m2) | < 25 | 1,587 (52.4) | 600 (54.8) | 987 (51.1) | 0.047b |
| ≥ 25 | 1,439 (47.5) | 494 (45.2) | 945 (48.9) | ||
| Waist circumference (cm) | < 90 | 2,349 (77.6) | 847 (77.4) | 1,502 (77.7) | 0.839b |
| ≥ 90 | 677 (22.4) | 247 (22.6) | 430 (22.3) |
| Physical examinations and laboratory test | Total (n = 3,026) | Day workers (n = 1,094) | Shift workers (n = 1,932) | |
|---|---|---|---|---|
| SBP (mmHg) | 129.60 ± 9.01 | 128.95 ± 8.59 | 129.97 ± 9.22 | 0.003 |
| DBP (mmHg) | 80.54 ± 7.49 | 79.69 ± 7.36 | 81.03 ± 7.51 | < 0.001 |
| FBS (mg/dL) | 96.69 ± 8.53 | 96.69 ± 8.56 | 96.70 ± 8.51 | 0.967 |
| Total cholesterol (mg/dL) | 194.17 ± 32.67 | 193.02 ± 33.03 | 194.82 ± 32.46 | 0.146 |
| LDL cholesterol (mg/dL) | 128.50 ± 31.02 | 128.00 ± 31.44 | 128.78 ± 30.79 | 0.564 |
| TG (mg/dL) | 140.43 ± 99.08 | 135.30 ± 109.77 | 143.34 ± 92.39 | 0.032 |
| HDL cholesterol (mg/dL) | 53.86 ± 12.71 | 54.10 ± 12.88 | 53.72 ± 12.61 | 0.435 |
| TyG index | 4.68 ± 0.28 | 4.66 ± 0.28 | 4.69 ± 0.27 | < 0.001 |
| Variable | Categories | Total (n = 3,026) | TyG index < 4.69 (n = 1,626) | TyG index ≥ 4.69 (n = 1,400) | |
|---|---|---|---|---|---|
| Shift work | No | 1,094 (36.2) | 630 (38.7) | 464 (33.1) | 0.001 |
| Yes | 1,932 (63.8) | 996 (61.3) | 936 (66.9) | ||
| Age (years) | 20–29 | 888 (29.3) | 634 (39.0) | 254 (18.1) | < 0.001 |
| 30–39 | 1,477 (48.8) | 752 (46.2) | 725 (51.8) | ||
| 40–49 | 491 (16.2) | 179 (11.0) | 312 (22.3) | ||
| 50 over | 170 (5.6) | 61 (3.8) | 109 (7.8) | ||
| Employment period (years) | < 10 | 2,202 (72.8) | 1,310 (80.6) | 892 (63.7) | < 0.001 |
| 10–19 | 531 (17.5) | 216 (13.3) | 315 (22.5) | ||
| ≥ 20 | 293 (9.7) | 100 (6.2) | 193 (13.8) | ||
| Smoking | No | 1,320 (43.6) | 858 (52.8) | 462 (33.0) | < 0.001 |
| Past | 641 (21.2) | 295 (18.1) | 346 (24.7) | ||
| Current | 1,065 (35.2) | 473 (29.1) | 592 (42.3) | ||
| Drinking (day/week) | No | 214 (7.1) | 119 (7.3) | 95 (6.8) | < 0.001 |
| ≤ 1 | 1,071 (35.4) | 645 (39.7) | 426 (30.4) | ||
| > 1 | 1,741 (57.5) | 862 (53.0) | 879 (62.8) | ||
| Physical activity | Risk | 1,523 (50.3) | 736 (45.3) | 787 (56.2) | < 0.001 |
| Recommended exercise | 646 (21.3) | 361 (22.2) | 285 (20.4) | ||
| Strong recommendation | 857 (28.3) | 529 (32.5) | 328 (23.4) | ||
| BMI (kg/m2) | < 25 | 1,587 (52.4) | 1,034 (63.6) | 553 (39.5) | < 0.001 |
| ≥ 25 | 1,439 (47.6) | 592 (36.4) | 847 (60.5) | ||
| Waist circumference (cm) | < 90 | 2,349 (77.6) | 1,402 (86.2) | 947 (67.6) | < 0.001 |
| ≥ 90 | 677 (22.4) | 224 (13.8) | 453 (32.4) | ||
| Hypertension | No | 2,722 (90.0) | 1,541 (94.8) | 1,181 (84.4) | < 0.001 |
| Yes | 304 (10.0) | 85 (5.2) | 219 (15.6) | ||
| Stroke | No | 3,025 (100.0) | 1,626 (100.0) | 1,399 (99.9) | 0.463 |
| Yes | 1 (0.0) | 0 (0.0) | 1 (0.1) | ||
| Heart disease | No | 3,013 (99.6) | 1,619 (99.6) | 1,394 (99.6) | 0.994 |
| Yes | 13 (0.4) | 7 (0.4) | 6 (0.4) |
| Group | Model 1 | Model 2 | Model 3 |
|---|---|---|---|
| Day workers | 1.000 (reference) | 1.000 (reference) | 1.000 (reference) |
| Shift workers | 1.276 (1.099–1.482)** | 1.232 (1.055–1.438)** | 1.220 (1.030–1.444)* |
Table 1 Characteristics of study subjects by shift work
Categorical variables are presented as number (%). Continuous variables are presented as mean ± standard deviation.
BMI: body mass index.
aCalculated by Student’s t-test; bCalculated by χ2 test.
Table 2 Results of the physical examination and laboratory tests of the subjects by shift work
Values are presented as mean ± standard deviation. Calculated by Student’s t-test.
SBP: systolic blood pressure; DBP: diastolic blood pressure; FBS: fasting blood sugar; LDL: low-density lipoprotein; TG: triglycerides; HDL: high-density lipoprotein; TyG index: triglycerides and glucose index.
Table 3 Variables of study subjects by TyG index
Categorical variables are presented as number (%). Calculated by χ2 test.
TyG index: triglycerides and glucose index; BMI: body mass index.
Table 4 Association between shift work and triglycerides and glucose index
Values are presented as odds ratio (95% confidence interval).
Model 1: crude; Model 2: adjusted for age; Model 3: adjusted for age, employment period, obesity, abdominal obesity, smoking, drinking, physical activity, hypertension, stroke, heart disease.
*

