Relationship between visual display terminal working hours and headache/eyestrain in Korean wage workers during the COVID-19 pandemic: the sixth Korean Working Conditions Survey
Article information
Abstract
Background
Prolonged use of visual display terminal (VDT) can cause eyestrain, dry eyes, blurred vision, double vision, headache and musculoskeletal symptoms (neck, shoulder, and wrist pain). VDT working hours among workers have greatly increased during the coronavirus disease 2019 (COVID-19) pandemic. Therefore, this study aimed to investigate the relationship between VDT working hours and headache/eyestrain in wage workers using data from the sixth Korean Working Conditions Survey (KWCS) (2020–2021) conducted during the COVID-19 pandemic.
Methods
We analyzed the sixth KWCS data of 28,442 wage workers aged 15 years or older. The headache/eyestrain that occurred in the last year was assessed. The VDT work group included workers who use VDT always, almost always, and three-fourth of the working hours, while the non-VDT work group included workers who use VDT half of the working hours, one-fourth of the working hours, almost never, and never. To analyze the relationship between VDT working hours and headache/eyestrain, the odds ratios (ORs) and 95% confidence interval (CI) were calculated using logistic regression analysis.
Results
Among the non-VDT work group, 14.4% workers experienced headache/eyestrain, whereas 27.5% workers of the VDT work group experienced these symptoms. For headache/eyestrain, the VDT work group showed adjusted OR of 1.94 (95% CI: 1.80–2.09), compared with the non-VDT work group, and the group that always used VDT showed adjusted OR of 2.54 (95% CI: 2.26–2.86), compared with the group that never used VDT.
Conclusions
This study suggests that during the COVID-19 pandemic, as VDT working hours increased, the risk of headache/eyestrain increased for Korean wage workers.
BACKGROUND
A visual display terminal (VDT) is a screening device that displays various data using a cathode ray tube, liquid crystal display, or gas plasma.1 It includes computer, tablets, e-readers, smartphones, and other electronic gadget.2 Prolonged use of VDT can cause ocular symptoms (eyestrain, dry eyes, blurred vision, and double vision), headache, and musculoskeletal symptoms (neck, shoulder, and wrist pain).345
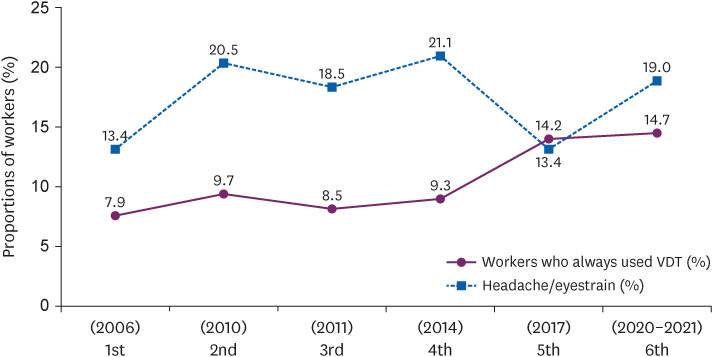
The coronavirus disease 2019 (COVID-19), first reported in December 2019, led to an increase in the rates of non-contact work and work from home. Consequently, the VDT working hours among workers greatly increased during the COVID-19 pandemic.67 The lockdown forced most people to continue using the internet and internet-based services to communicate and interact and work from home.8 A comparison between the first (2006) and sixth Korean Working Conditions Survey (KWCS) (2020–2021) revealed that the proportion of workers who always used VDT throughout their working hours increased from 7.9% to 14.7%. Additionally, the proportion of workers reporting headache/eyestrain was 13.4% in 2006 and 19.0% during 2020–2021.
Previous studies examining the association between VDT working hours and headache/eyestrain have mainly been conducted with adolescents or information technology (IT) workers, whereas studies targeting the general workforce are limited. Moreover, it is necessary to investigate the scale of the health problems that occurred during the COVID-19 pandemic.
To date, few studies have evaluated the risk of headache/eyestrain with respect to VDT working hours during the COVID-19 pandemic. Therefore, this study aimed to investigate the relationship between VDT working hours and headache/eyestrain in wage workers using data from the sixth KWCS (2020–2021) conducted during the COVID-19 pandemic.
METHODS
Data sources and study population
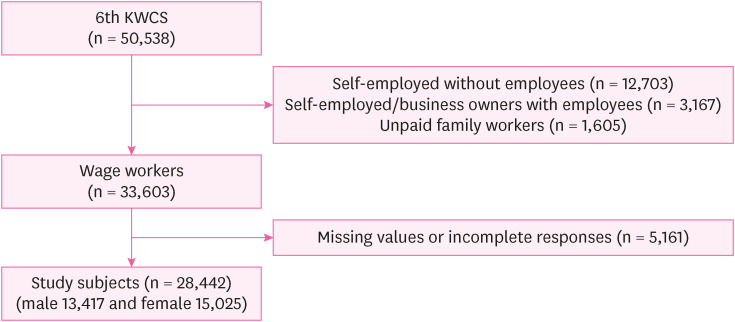
We analyzed data from the sixth KWCS conducted between 2020 and 2021 by the Occupational Safety and Health Research Institute. The KWCS is a large-scale national survey that has been conducted since 2006 to investigate occupational and environmental risk factors, and provide preliminary data for improving working conditions.9 The sixth KWCS included 50,538 employees aged ≥ 15 years, comprising 12,703 self-employed owners without employees, 3,167 self-employed/business owners with employees, 1,605 unpaid family member workers, and 5,161 workers with missing values or incomplete responses who were excluded. Finally, a total of 28,442 wage workers were included as participants in this study (Fig. 1).
Measurements
Headache/Eyestrain
The headache/eyestrain that occurred in the last year (or from the time when main work was initiated if one had worked for less than 1 year) was assessed. In the KWCS, questions about headache and eyestrain were designed as one item instead of individually.10
Daily VDT working hours
In the sixth KWCS, the participants were divided into 7 groups based on working hours spent using VDT (always, almost always, three-fourth of the working hours, half of the working hours, one-fourth of the working hours, almost never, and never). We categorized the always, almost always, and three-fourth of the working hours groups as the VDT work group and the half of the working hours, one-fourth of the working hours, almost never, and never groups as the non-VDT work group.
Sociodemographic characteristics
Sociodemographic characteristics included age (15–29, 30–39, 40–49, 50–59, and ≥ 60 years), sex, monthly income (< 2.00, 2.00–2.99, 3.00–3.99, and ≥ 4.00 million Won), and education level (elementary school, middle school, high school, and college).
Occupational characteristics
Occupational characteristics included weekly total working hours (≤ 40 hours or > 40 hours a week), working duration (< 5 years, 5–9 years, or ≥ 10 years), employee type (permanent or temporary), number of employees (< 50, 50–299, or ≥ 300), autonomy at work, night work, job stress (never, not so much, sometimes, mostly, or always), and use of communication device in free time in the past month (never, rarely, several times a month, several times a week, or every day), vibration, noise, high temperature, fume, inhalation of organic solvent vapors, secondhand smoking, painful posture, repetitive motion, sleep problem (no or yes) and occupational classification (white, pink or blue collar). In the questionnaire of the sixth KWCS, communication devices were e-mail, telephone and video conferencing, text messages, social media, and other applications (apps). This also included VDTs such as mobile phones, tablets, and computers.
Statistical analysis
Data related to the sociodemographic and occupational characteristics and headache/eyestrain, were collected. Chi-square and t-tests were conducted to analyze the distribution and mean of independent variables. Odds ratios (ORs) and 95% confidence intervals (CIs) for headache/eyestrain by VDT working hours were calculated using logistic regression analysis after adjusting sociodemographic and occupational characteristics. All statistical analyses were performed using SPSS 28.0 (IBM Inc., Armonk, NY, USA).
Ethics statement
This study’s protocol was reviewed and approved by the Institutional Review Board (IRB) of Soonchunhyang University Gumi Hospital (IRB No. 2022-12). Informed consent was obtained from all participants when they were enrolled.
RESULTS
Proportions of workers who always used VDT and experienced headache/eyestrain in the KWCS
In the KWCS questionnaire contents, participants were divided into 7 groups based on working hours spent using VDT (always, almost always, three-fourth of the working hours, half of the working hours, one-fourth of the working hours, almost never, and never). Among these groups, the proportions of workers who always used VDT were 7.9%, 9.7%, 8.5%, 9.3%, 14.2%, and 14.7% in the first (2006), second (2010), third (2011), fourth (2014), fifth (2017), and sixth (2020–2021) KWCSs, respectively, showing a gradual increase. The proportion of workers who experienced headache/eye strain was 13.4% in the first (2006) KWCS and 19.0% in the sixth (2020–2021) KWCS (Fig. 2).
Proportions of headache/eyestrain by sociodemographic and occupational characteristics
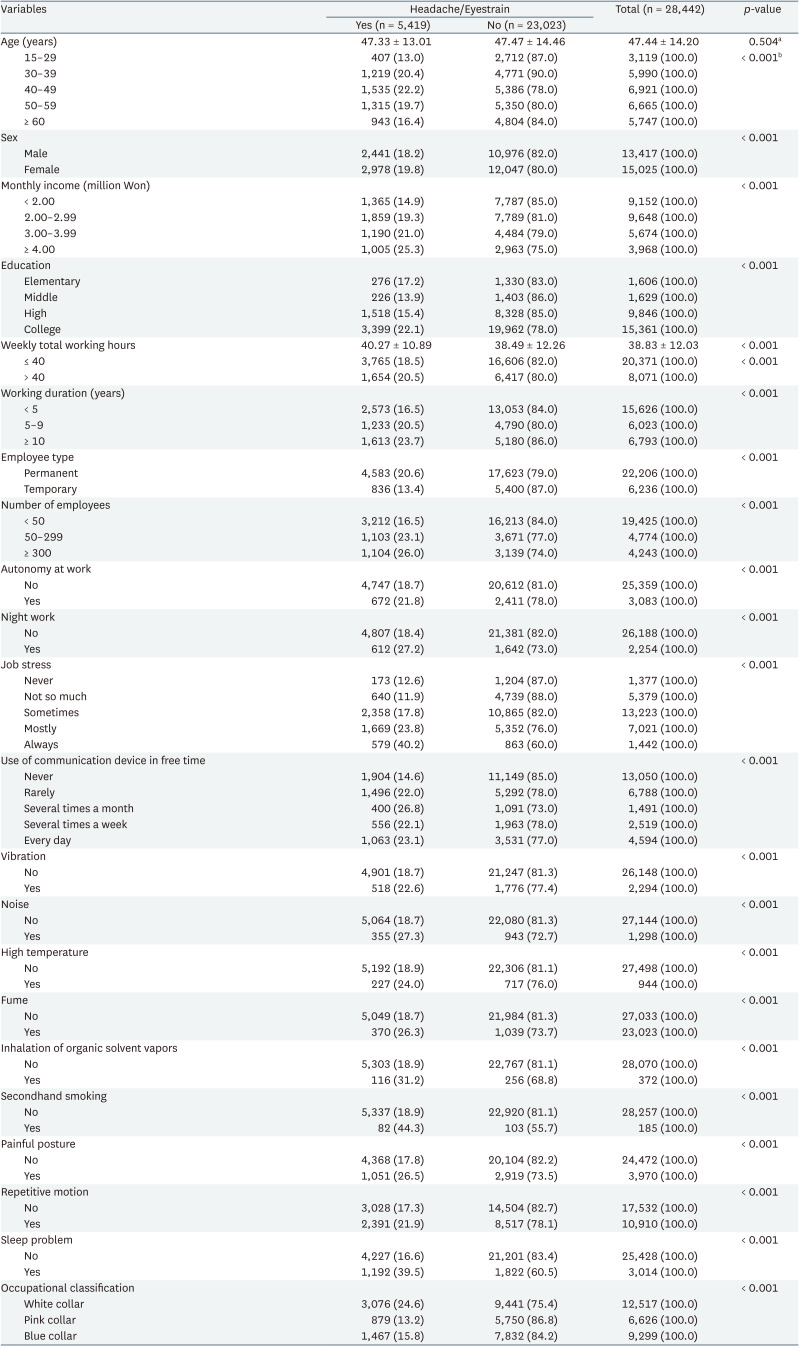
Among the 28,442 workers included in the final analysis, 5,419 (19.1%) experienced headache/eyestrain, whereas 23,023 (80.9%) did not experience the symptoms. Most workers who experienced headache/eyestrain were aged 40–49 years old (22.2%), and a higher proportion of women (19.8%) than men (18.2%) experienced symptoms. Most workers (25.3%) who experienced symptoms were in the highest income group (≥ 4.00 million Won), while the lowest proportion (14.9%) of those who experienced symptoms was in the lowest income group (< 2.00 million Won). Additionally, 17.2% and 22.1% of workers who were in the elementary school and college groups, respectively experienced symptoms. Among those who worked ≤ 40 hours weekly, 18.5% experienced headache/eyestrain, while 20.5% of those who worked > 40 hours weekly experienced symptoms. Among those who had been working for no more than 1 year, 15.1% experienced headache/eyestrain, while 23.7% of those who had been working for ≥ 10 years experienced symptoms. Among permanent and temporary employees, 20.6% and 13.4% employees, respectively experienced symptoms. Most workers (26.0%) who were in the company with the largest number of employees (≥ 300) experienced symptoms, whereas the lowest proportion (16.5%) of those who were in the company with the smallest number of employees (< 50) experienced symptoms. Among workers who had autonomy at work, 21.8% experienced symptoms, whereas 18.7% of workers who did not have autonomy at work experienced symptoms. Among workers who worked night shifts, 18.4% experienced headache/eyestrain, whereas 27.2% of workers who did not work at night experienced symptoms. Among workers who always had work-related stress experienced symptoms, 40.2% experienced symptoms, whereas 12.6% of workers who never had work-related stress experienced headache/eyestrain. Among the group that used communication devices several times a month in their free time, 26.8% experienced headache/eyestrain. Among workers who exposed vibration, noise, high temperature, fume, organic solvent, secondhand smoking, painful posture repetitive motion, sleep problem experienced symptoms (22.6%, 27.3%, 24.0%, 26.3%, 31.2%, 44.3%, 26.5%, 21.9%, 39.5%), respectively. And white collar workers were more experienced symptoms (24.6%) than pink collar (13.2%) and blue collar (15.8%) (Table 1).
Headache/eyestrain proportions by weekly total working hours and daily VDT working hours
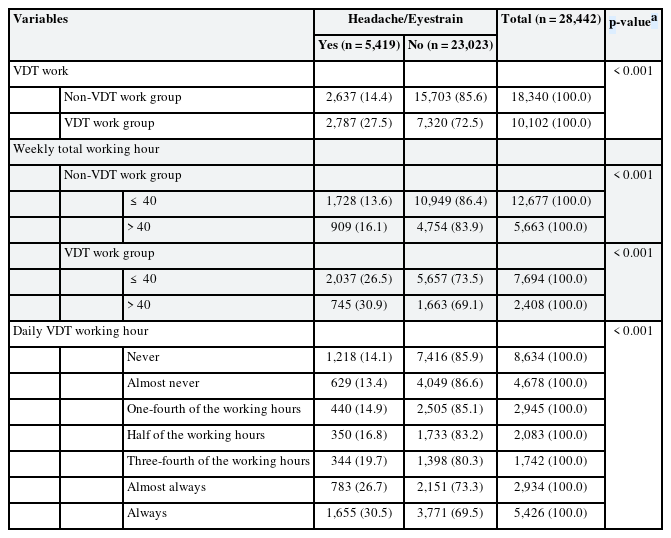
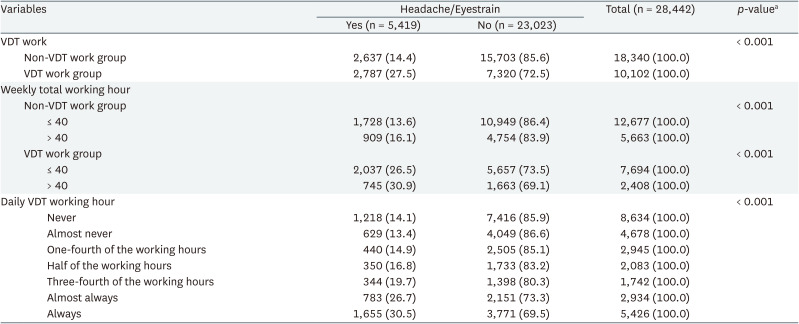
Among the non-VDT work group, 14.4% experienced headache/eyestrain, whereas 27.5% of the VDT work group experienced the symptoms. Among those who worked > 40 hours weekly, the proportions of headache/eyestrain in the VDT and non-VDT work groups were 30.9% and 16.1%, respectively. Among those who worked ≤ 40 hours weekly, the proportions were 26.5% and 13.6%, respectively. Regarding daily VDT working hours, the proportion of headache/eyestrains were 14.1%, 14.9%, 16.8%, 19.7%, 26.7%, and 30.5% in workers who had never used VDT, used VDT for one-fourth, half, and three-fourth of their working hours, almost always used VDT, and always used VDT, respectively (Table 2).
ORs with 95% CIs for headache/eyestrain
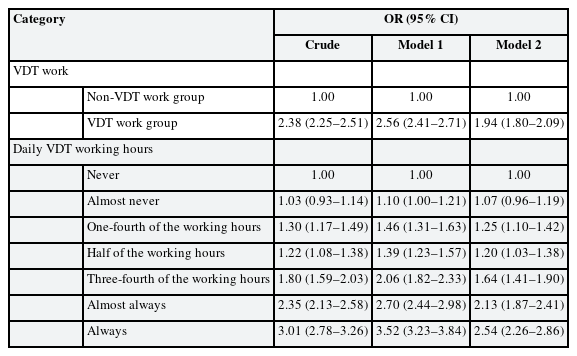
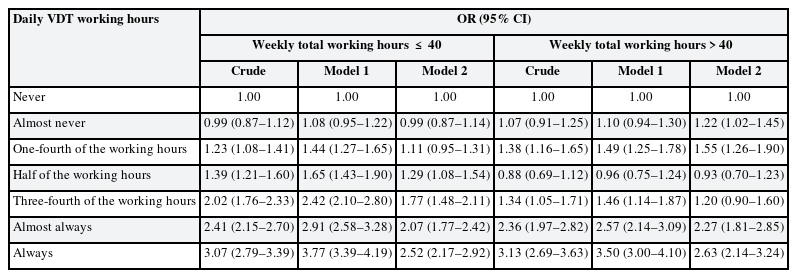
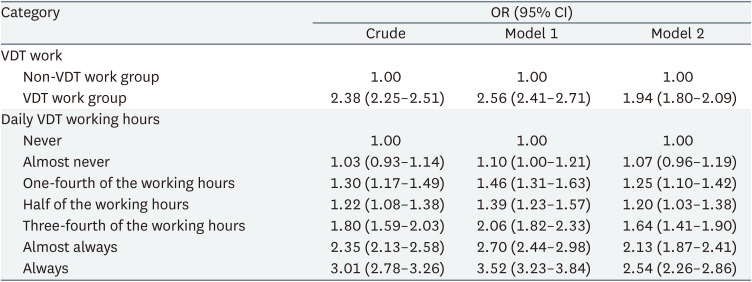
The VDT work group showed adjusted OR of 1.94 (95% CI: 1.80–2.09) for headache/eyestrain, compared with the non-VDT work group. The group that always used VDT showed adjusted OR of 2.54 (95% CI: 2.26–2.86), compared with the group that never used VDT (Table 3). The group that always used VDT showed adjusted ORs of 2.52 (95% CI: 2.17–2.92) and 2.63 (95% CI: 2.14–3.24) for headache/eyestrain, compared to the group that never used VDT in the ≤ 40 hours weekly and > 40 hours weekly groups, respectively (Table 4).
DISCUSSION
The first case of COVID-19 was reported in December 2019; thereafter, the virus spread globally. The duration of daily VDT use by the general population increased by approximately 2.4 hours during the COVID-19 pandemic.11 In a study of 435 participants, VDT use increased during lockdown in 387 (89%) participants.12 The frequency and severity of dry eyes and headaches also increased.13 Moreover, VDT working hours among wage workers greatly increased compared to before the pandemic, resulting in an increase in the number of wage workers who experienced eyestrain.131415 In this study, 14.4% of the non-VDT work group experienced headache/eyestrain, whereas 27.5% of the VDT work group experienced the symptoms. The risk of headache/eyestrain in the group who always used VDT was 2.21 times higher than that in the group who never used VDT. As the daily VDT working hours increased, the risk of headache/eyestrain also increased.
A previous study that assessed 2,216 IT staff reported that the risk of tension-type headaches in the group who used VDT for at least 8 hours was 1.63 times higher than that in the group who used VDT for < 8 hours.16 Vertical head movements, hyperextension, and repeated rotation of the neck during VDT work sessions can cause headache through neck muscle contraction and strain.1718192021 In studies that examined 954 adolescents, the risk of migraine in those who used VDT for at least 4 hours was 2.03 times higher than that in those who used VDT for < 4 hours.2122 Migraine is attributable to the activation of the cerebrovascular system, trigeminal nerve, and central nervous system.23 Bright light from VDT can cause headaches and migraine by activating the trigeminal nerve, including the trigeminal ganglion and nucleus, ventral posteromedial nucleus, thalamus, anterior cingulate, and visual cortices.2425 This study analyzed headache and eyestrain as one item; hence, it is challenging to objectively compare figures with those in previous studies. However, the increase in headache/eyestrain with increase in VDT use corresponds to findings reported in previous studies.
Eyestrain is also known as asthenopia,2627 and it can be classified into 2 types. The first is based on external symptoms related to dry eyes, including burning, irritation, tearing, and dryness.27 In a Japanese study that included 102,582 participants aged between 40 and 74 years, the risk of dry eyes in participants who used VDT for at least 5 hours a day increased by 1.58 and 1.56 times in men and women, respectively, compared with that in those who used VDT for less than 1 hour.15 Another study that included 4,393 Japanese young and middle-aged office workers reported that the risk of dry eyes in the group that used VDT daily for > 4 hours was 1.68 times higher than that in the group that used VDT daily for < 2 hours.28 Using VDT remarkably reduces blink rates, thereby reducing tear supplement time and increasing tear evaporation rate. This causes external symptoms of eyestrain, such as dry eyes, foreign body sensation, and itchiness.29
The second is based on internal symptoms including tension behind the eyes, eye pain, blurred vision, and double vision.27 During VDT work, workers’ eyes continuously move and try to repeatedly focus on the blurred pixel on the screen. This process causes eye tension and tired eyes, resulting in impairment of control function, convergence and internal symptoms of eyestrain.3031 Furthermore, headache is associated with eyestrain and can further aggravate the symptoms.3233 Based on the results of this study, we deduce that headache/eyestrain is caused by reduced blink rates, tension of eye muscles, irritation by light, and continuously repeated movement of the head and neck during VDT work.343536
Unlike previous studies, this study classified working hours into daily VDT working hours and weekly total working hours to investigate the risk of headache/eyestrain.33738 In a study that investigated 721 wage workers, the ORs for severe or disabling headache among individuals working ≥ 55 hours a week, compared with those working between 35 and 45 hours a week, were 1.38 and 1.63, respectively.39 In other words, the longer the weekly total working hours, the higher the risk of headaches due to repetitive contraction of the neck and shoulders.39 However, unlike previous studies, this study showed that the ORs for headache/eyestrain increased as daily VDT working hours increased, regardless of weekly total working hours.4041 We conclude that headache/eyestrain is associated more with daily rather than with weekly total VDT working hours.
This study has a few limitations. First, we were unable to demonstrate a direct causal relationship between VDT work and headache/eyestrain, because this was a cross-sectional study that used the KWCS data. Second, since this study used a self-reported questionnaire survey, there may be information bias due to subjective responses. Third, this study did not evaluate work environmental factors, such as the location of VDT, inappropriate lighting, glare, or abnormality of room humidity that may influence the development of headache/eyestrain.4243 Fourth, medical history was not included in the KWCS data. History of eye disease, contact lens use, and the presence of diabetes or autoimmune diseases have been reported as risk factors for headache/eyestrain.444546
Despite the limitations, to the best of our knowledge, this is the first study to investigate the relationship between VDT working hours and headache/eyestrain using data from the KWCS, a large-scale national survey project.4748 Moreover, since this study reported the risk of headache/eyestrain according to VDT working hours during the COVID-19 pandemic, the findings can be used as baseline data for future studies on the COVID-19-related occupational and environmental health outcomes.4950 The Occupational Safety and Health Act and the Ministry of Employment and Labor Notice developed work management guidelines for VDT workers.1 As the COVID-19 pandemic persists, the number of VDT workers with headache/eyestrain is increasing. Strategies to prevent headache/eyestrain are necessary for workers who use VDT for long periods. We recommend a follow-up study that analyzes the relationship between VDT working hours and headache/eyestrain in the post-COVID-19 era.
CONCLUSIONS
This study suggests that as VDT working hours increase, the risk of headache/eyestrain increases for Korean wage workers during the COVID-19 pandemic. Additional longitudinal and structured studies are required to clarify the association between VDT work and headache/eyestrain risk and investigate the methods for improving workers’ health.
Acknowledgements
The author is grateful to all the workers who are still working hard on the site.
Notes
Funding: This work was supported by the Soonchunhyang University Research Fund.
Competing interests: The authors declare that they have no competing interests.
Authors contributions:
Conceptualization: Kim G, Cho SY.
Data curation: Kim G, Kim J.
Formal analysis: Kim G, Yoon S.
Investigation: Kang J.
Methodology: Kim SY.
Software: Kim G, Cho SY.
Validation: Kim J.
Writing - original draft: Kim G, Cho SY.
Writing - review & editing: Kim G, Cho SY.
Abbreviations
CI
confidence interval
COVID-19
coronavirus disease 2019
KWCS
Korean Working Conditions Survey
IT
information technology
OR
odds ratio
VDT
visual display terminal

