
Articles
- Page Path
- HOME > Ann Occup Environ Med > Volume 33; 2021 > Article
- Research Article Characteristics of lumbar disc degeneration and risk factors for collapsed lumbar disc in Korean farmers and fishers
-
Chaeyoung Hong
 , Chul Gab Lee, Hansoo Song
 -
Annals of Occupational and Environmental Medicine 2021;33:e16.
DOI: https://doi.org/10.35371/aoem.2021.33.e16
Published online: May 14, 2021
Department of Occupational and Environmental Medicine, Chosun University Hospital, Gwangju, Korea.
- Correspondence: Hansoo Song. Department of Occupational and Environmental Medicine, Chosun University Hospital, 365 Pilmun-daero, Dong-gu, Gwangju, Korea. oemsong@chosun.ac.kr
• Received: December 30, 2020 • Accepted: May 7, 2021
Copyright © 2021 Korean Society of Occupational & Environmental Medicine
This is an Open Access article distributed under the terms of the Creative Commons Attribution Non-Commercial License (https://creativecommons.org/licenses/by-nc/4.0/) which permits unrestricted non-commercial use, distribution, and reproduction in any medium, provided the original work is properly cited.
Abstract
-
Background Few studies have investigated the risk factors for lumbar intervertebral disc degeneration among hard physical workers involved in heavy lifting. In this study, we aimed to identify the characteristics of lumbar intervertebral disc degeneration and evaluate the relationship between collapsed lumbar disc and potential risk factors in farmers and fishers.
-
Methods This study included 203 farmers (103 men and 100 women) and 166 fishers (95 men and 71 women) aged 40–69 years who had undergone lumbar magnetic resonance imaging and were enrolled in the Korea Farmer's Knee Cohort and the Jeonnam Fishers' Cohort. We evaluated each of the 5 lumbar discs using the Pfirrmann grading system and classified collapsed lumbar intervertebral disc (cLD) as a case with ≥ 1 grade 5 at any disc level. We investigated potential risk factors, such as gender, age, body mass index (BMI), working hours per day, working months per year, and cumulative heavy lifting working time (CLWT). The odds ratios (ORs) and their corresponding 95% confidence intervals (CIs) were calculated.
-
Results The prevalence of cLD was 19.8% (23.7% among fishers, 21.2% among fishers with farming, and 17.2% among farmers). cLD correlated with factors such as age and occupation. Gender, CLWT and the working time matrix were not significantly associated with cLD. The OR of cLD adjusted by gender, age, BMI, and working time matrix was 1.26 (95% CI: 0.69–2.30) for ≥ 5,000 hours CLWT compared to that for < 2,000 hours CLWT. The OR of cLD adjusted by gender, age, BMI, CLWT, and working time matrix was 2.08 (95% CI: 1.06–4.06) for fishers compared to that for farmers.
-
Conclusions Heavy lifting did not show a significant association with cLD in farmers and fishers. However, there is possibility that fishers are at a higher risk of lumbar disc collapse than farmers.
BACKGROUND
Lower back pain (LBP) is a common health problem affecting humans [1]. It causes loss of work, health disabilities, and diminishing quality of life [2]. The global burden and loss of working days due to LBP are considerable [3]. In 2015, the socioeconomic burden in South Korea due to LBP was the second highest, approximately $6.6 billion, and disability-adjusted life years due to LBP ranked first [4]. In South Korea, approximately 60% of occupational diseases approved by the Industrial Accident Compensation Insurance Act were musculoskeletal diseases, and LBP accounted for over half of these [5,6]. LBP is commonly observed in individuals whose work requires heavy lifting [7]. Most acute-LBP cases improve with proper medical care; however, some progress to chronic pain. Chronic LBP causes long-term disabilities, lowers quality of life, and reduces work efficiency [8]. The major factor causing chronic LBP is lumbar intervertebral disc degeneration, especially in the elderly [9,10].
Disc degeneration is commonly observed in asymptomatic populations. The prevalence of disc degeneration increases from 37% in 20-year-old individuals to 96% in 80-year-old individuals [11]. Disc degeneration progresses gradually depending on the complex action of genetic factors, growth factors, nutrient transport, lifestyle, and mechanical loading [12]. General disc degeneration makes the spine vulnerable to mechanical stress due to loss of elasticity and stiffness [13]. However, unlike the normal aging process, rapid progression, such as disc herniation, internal disruption, and resorption, leads to marked destruction and instability [14]. The disc's collapse is explained by the interaction between the disc regeneration mechanism's damage due to aging or genetic factors and mechanical stress, such as compressive load, shear force, and vibration [15,16]. A single impact, cyclical, and continuous loading can trigger disc degeneration or collapse; however, long-term, constant loading mainly contributes to the damage [16,17].
Heavy physical activities are known risk factors for lumbar degeneration [18,19]. However, these results are not consistent. The outcome definitions, job types, study subject characteristics, and exposure evaluation methods vary. Studies on disc-height reduction did not show any significant difference between each occupation. Further, most studies have assessed occupational exposure based on occupation groups [20]. Therefore, to explore lumbar degeneration's occupational factors, a quantitative evaluation of exposure and a reasonable definition of outcome are needed.
Most Koreans engaged in agriculture, aquaculture, and fishing are approximately 60 years old on average and commonly engage in strenuous manual labor in outdoor natural environments [21,22]. However, individual differences in manual labor time appear, depending on mechanization and migrant workers [21,23]. We aimed to: (1) identify the characteristics of lumbar disc degeneration using the Pfirrmann grading system among farmers and fishers in South Korea and (2) evaluate the relationships between collapsed lumbar intervertebral disc (cLD) and potential risk factors through quantitative assessment of occupational factors.
METHODS
In Korea, agriculture and fishing have something in common: outdoor manual labor mainly engaged in by the elderly. Fishers in coastal areas often also engage in farming. Therefore, when designing the Korea Farmer's Knee Cohort (KFKC) and the Jeonnam Fishers' Cohort (JFC), the same evaluation tools were applied. The KFKC was established by the Jeonnam Center for Farmers' Safety and Health with funding from the Ministry of Agriculture, Food, and Rural Affairs. The KFKC enrolled 550 farmers. The JFC was established by the Jeonnam Center for Fishers' Safety and Health with funding from the Ministry of Oceans and Fisheries. The JFC comprised 466 fishers. This study included 203 farmers and 166 fishers aged 40–69 years who had undergone lumbar magnetic resonance imaging (MRI) and were enrolled in the KFKC from 2016 to 2018 and JFC from 2015 to 2017. Study participants voluntarily participated in this research on knee and lumbar diseases among farmers and fishers. We excluded cases of lumbar fusion surgery but not those of lumbar spine diseases, such as intervertebral disc herniation or lumbar stenosis. Data on gender, age, body mass index (BMI), cumulative lifting working time (CLWT), occupation, and working hours, which were considered potential risk factors for cLD, were collected. Cases with missing data were excluded.
We obtained the participants' lumbar spine images; imaging was conducted using 1.5 Tesla MRI (Avanto; Siemens, Washington, D.C., USA). Sagittal T2-weighted images were assessed to identify disc degeneration at all disc levels from the intervertebral disc between the 1st and 2nd lumbar vertebrae (L1/2) to that between the 5th lumbar and 1st sacral vertebrae (L5/S1). Two researchers (blinded to all demographic and clinical information) evaluated the degree of lumbar disc degeneration based on the Pfirrmann classification system [24]. We defined “collapsed” as a ≥ 50% reduction from the expected value (Fig. 1). In this study, we classified cLD as a case with ≥ 1 grade 5 at any disc level. We calculated the mean Pfirrmann grade from 5 lumbar intervertebral discs. The interobserver reliability of Pfirrmann grade 5, based on quadratic weighted kappa, was 0.763, 0.804, 0.747, 0.732, and 0.804 for L1/2, L2/3, L3/4, L4/5, and L5/S1, respectively. Kappa of cLD was 0.703. Any discrepancy was resolved through discussion between the researchers.
Fig. 1
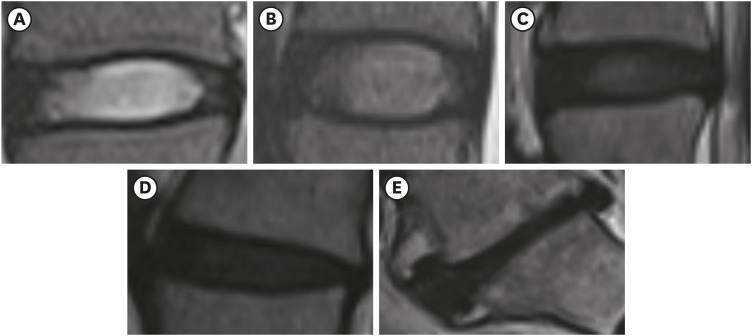
MRI examples of Pfirrmann grades. (A) Grade 1 defines a homogeneous bright white disc with normal disc height. (B) Grade 2 defines an inhomogeneous white disc with a clear distinction from the annulus fibrosus and normal disc height. (C) Grade 3 defines an inhomogeneous gray disc with an unclear distinction from the annulus fibrosus and normal disc height. (D) Grade 4 defines an inhomogeneous gray-to-black disc without distinction from the annulus fibrosus. (E) Grade 5 defines an inhomogeneous black disc with collapsed intervertebral space.
We collected participant height and weight data. BMI was calculated by dividing weight in kilograms by height in meters squared. Obesity was defined as a BMI ≥ 25 kg/m2. Data related to working time were obtained through one-on-one interviews by trained investigators. To measure participants' heavy-lifting working time since job commencement, 4 structured questions created by the researchers were used. This questionnaire was administered face to face. If a subject answered “yes” to the question “Have you ever performed a task of repeatedly lifting or moving heavy objects?”, they subsequently responded to the following sequence of questions: “In total, how many years have you been doing this job?”; “On average, how many months have you performed the task during the year?”; “How many days per week did you usually perform the task?”; and “How many hours per day did you usually do it?”. We did not present the weights of heavy objects in this questionnaire, and the criterion of heaviness was subjectively judged by respondents. We took the unit task exposure as the median value of each sub-periods exposure and then calculated cumulative heavy lifting working time (CLWT). CLWT was calculated using the following formula (Supplementary Data 1):
CLWT (hours) = lifetime heavy lifting working years × heavy lifting working months per year × 4 weeks × heavy lifting working days per week × heavy lifting working hours per day
CLWT was categorized as follows: “< 2,000 hours,” “2,000–4,999 hours,” or “≥ 5,000 hours.” The CLWT calculated from 10 working years was 5,000 hours, assuming 2 hours of work involving lifting per day.
We examined the average working hours per day and working months per year. The average working hours were categorized as follows: “< 6 hours,” “6–8 hours,” or “≥ 8 hours.” The average working months were categorized as follows: “< 9 months,” “9–11 months,” or “12 months.” We created a working time matrix to evaluate labor intensity in recent years. The working time matrix was categorized as low, middle, or high. The low group was defined as working < 9 months per year and < 6 hours per day. The high group was defined as working ≥ 12 months and > 8 hours per day. A working time matrix that fell outside the low or high groups was assigned to the middle group.
Participants comprised 203 farmers and 166 fishers. Of the 166 fishers, 52 were also into agriculture. We classified the occupations as follows: farmers, fishers, or fishers with farming. The KFKC comprised 16 local agricultural production units in Jeonnam province, which is in southwest Korea. The farmers mainly grow rice. The JFC comprised Wando and Muan residents. Wando has developed aquaculture by taking advantage of its islands and rias coasts. Wando produces approximately 80% of the abalone in Korea [23]. In the early 2000s, the abalone-industry productivity improved dramatically due to advances in aquaculture technology and introduction of the crane, conveyor belt, and net hauler [25]. In addition, the fishers' physical burden was reduced through employment of foreign workers. Muan has developed a small vessel fishing industry specializing in octopus minor (nakji). The fishers' musculoskeletal burden was high due to fishing gear preparation and netting, pulling the net, and lifting heavy equipment [23].
We investigated participant demographic characteristics, including gender, age, BMI, occupation, CLWT, and working time matrix. To evaluate the associations of cLD with participant characteristics and occupational factors, the χ2 test and multiple logistic regression analysis were performed. A p-value < 0.05 was considered statistically significant. All statistical analyses were performed using IBM SPSS version 22.0 (IBM Corporation, Armonk, NY, USA).
The present study protocol was reviewed and approved by the Institutional Review Board of Chosun University Hospital (approval No. CHOSUN 2020-04-010-001). Participants provided written informed consent to their participation in both surveys and to the use of their data for research purposes.
RESULTS
The study subjects included 203 farmers, 114 fishers, and 52 fishers with farming. The mean (± standard deviation) age of the subjects was 54.8 ± 6.6 years. Table 1 presents participant characteristics by occupation. The mean age of fishers was the lowest (52.2 ± 6.6 years), and that by occupation was significantly different (p < 0.001 by one-way analysis of variance [ANOVA]). However, no statistically significant differences were observed in gender or BMI. To compare occupational characteristics, we investigated working hours per day, working months per year, working time matrix, and CLWT. In total, 52.2% of farmers, 50.0% of fishers with farming, and 27.2% of fishers worked more than 8 hours per day. Approximately 50.2% of farmers, 1.9% of fishers with farming, and 12.3% of fishers worked 12 months per year. We found that 31.0% of farmers, 6.1% of fishers with farming, and 1.9% of fishers were categorized in the high working-time group. Regarding CLWT, 35.0% of farmers, 59.6% of fishers with farming, and 76.3% of fishers had over 5,000 hours. This demonstrates that fishers had a lower burden of working hours but a higher burden of heavy lifting than farmers.
Table 1
Participant characteristics by occupations (n = 369)
Values are presented as number (%). The p-value by χ2 test. Working time matrix: low, working < 9 months per year and < 6 hours per day; high, working ≥ 12 months and > 8 hours per day; middle, work schedules that did not fall into the low or high categories.
SD: standard deviation; CLWT: cumulative lifting working time; ANOVA, analysis of variance.
aThe p-value by one-way ANOVA; bAccording to a post hoc analysis, only fishers showed significant differences from other occupations (p-value < 0.01 by Bonferroni method); cThe p-value by one-way ANOVA, according to a post hoc analysis, only farmers showed significant differences from fishers with farming (p-value < 0.01 by Bonferroni method); dThe p-value by 2 × 3 χ2 test, only fishers showed significant differences from farmers and fishers with farming (p-value < 0.01); eThe p-value by 2 × 3 χ2 test, only farmer showed significant differences from fishers and fishers with farming (p-value < 0.01).
Fig. 2 shows the mean Pfirrmann grade and prevalence of grade 5 at each lumbar intervertebral disc level by age. The mean Pfirrmann grade was highest at L4/5 and showed an overall increase with age (p < 0.05 by one-way ANOVA), except for L4/5 and L5/S1 between 50–59 and 60–69 years of age. Grade 5 prevalence was higher in the lower (L4/5 and L5/S1) than in the upper (L1/2, L2/3, and L3/4) lumbar disc. However, grade 5 prevalence was relatively high at L2/3 (10.1% at 60–69 years of age).
Fig. 2

Mean Pfirrmann grade and the prevalence of grade 5. (A) The mean Pfirrmann grade by age group at each disc level, (B) The prevalence of Pfirrmann grade 5 by age group at each disc level.
ANOVA: analysis of variance.
ap < 0.05; bp < 0.01; cp < 0.001.
Fig. 3 shows the mean Pfirrmann grade and differences in cLD at all disc levels among occupations by age. The mean Pfirrmann grade increased at all occupations with age (p < 0.05 by one-way ANOVA), except for fishers with farming between 50–59 and 60–69 years of age. cLD (28.8%) in fishers 50–59 years of age was relatively high, whereas that in farmers was 17.5% and fishers with farming 16.0%. cLD (21.2%) in farmers 60–69 years of age was relatively low, whereas that in farmers was 37.5% and fishers with farming 35.3%. However, these differences were not significant.
Fig. 3

Mean Pfirrmann grade and prevalence of grade 5 by occupations. (A) The mean Pfirrmann grade by occupation at each age group. (B) The prevalence of Pfirrmann grade 5 by occupation at each age group.
ANOVA: analysis of variance.
Table 2 shows Pfirrmann grade 5 frequency at all disc levels and cLD prevalence by potential risk factor. Aging was associated with a higher cLD prevalence, with prevalence rates of 9.6%, 20.9%, and 26.3% at 40–49, 50–59, and 60–69 years, respectively (p = 0.017). cLD was 21.7% in men and 17.5% in women; however, the difference was not significant (p = 0.316). cLD prevalence was 19.5% in the “BMI < 25” group and 20.0% in the “BMI > 25” group (p = 0.912). cLD prevalence was 17.2%, 21.2%, and 23.7% among farmers, fishers with farming, and fishers, respectively. According to CLWT, cLD prevalence was 15.2%, 21.8%, and 22.2% among those who worked < 2,000 hours, 2,000–4,999 hours, and 5,000 hours, respectively. According to working time matrix, cLD prevalence was 18.8%, 21.0%, and 19.7% in the low, middle, and high groups, respectively.
Table 2
Prevalence of Pfirrmann grade 5 at each lumbar disc level and cLD
The p-value by χ2 test for cLD (%). cLD: a case with at least one Pfirrmann grade 5 at any disc level. Working time matrix: low, working < 9 months per year and < 6 hours per day; high, working ≥ 12 months and > 8 hours per day; middle, work schedules that did not fall into the low or high categories.
CLWT: cumulative lifting working time; BMI: body mass index; cLD: collapsed lumbar intervertebral disc.
aThe prevalence of Pfirrmann grade 5 according to age was statistically significant only in L2/3 (p < 0.01).
Table 3 shows the associations between cLD and potential risk factors tested by multiple logistic regression analysis. Working months per year and working hours per day were excluded due to multicollinearity with the working time matrix. Age was associated with cLD, showing a dose-response relationship after covariate adjustment (50–59 years adjusted odds ratio [OR]: 2.47, 95% confidence interval [CI]: 1.10–5.55; 60–69 years adjusted OR: 3.34, 95% CI: 1.42–7.86). cLD was not significantly associated with gender or BMI. The OR of cLD adjusted by gender, age, and BMI was 1.86 (95% CI: 1.02–3.37) for fishers compared to that of farmers (model 1). The OR of cLD adjusted by gender, age, and BMI was 1.50 (95% CI: 0.82–2.74) for ≥ 5,000 hours CLWT compared to that for < 2,000 hours CLWT (model 2). The OR of cLD adjusted by gender, age, and BMI was 1.06 (95% CI: 0.52–2.17) for the high working-time group compared to that for the low working-time group (model 3). The OR of cLD adjusted by gender, age, BMI, CLWT, and working time matrix was 2.08 (95% CI: 1.06–4.06) for fishers compared to that for farmers (model 4).
Table 3
Relationships between cLD and occupational risk factors according to multiple logistic regression analysis
Values are presented as odds ratio (95% confidence interval). cLD: a case with at least one Pfirrmann grade 5 at any disc level. Working time matrix: low, working < 9 months per year and < 6 hours per day; high, working ≥ 12 months and > 8 hours per day; middle, work schedules that did not fall into the low or high categories. Model 1: adjusted by gender, age, BMI, and occupation; Model 2: adjusted by gender, age, BMI, and CLWT; Model 3: adjusted by gender, age, BMI, and working time matrix; Model 4: adjusted by gender, age, occupation, and CLWT.
CLWT: cumulative heavy lifting working time; BMI: body mass index; cLD: collapsed lumbar intervertebral disc.
DISCUSSION
cLD prevalence was 19.8%. The prevalence rates were 23.7%, 21.2%, and 17.2% for fishers, fishers with farming, and farmers, respectively. In this study, gender and obesity did not show a significant relationship with cLD, but only age did. Among the occupational factors, CLWT and working time matrix were not significantly related. However, occupation was significantly higher in fishers than in farmers, after adjusting for gender, age, BMI, and working time matrix. However, considering that the effect of CLWT may slightly overlap with that of occupation, fishing rather than farming may be a risk factor for lumbar degeneration.
The mean age of fishers was lowest among the 3 occupation groups. The age difference makes age-adjusted OR of cLD greater than unadjusted OR in fishers. Working time per day and working months per year were lower among fishers than in the other occupation categories. Nevertheless, CLWT was the highest among fishers (Table 1). In other words, fishers have shorter working periods than farmers. We assumed that fishers' working periods were limited by a closed fishing season and windy weather. However, fishers are required to perform intense heavy lifting during the fishing period.
Fishers perform a wide range of tasks, from maintaining the fishing gear to processing the seafood, and a considerable workforce is required for every step of the process. The most common task entails the repeated pulling of heavy nets and lift of heavy objects while bending and twisting [26]. In a study evaluating ergonomic stresses among North Carolina commercial fishers, a population resembling that of this study, lifting heavy loads generated a high peak compression force (3,586–5,315 N), translating to 3.3–5.4 in the National Institute for Occupational Safety and Health lifting index [27].
We reviewed previous epidemiologic studies on Pfirrmann grade 5 prevalence. Unfortunately, we could not identify any findings regarding Pfirrmann grade 5 prevalence in the general population. Notwithstanding, Oh et al. [28] investigated 653 whole-spine MRIs in Korea using hospital data (336 men and 317 women, 48.1 ± 58.7 years). Pfirrmann grade 5 prevalence was 3.1%, 4.6%, 3.5%, 10.3%, and 10.4% in L1/2, L2/3, L3/4, L4/5, and L5/S1, respectively. In the present study (198 men and 171 women, 54.8 ± 6.6 years), Pfirrmann grade 5 prevalence was 2.7%, 4.3%, 3.0%, 10.3%, and 14.9% in L1/2, L2/3, L3/4, L4/5, and L5/S1, respectively. Jang et al. [29] reported Pfirrmann grade 5 prevalence at L5/S1 of 3.3% and 0.8% in field and administrative groups among Korean firefighters, respectively (age range: 20–60 years). In the absence of Pfirrmann grade 5 at 20–39 years of age, Pfirrmann grade 5 prevalence at L5/S1 would be 7.5% and 2.0% in field and in administrative groups, respectively. In the present study, Pfirrmann grade 5 prevalence at L5/S1 was 8.4% and 17.1% in the 40–49- and 50–59-year age groups, respectively. Therefore, we estimated that fishers and farmers had a higher cLD rate than field firefighters.
Age and mechanical stress are risk factors for lumbar disc degeneration [20,30]. The present study showed a dose-response relationship with age. The probability of lumbar disc degeneration increases with mechanical stress on the disc. The burden increases linearly with the angle of the bending posture [31]. If heavy lifting is performed in a bent posture, the pressure on the lumbar disc increases tremendously due to shear and torsion forces [32]. If repeated heavy lifting continues, lumbar disc degeneration accelerates [33]. Therefore, we expected CLWT to show a dose-response relationship with cLD. Interestingly, cLD did not show a significant association with CLWT. This might have been due to comparison within a high-risk group and the survival effect. Our study results resemble those of a case-control study nested within the Wakayama Spine Study. This case-control study included a case group of 605 people and with X-ray confirmed spondylolisthesis and a control group of 117 people. Lifting exposure was defined as lifting loads ≥ 10 kg at least once per week. However, heavy lifting was not significantly related to spondylolisthesis. However, agricultural and fishing industries had over 3-fold more spondylolisthesis cases than clerical and technical expertise. This association disappeared among those aged > 75 years [34]. We considered it inappropriate to limit fishers' lumbar burden to heavy lifting working time. Fishers have to maintain their balance and pull the rope on a swaying vessel. Therefore, CLWT based on the questionnaire might not have reflected all risky tasks of fishers.
Pfirrmann grade 5 prevalence was higher in the lower than in the upper lumbar discs. Prior epidemiologic research on disc degeneration has shown that lower lumbar discs are more vulnerable than upper lumbar discs [28,35]. Gender was not associated with cLD in this study. Previous studies have also reported that lumbar disc degeneration is not related to gender [28,35,36]. In Korean farming and fishing communities, men and women have different workplace roles. Men are mainly responsible for carrying and lifting heavy objects in the rural Korean society [21,37]. However, mechanization has reduced men's lifting tasks, and the gender gap in lifting tasks has decreased.
In this study, we found no relationship between cLD and obesity. The effects of obesity on lumbar disc degeneration involve both mechanical and biochemical factors. Mechanical factors contribute to disc degeneration via an increased load on the disc due to body weight. Biochemical factors include systemic inflammatory reactions that promote disc degeneration [38]. However, epidemiologic studies have not shown consistent results [39,40].
This study had certain limitations. First, we investigated the relationship between work-related factors and cLD in occupations with high lumbar loads. Therefore, this study may have different characteristics to those in studies that incorporated a control group without exposure. Second, the CLWT used in this study did not reflect intensity, awkward posture, and whole-body vibration but only time. In the questionnaire used to obtain CLWT, respondents were asked to judge the criterion of heaviness subjectively. Farmers carry objects of varying weight throughout their lifetime. Acceptable weight limits also vary according to gender and muscle mass. So, we could only find time, not weight, from the survey. Other occupational and individual factors, such as genetic factors and previous diseases, might have influenced the outcome. We used occupation as a factor to compensate for potential occupational exposure. However, occupation is a complex and low-quality exposure factor. Third, since this study excluded retired workers and cases of lumbar fusion surgery, a healthy worker effect was possible. Fourth, CLWT reliability and validity were not sufficiently verified. Recall bias might have interfered with the results. Fifth, although the multicollinearity examining the variance inflation factor (1.026–1.235) and conditional index (17.5) including all variables was low, small-sized samples might have influenced OR fluctuation.
This study's strength is that, for the first time, we identified cLD prevalence and analyzed work-related risk factors in farmers and fishers using MRI as an objective diagnostic tool. With limited research on musculoskeletal diseases among farmers and fishers, this study helps us understand the current public health problems in Korea's rural and fishing societies. It can be used to guide further research that involves attempting a quantitative exposure assessment.
CONCLUSIONS
We should note that farmers and fishers are predominantly small business operators or self-employed; therefore, they are in the blind spot of national safety and the health system. In this study, the relationship between CLWT and cLD was not significant. However, fishers are possibly at a higher cLD risk than farmers. Therefore, it is necessary to attempt a quantitative evaluation of the heavy-lifting task's intensity and posture in addition to lifting time in future studies. In particular, a detailed analysis of and further research on the work of fishers are needed.
Acknowledgements
The authors thank the Ministry of Oceans and Fisheries and the Ministry of Agriculture, Food and Rural Affairs of the Republic of Korea.
-
Funding: This study was supported by research funds from Chosun University Hospital in 2017.
-
Competing interests: The authors declare that they have no competing interests.
-
Author Contributions:
Conceptualization: Song H.
Data curation: Song H, Hong C.
Formal analysis: Song H.
Funding acquisition: Lee CG.
Investigation: Song H, Lee CG, Hong C.
Methodology: Song H, Lee CG.
Software: Hong C.
Validation: Song H, Hong C.
Visualization: Song H.
Writing - original draft: Hong C.
Writing - review & editing: Song H, Lee CG.
NOTES
Abbreviations
ANOVA
analysis of variance
BMI
body mass index
CI
confidence interval
cLD
collapsed lumbar intervertebral disc
CLWT
cumulative heavy lifting working time
KFKC
Korea Farmer's Knee Cohort
LBP
lower back pain
MRI
magnetic resonance imaging
OR
odds ratio
JFC
Jeonnam Fishers' Cohort
SUPPLEMENTARY MATERIAL
Supplementary Data 1
The questionnaire for cumulative heavy lifting working time (CLWT)
- 1. Minghelli B. Musculoskeletal spine pain in adolescents: epidemiology of non-specific neck and low back pain and risk factors. J Orthop Sci 2020;25(5):776–780. 31708228.ArticlePubMed
- 2. Froud R, Patterson S, Eldridge S, Seale C, Pincus T, Rajendran D, et al. A systematic review and meta-synthesis of the impact of low back pain on people's lives. BMC Musculoskelet Disord 2014;15:50. 24559519.ArticlePubMedPMCPDF
- 3. Hoy D, March L, Brooks P, Woolf A, Blyth F, Vos T, et al. Measuring the global burden of low back pain. Best Pract Res Clin Rheumatol 2010;24(2):155–165. 20227638.ArticlePubMed
- 4. Lee YR, Cho B, Jo MW, Ock M, Lee D, Lee D, et al. Measuring the economic burden of disease and injury in Korea, 2015. J Korean Med Sci 2019;34(Suppl 1):e80. 30923489.ArticlePubMedPMCPDF
- 5. Jang TW, Koo JW, Kwon SC, Song J. Work-related musculoskeletal diseases and the workers' compensation. J Korean Med Sci 2014;29(Suppl):S18–23. 25006319.ArticlePubMedPMCPDF
- 6. Kim EA, Nakata M. Work-related musculoskeletal disorders in Korea and Japan: a comparative description. Ann Occup Environ Med 2014;26:17. 25024844.ArticlePubMedPMCPDF
- 7. Wai EK, Roffey DM, Bishop P, Kwon BK, Dagenais S. Causal assessment of occupational lifting and low back pain: results of a systematic review. Spine J 2010;10(6):554–566. 20494816.ArticlePubMed
- 8. Compare A, Marchettini P, Zarbo C. Risk factors linked to psychological distress, productivity losses, and sick leave in low-back-pain employees: a three-year longitudinal cohort study. Pain Res Treat 2016;2016:3797493. 27635259.ArticlePubMedPMCPDF
- 9. Middendorp M, Vogl TJ, Kollias K, Kafchitsas K, Khan MF, Maataoui A. Association between intervertebral disc degeneration and the Oswestry Disability Index. J Back Musculoskeletal Rehabil 2017;30(4):819–823.ArticlePubMed
- 10. Koji K, Koichi N, Kenji H. Etiology and nature of intervertebral disc degeneration and its correlation with low back pain. J Phys Fit Sports Med 2015;4(1):63–72.Article
- 11. Brinjikji W, Luetmer PH, Comstock B, Bresnahan BW, Chen LE, Deyo RA, et al. Systematic literature review of imaging features of spinal degeneration in asymptomatic populations. AJNR Am J Neuroradiol 2015;36(4):811–816. 25430861.ArticlePubMedPMC
- 12. Choi YS. Pathophysiology of degenerative disc disease. Asian Spine J 2009;3(1):39–44. 20404946.ArticlePubMedPMC
- 13. Scharf B, Clement CC, Yodmuang S, Urbanska AM, Suadicani SO, Aphkhazava D, et al. Age-related carbonylation of fibrocartilage structural proteins drives tissue degenerative modification. Chem Biol 2013;20(7):922–934. 23890010.ArticlePubMedPMC
- 14. Kirkaldy-Willis WH, Wedge JH, Yong-Hing K, Reilly J. Pathology and pathogenesis of lumbar spondylosis and stenosis. Spine (Phila Pa 1976) 1978;3(4):319–328. 741238.ArticlePubMed
- 15. Debnath UK. Etiology and risk factors of lumbar intervertebral disc (IVD) degeneration. Res Med Eng Sci 2018;4(5):RMES.000597.Article
- 16. Desmoulin GT, Pradhan V, Milner TE. Mechanical aspects of intervertebral disc injury and implications on biomechanics. Spine 2020;45(8):E457–64. 31651681.ArticlePubMed
- 17. Hadjipavlou AG, Tzermiadianos MN, Bogduk N, Zindrick MR. The pathophysiology of disc degeneration: a critical review. J Bone Joint Surg Br 2008;90(10):1261–1270. 18827232.PubMed
- 18. Seidler A, Bolm-Audorff U, Siol T, Henkel N, Fuchs C, Schug H, et al. Occupational risk factors for symptomatic lumbar disc herniation; a case-control study. Occup Environ Med 2003;60(11):821–830. 14573712.ArticlePubMedPMC
- 19. Seidler A, Bergmann A, Jäger M, Ellegast R, Ditchen D, Elsner G, et al. Cumulative occupational lumbar load and lumbar disc disease--results of a German multi-center case-control study (EPILIFT). BMC Musculoskelet Disord 2009;10:48. 19422710.ArticlePubMedPMCPDF
- 20. Macedo LG, Battié MC. The association between occupational loading and spine degeneration on imaging - a systematic review and meta-analysis. BMC Musculoskelet Disord 2019;20(1):489. 31656182.ArticlePubMedPMCPDF
- 21. Kotowski SE, Davis KG, Kim H, Lee KS. Identifying risk factors of musculoskeletal disorders on Korean farms. Work 2014;49(1):15–23. 25135096.ArticlePubMed
- 22. Fry JP, Ceryes CA, Voorhees JM, Barnes NA, Love DC, Barnes ME. Occupational safety and health in U.S. aquaculture: a review. J Agromed 2019;24(4):405–423.ArticlePubMedPDF
- 23. Choi KS, Kim BH, Lim HK. Current status of abalone aquaculture in Korea. Korean J Fish Aquat Sci 2015;78.
- 24. Pfirrmann CW, Metzdorf A, Zanetti M, Hodler J, Boos N. Magnetic resonance classification of lumbar intervertebral disc degeneration. Spine 2001;26(17):1873–1878. 11568697.ArticlePubMed
- 25. Ock YS. The research on the development procedure and current problems of the Korean abalone industry. J Fish Bus Adm 2013;44(3):15–28.Article
- 26. Fulmer S, Buchholz B. Ergonomic exposure case studies in Massachusetts fishing vessels. Am J Ind Med 2002;42(Suppl 2):10–18.ArticlePubMed
- 27. Kucera KL, Mirka GA, Loomis D, Marshall SW, Lipscomb HJ, Daniels J. Evaluating ergonomic stresses in North Carolina commercial crab pot and gill net fishermen. J Occup Environ Hyg 2008;5(3):182–196. 18213532.PubMed
- 28. Oh CH, Yoon SH. Whole spine disc degeneration survey according to the ages and sex using Pfirrmann disc degeneration grades. Korean J Spine 2017;14(4):148–154. 29301175.PubMedPMC
- 29. Jang TW, Ahn YS, Byun J, Lee JI, Kim KH, Kim Y, et al. Lumbar intervertebral disc degeneration and related factors in Korean firefighters. BMJ Open 2016;6(6):e011587.PubMedPMC
- 30. Oichi T, Taniguchi Y, Oshima Y, Tanaka S, Saito T. Pathomechanism of intervertebral disc degeneration. JOR Spine 2020;3(1):e1076. 32211588.PubMedPMC
- 31. Sato K, Kikuchi S, Yonezawa T. In vivo intradiscal pressure measurement in healthy individuals and in patients with ongoing back problems. Spine 1999;24(23):2468–2474. 10626309.PubMed
- 32. Petit A, Roquelaure Y. Low back pain, intervertebral disc and occupational diseases. Int J Occup Saf Ergon 2015;21(1):15–19. 26327258.PubMed
- 33. Seidler A, Euler U, Bolm-Audorff U, Ellegast R, Grifka J, Haerting J, et al. Physical workload and accelerated occurrence of lumbar spine diseases: risk and rate advancement periods in a German multicenter case-control study. Scand J Work Environ Health 2011;37(1):30–36. 20852832.PubMed
- 34. Ishimoto Y, Cooper C, Ntani G, Yamada H, Hashizume H, Nagata K, et al. Is radiographic lumbar spondylolisthesis associated with occupational exposures? Findings from a nested case control study within the Wakayama spine study. BMC Musculoskelet Disord 2019;20(1):618. 31878917.PubMedPMC
- 35. Teraguchi M, Yoshimura N, Hashizume H, Muraki S, Yamada H, Minamide A, et al. Prevalence and distribution of intervertebral disc degeneration over the entire spine in a population-based cohort: the Wakayama Spine Study. Osteoarthritis Cartilage 2014;22(1):104–110. 24239943.PubMed
- 36. Muriuki MG, Havey RM, Voronov LI, Carandang G, Zindrick MR, Lorenz MA, et al. Effects of motion segment level, Pfirrmann intervertebral disc degeneration grade and gender on lumbar spine kinematics. J Orthop Res 2016;34(8):1389–1398. 26990567.PubMed
- 37. Yodanis CL. Constructing gender and occupational segregation: a study of women and work in fishing communities. Qual Sociol 2000;23(3):267–290.
- 38. Cannata F, Vadalà G, Ambrosio L, Fallucca S, Napoli N, Papalia R, et al. Intervertebral disc degeneration: a focus on obesity and type 2 diabetes. Diabetes Metab Res Rev 2020;36(1):e3224. 31646738.PubMed
- 39. Teraguchi M, Yoshimura N, Hashizume H, Yamada H, Oka H, Minamide A, et al. Progression, incidence, and risk factors for intervertebral disc degeneration in a longitudinal population-based cohort: the Wakayama Spine Study. Osteoarthritis Cartilage 2017;25(7):1122–1131. 28089899.PubMed
- 40. Hangai M, Kaneoka K, Kuno S, Hinotsu S, Sakane M, Mamizuka N, et al. Factors associated with lumbar intervertebral disc degeneration in the elderly. Spine J 2008;8(5):732–740. 18037353.PubMed
References
Figure & Data
REFERENCES
Citations
Citations to this article as recorded by 
- Bushen Huoxue Formula Modulates Autophagic Flux and Inhibits Apoptosis to Protect Nucleus Pulposus Cells by Restoring the AMPK/SIRT1 Pathway
Shang Gao, Nianhu Li, Renchang Chen, Youxiang Su, Yun Song, Songlin Liang, Vasiliki Galani
BioMed Research International.2022; 2022: 1. CrossRef - Radiographic hand osteoarthritis in women farmers: characteristics and risk factors
Bohyun Sim, Jaehoo Lee, Chul Gab Lee, Hansoo Song
Annals of Occupational and Environmental Medicine.2022;[Epub] CrossRef - Lumbar Disk Herniation: A Clinical Epidemiological and Radiological Evaluation
Edona Sopaj Azemi, Sandër Kola, Irena Kola, Marjeta Tanka, Fatmir Bilaj, Erjona Abazaj
Open Access Macedonian Journal of Medical Sciences.2022; 10(B): 1588. CrossRef - Population attributable fraction of indicators for musculoskeletal diseases: a cross-sectional study of fishers in Korea
Jaehoo Lee, Bohyun Sim, Bonggyun Ju, Chul Gab Lee, Ki-Soo Park, Mi-Ji Kim, Jeong Ho Kim, Kunhyung Kim, Hansoo Song
Annals of Occupational and Environmental Medicine.2022;[Epub] CrossRef
 PubReader
 ePub Link
 Cite
CiteCharacteristics of lumbar disc degeneration and risk factors for collapsed lumbar disc in Korean farmers and fishers

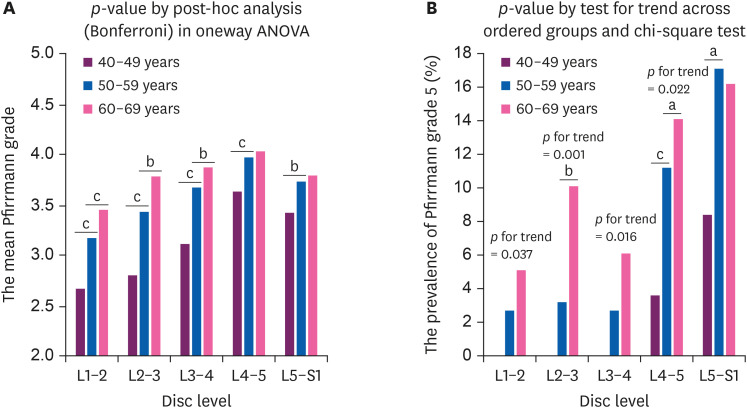
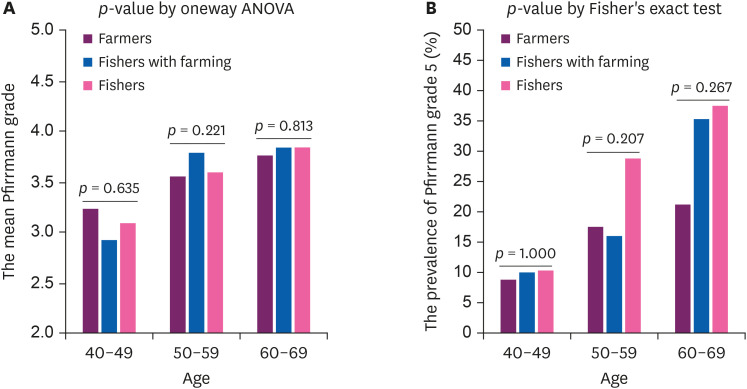
Fig. 1 MRI examples of Pfirrmann grades. (A) Grade 1 defines a homogeneous bright white disc with normal disc height. (B) Grade 2 defines an inhomogeneous white disc with a clear distinction from the annulus fibrosus and normal disc height. (C) Grade 3 defines an inhomogeneous gray disc with an unclear distinction from the annulus fibrosus and normal disc height. (D) Grade 4 defines an inhomogeneous gray-to-black disc without distinction from the annulus fibrosus. (E) Grade 5 defines an inhomogeneous black disc with collapsed intervertebral space.
Fig. 2 Mean Pfirrmann grade and the prevalence of grade 5. (A) The mean Pfirrmann grade by age group at each disc level, (B) The prevalence of Pfirrmann grade 5 by age group at each disc level.ANOVA: analysis of variance.ap < 0.05; bp < 0.01; cp < 0.001.
Fig. 3 Mean Pfirrmann grade and prevalence of grade 5 by occupations. (A) The mean Pfirrmann grade by occupation at each age group. (B) The prevalence of Pfirrmann grade 5 by occupation at each age group.ANOVA: analysis of variance.
Fig. 1
Fig. 2
Fig. 3
Characteristics of lumbar disc degeneration and risk factors for collapsed lumbar disc in Korean farmers and fishers
| Variables | Number | Farmers (n = 203) | Fishers with farming (n = 52) | Fishers (n = 114) | p-value | |
|---|---|---|---|---|---|---|
| Gender | 0.460 | |||||
| Men | 198 | 103 (50.7) | 30 (57.7) | 65 (57.0) | ||
| Women | 171 | 100 (49.3) | 22 (42.3) | 49 (43.0) | ||
| Age (years) | < 0.001 | |||||
| 40–49 | 83 | 34 (16.7) | 10 (19.2) | 39 (34.2) | ||
| 50–59 | 187 | 103 (50.7) | 25 (48.1) | 59 (51.8) | ||
| 60–69 | 99 | 66 (32.5) | 17 (32.7) | 16 (14.0) | ||
| Mean ± SD | 56.0 ± 6.4 | 55.7 ± 5.9 | 52.2 ± 6.6 | < 0.001a,b | ||
| BMI (kg/m2) | 0.889 | |||||
| < 25 | 174 | 96 (47.3) | sf (44.2) | 55 (48.2) | ||
| ≥ 25 | 195 | 107 (52.7) | 29 (55.8) | 59 (51.8) | ||
| Mean ± SD | 25.1 ± 3.1 | 25.1 ± 3.3 | 25.2 ± 3.0 | 0.813a | ||
| Working hours per dayd | < 0.001 | |||||
| < 6 | 87 | 43 (21.2) | 12 (23.1) | 32 (28.1) | ||
| 6–8 | 119 | 54 (26.6) | 14 (26.9) | 51 (44.7) | ||
| > 8 | 163 | 106 (52.2) | 26 (50.0) | 31 (27.2) | ||
| Working months per yeare | < 0.001 | |||||
| < 9 | 155 | 55 (27.1) | 31 (59.6) | 69 (60.5) | ||
| 9–11 | 97 | 46 (22.7) | 20 (38.5) | 31 (27.2) | ||
| 12 | 117 | 102 (50.2) | 1 (1.9) | 14 (12.3) | ||
| Working time matrixe | < 0.001 | |||||
| Low | 160 | 58 (28.6) | 76 (66.7) | 26 (50.0) | ||
| Middle | 138 | 82 (40.4) | 31 (27.2) | 25 (48.1) | ||
| High | 71 | 63 (31.0) | 7 (6.1) | 1 (1.9) | ||
| CLWT (hours) | < 0.001 | |||||
| < 2,000 | 125 | 96 (47.3) | 15 (28.8) | 14 (12.3) | ||
| 2,000–4,999 | 55 | 36 (17.7) | 6 (11.5) | 13 (11.4) | ||
| ≥ 5,000 | 189 | 71 (35.0) | 31 (59.6) | 87 (76.3) | ||
| Mean ± SD (thousand hours) | 11.4 ± 23.5 | 14.5 ± 16.8 | 20.6 ± 21.2 | 0.002a,c | ||
| Variables | Number | Disc level | cLD (%) | p-value | |||||
|---|---|---|---|---|---|---|---|---|---|
| L1/2 | L2/3 | L3/4 | L4/5 | L5/S1 | |||||
| Gender | 0.316 | ||||||||
| Men | 198 | 6 | 10 | 9 | 26 | 32 | 43 (21.7) | ||
| Women | 171 | 4 | 6 | 2 | 12 | 23 | 30 (17.5) | ||
| Age (years)a | 0.017 | ||||||||
| 40–49 | 83 | 0 | 0 | 0 | 3 | 7 | 8 (9.6) | ||
| 50–59 | 187 | 5 | 6 | 5 | 21 | 32 | 39 (20.9) | ||
| 60–69 | 99 | 5 | 10 | 6 | 14 | 16 | 26 (26.3) | ||
| BMI (kg/m2) | 0.912 | ||||||||
| < 25 | 174 | 5 | 8 | 3 | 15 | 26 | 34 (19.5) | ||
| ≥ 25 | 195 | 5 | 8 | 8 | 23 | 29 | 39 (20.0) | ||
| Occupations | 0.371 | ||||||||
| Farmers | 203 | 6 | 9 | 5 | 18 | 25 | 35 (17.2) | ||
| Fishers with farming | 52 | 1 | 2 | 2 | 8 | 11 | 11 (21.2) | ||
| Fishers | 114 | 3 | 5 | 4 | 12 | 19 | 27 (23.7) | ||
| Working hours/day | 0.055 | ||||||||
| < 6 | 87 | 5 | 5 | 5 | 7 | 11 | 11 (12.6) | ||
| 6–8 | 119 | 2 | 6 | 2 | 18 | 19 | 31 (26.1) | ||
| > 8 | 163 | 3 | 5 | 4 | 13 | 25 | 31 (19.0) | ||
| Working months/year | 0.598 | ||||||||
| < 9 | 155 | 4 | 7 | 5 | 20 | 22 | 27 (17.4) | ||
| 9–11 | 97 | 1 | 1 | 1 | 5 | 14 | 20 (20.6) | ||
| 12 | 117 | 5 | 8 | 5 | 13 | 19 | 26 (22.2) | ||
| Working time matrix | 0.887 | ||||||||
| Low | 160 | 4 | 6 | 3 | 19 | 21 | 30 (18.8) | ||
| Middle | 138 | 4 | 7 | 7 | 12 | 24 | 29 (21.0) | ||
| High | 71 | 2 | 3 | 1 | 7 | 10 | 14 (19.7) | ||
| CLWT (hours) | 0.286 | ||||||||
| < 2,000 | 125 | 2 | 3 | 3 | 12 | 13 | 19 (15.2) | ||
| 2,000–4,999 | 55 | 2 | 2 | 2 | 8 | 10 | 12 (21.8) | ||
| ≥ 5,000 | 189 | 6 | 11 | 6 | 18 | 32 | 42 (22.2) | ||
| Variables | cLD | |||||
|---|---|---|---|---|---|---|
| Unadjusted | Adjusted | |||||
| Model 1 | Model 2 | Model 3 | Model 4 | |||
| Gender | ||||||
| Men | 1.00 | 1.00 | 1.00 | 1.00 | 1.00 | |
| Women | 0.77 (0.46–1.29) | 0.84 (0.49–1.44) | 0.80 (0.47–1.38) | 0.78 (0.46–1.34) | 0.79 (0.45–1.39) | |
| Age (years) | ||||||
| 40–49 | 1.00 | 1.00 | 1.00 | 1.00 | 1.00 | |
| 50–59 | 2.47 (1.10–5.55) | 2.78 (1.22–6.32) | 2.48 (1.10–5.59) | 2.53 (1.12–5.70) | 2.55 (1.15–6.16) | |
| 60–69 | 3.34 (1.42–7.86) | 3.99 (1.64–9.72) | 3.19 (1.34–7.55) | 3.24 (1.37–7.65) | 3.75 (1.49–9.47) | |
| BMI (kg/m2) | ||||||
| < 25 | 1.00 | 1.00 | 1.00 | 1.00 | 1.00 | |
| ≥ 25 | 1.03 (0.62–1.72) | 0.96 (0.57–1.63) | 0.97 (0.57–1.64) | 0.96 (0.60–1.63) | 0.98 (0.58–1.68) | |
| Occupations | ||||||
| Farmers | 1.00 | 1.00 | 1.00 | |||
| Fishers with farming | 1.29 (0.60–2.75) | 1.30 (0.60–3.37) | 1.42 (0.63–3.18) | |||
| Fishers | 1.49 (0.85–2.62) | 1.86 (1.02–3.37) | 2.08 (1.06–4.06) | |||
| CLWT (hours) | ||||||
| < 2,000 | 1.00 | 1.00 | 1.00 | |||
| 2,000–4,999 | 1.56 (0.70–3.48) | 1.56 (0.69–3.54) | 1.04 (0.46–2.35) | |||
| ≥ 5,000 | 1.59 (0.88–2.90) | 1.50 (0.82–2.74) | 1.26 (0.69–2.30) | |||
| Working time matrix | ||||||
| Low | 1.00 | 1.00 | 1.00 | |||
| Middle | 1.15 (0.65–2.04) | 1.14 (0.64–2.04) | 1.32 (0.71–2.45) | |||
| High | 1.06 (0.53–2.16) | 1.06 (0.52–2.17) | 1.43 (0.64–3.20) | |||
Table 1 Participant characteristics by occupations (n = 369)
Values are presented as number (%). The
SD: standard deviation; CLWT: cumulative lifting working time; ANOVA, analysis of variance.
aThe
Table 2 Prevalence of Pfirrmann grade 5 at each lumbar disc level and cLD
The
CLWT: cumulative lifting working time; BMI: body mass index; cLD: collapsed lumbar intervertebral disc.
aThe prevalence of Pfirrmann grade 5 according to age was statistically significant only in L2/3 (
Table 3 Relationships between cLD and occupational risk factors according to multiple logistic regression analysis
Values are presented as odds ratio (95% confidence interval). cLD: a case with at least one Pfirrmann grade 5 at any disc level. Working time matrix: low, working < 9 months per year and < 6 hours per day; high, working ≥ 12 months and > 8 hours per day; middle, work schedules that did not fall into the low or high categories. Model 1: adjusted by gender, age, BMI, and occupation; Model 2: adjusted by gender, age, BMI, and CLWT; Model 3: adjusted by gender, age, BMI, and working time matrix; Model 4: adjusted by gender, age, occupation, and CLWT.
CLWT: cumulative heavy lifting working time; BMI: body mass index; cLD: collapsed lumbar intervertebral disc.

