
Articles
- Page Path
- HOME > Ann Occup Environ Med > Volume 32; 2020 > Article
- Research Article Distribution of working position among workers with varicose veins based on the National Health Insurance and National Employment Insurance data
-
Saemi Jung1
 , Youngki Kim1,2, Dongmug Kang1,2, Se Yeong Kim1, Inah Kim3, Eun Mi Kim4
 -
Annals of Occupational and Environmental Medicine 2020;32:e21.
DOI: https://doi.org/10.35371/aoem.2020.32.e21
Published online: July 1, 2020
1Department of Occupational and Environmental Medicine, Pusan National University Yangsan Hospital, Yangsan, Korea.
2Department of Preventive and Occupational Medicine, School of Medicine, Pusan National University, Busan, Korea.
3Department of Occupational and Environmental Medicine, Hanyang University, Seoul, Korea.
4Department of Health Sciences, Hanyang University Graduate School, Seoul, Korea.
- Correspondence: Youngki Kim. Department of Occupational and Environmental Medicine, Pusan National University Yangsan Hospital, and Department of Preventive and Occupational Medicine, School of Medicine, Pusan National University, 49, Busandaehak-ro, Mulgeum-eup, Yangsan 50612, Korea. mungis@pusan.ac.kr
• Received: February 3, 2020 • Accepted: June 11, 2020
Copyright © 2020 Korean Society of Occupational & Environmental Medicine
This is an Open Access article distributed under the terms of the Creative Commons Attribution Non-Commercial License (https://creativecommons.org/licenses/by-nc/4.0/) which permits unrestricted non-commercial use, distribution, and reproduction in any medium, provided the original work is properly cited.
Abstract
-
Background This study aimed to determine the effect of specific working postures on the development of varicose veins (VV). By using Korea's National Health Insurance (NHI) and National Employment Insurance (NEI) data, we analyzed the general characteristic and difference in proportions of VV cases according to occupational working posture.
-
Methods From the NEI and NHI data, participant demographics, such as gender, age, body mass index, and number of workers in specific occupations or industries were obtained. We classified the 240 occupations into blue-collar (BC) and white-collar (WC) occupations and subdivided them into standing, sitting, and walking groups according to the dominant working posture.
-
Results The number of VV patients per 100,000 individuals increased with age, with a higher number of women than men and a higher number of patients in the BC than WC groups. For the BC group, the proportion of VV cases was the highest in the standing group, followed by the walking and sitting groups, but there was no significant difference between standing and walking groups in man. For the WC group, the standing group had a higher proportion of VV cases than the sitting group, but there was no significant difference between the standing and sitting group in man. In the BC group, the proportion of VV cases was the highest among medical and welfare-related elementary workers, bakers and cookie makers, automobile assemblers, cleaning and guarding-related elemental workers, and nurses and dental hygienists. In the WC group, the proportion of VV cases was the highest among food/lodging/tourism/entertainment/sports-related managers, environment/cleaning/protective services-related managers, finance and insurance clerks, accounting book-keeping clerks, and social welfare and counseling professionals.
-
Conclusions This study was performed to determine the characteristics of VV with different working posture among Korean workers. It is expected to be the basis of further studies on occupational musculoskeletal diseases.
BACKGROUND
Chronic venous insufficiency (CVI) encompasses a wide spectrum of venous diseases, such as telangiectasia, reticular veins, and varicose veins (VV) as well as complications, such as venous ulcer or thrombosis. VV is one of the common clinical manifestations of CVI, defined as dilated and tortuous superficial veins of the lower extremities. It commonly occurs in the lower extremities, such as legs, and occurs rarely in the scrotum and anus. The commonly involved veins are the great saphenous vein, small saphenous vein, and perforating vein, but any vein can be involved [1]. The diagnosis of VV is made using portable Doppler ultrasonography. The cutoff threshold time of VV is 0.5 seconds, and pathologic reflux is confirmed when the time is over 0.5 seconds. Surgical treatment is recommended to prevent the recurrence of VV. Even though the mechanism of VV formation is not clearly known, it is known that malfunctioning of the venous valve induces venous wall dilatation and the resulting structural changes in the vein cause valve insufficiency [2]. The prevalence of VV ranges from 10% to 40% [3,4]. In the National Venous Screening Program conducted in the US, the prevalence of VV was over 30% in all participants [5]. VV is more common in women than in men [6], and its prevalence increases in older age groups. The incidence of VV is estimated to be 5% [7]. The risk factors for VV are old age, obesity, smoking, low level of physical activity, family history of venous disease, pregnancy, and menopause state [8,9,10]. Additionally, there are several studies on VV and occupational factors, such as working posture. Prolonged standing at work and occupations involving heavy lifting are considered important risk factors [11,12]. One study used the data on standing or walking hours and found that the risk of VV increased for occupations with long standing/walking hours [12]. Another study suggested that the work condition in specific occupations is a risk factor for VV [13]. It is important to analyze the epidemiological scale of this disease using large-scale data such as Korea's National Health Insurance (NHI) and National Employment Insurance (NEI). This aim aimed to investigate the general characteristics and prevalence of VV according to the working posture.
METHODS
In this study, we used the NHI and NEI data. The NHI system categorizes insured persons into groups of workplace-insured individuals with their dependents and regionally insured individuals. Workplace-insured individuals are workers of all workplaces, including government officers and school personnel and their dependents, such as the spouse, linear ascendants, and linear descendants.
Regionally insured individuals are those other than workplace-insured individuals. In the NEI system, all workplaces with at least one worker need to be registered, but the exceptions are those with workers working less than 15 hours a week, including government officers and school personnel. The 2 datasets were matched using the registration number of the participants and synchronized. Variables such as age, gender, body mass index (BMI), smoking, alcohol consumption, date of medical care, and diagnosis code were extracted from the NHI data and occupation categories, size of workplace, and number of workers according to age and occupation/industry were obtained from the NEI data.
The participants were divided into 7 groups of 10-year intervals. Participants' BMI was > 26 kg/m2 or ≤ 26 kg/m2. Diabetes mellitus (DM), smoking, and alcohol consumption status were determined on the basis of participant response of yes or no. Working period was divided into more or less than 5 years, and workplace size was divided into 4 levels; 5–49, 50–299, 300–999, and > 1,000 people. SAS Enterprise Guide 7.1 (SAS Institute, Inc., Cary, NC, USA) software was used to match the extracted NHI and NEI data for analysis.
We requested the data which enroll individuals diagnosed with one of the VV codes, I830, I831, I832, I839, or I868, as a main or minor diagnosis but not diagnosed in dental clinics, oriental medical clinics, and other departments such as pediatrics, ophthalmology, otorhinolaryngology, and radiation oncology to increase the accuracy of diagnosis. Only the first medical record was considered to avoid overlap. As government officers and school personnel were not enrolled in the NEI data, only general employees of enterprises and businesses were included in the matched data. About 15% of the data were not matched and thus excluded. For calculating the number of patients per 100,000 individuals, we set the number of enrolled persons according to the age, gender, occupation in 2012 as the denominator and the number of patients who were diagnosed with VV from 2008 to 2015 as the numerator. This study focused on the proportion of VV patients according to variables such as age, gender, and occupation type. The flowchart of study participants is presented in Fig. 1.
Fig. 1

Flowchart of selection of study participants.
NEI: National Employment Insurance; NHI: National Health Insurance; BMI: body mass index.
According to the 2007 Korea employment classification of occupations, we classified 240 occupations into blue-collar (BC) or white-collar (WC) occupations. The classification was carried out by 2 or more researchers using the office/non-office classification criteria of the Occupational Safety and Health Act. The enforcement regulations of the Industrial Safety and Health Act defines WC workers as workers who work in office work, personnel, accounting, sales, and design, and the others as BC workers. As for working posture, the 240 occupations were classified into 3 groups with 2 experts' opinion: standing, walking, and sitting groups. The distribution was based on experts' opinions, with agreement between more than 2 experts. The criterion was the dominant position taking more than half (4 h/day) of the working hours. The reference time was 8 hours in a specific working posture in one working day. Participants with occupations involving standing and walking for more than 4 h/day were allocated to the standing and walking group respectively, and those involved in occupations involving standing/walking for less than 4 h/day were allocated to the sitting group. Those spending more time standing were allocated to the standing group and those having more walking hours, to the walking group.
χ2 test was performed to compare the general characteristics of VV patients. Frequency analysis and χ2 test were performed using the SAS version 9.2 (SAS Institute, Inc.) software.
This study was approved by the National Health Insurance Service (NHIS-2018-1-400).
RESULTS
Table 1 describes the general characteristics of the study participants. The number of enrolled patients was the highest in the 40–50-year age group for both men (24,735, 26.1%) and women (38,424, 29.3%). Further, 3,209 (3.3%) men and 1,335 (1.0%) women had DM, and 20,227 (21.4%) men and 13,545 (10.3%) women had a BMI of < 26 kg/m2. In total, 30,349 (38.5%) men and 3,028 (2.9%) women smokers were diagnosed with VV. Most of the VV patients worked less than 5 years—63,594 (67.2%) men and 107,415 (82.0%) women. The distribution of VV patients according to workplace size was uneven, with a higher proportion of men in the 50–300 employees workplace and a higher proportion of women in the > 1,000 employees workplace (Table 1).
Table 1
General characteristics of the study participants
We calculated the number of VV patients per 100,000 individuals according to age. Among the 5,978,213 men and 3,742,339 women who were NEI subscribers, the proportion of VV was higher in women (3,503.8) than men(1,584.1). The proportion of VV cases increased with age, regardless of sex (Table 2).We analyzed the number of patients according to age and occupation type. In both occupation types, the number of patients per 100,000 individuals increased with age (Table 3). For all age groups and both sexes, the proportion of VV cases was higher in the BC group than in the WC group. In all working posture groups, the proportion of VV were higher in women than in men (Table 3).
Table 2
The proportion of varicose vein cases with NEI data according to gender and age
Table 3
Number of patients per 100,000 individuals according to age and occupation type
We classified the workers in 240 occupations into BC and WC groups and further divided each group according to the working posture into sitting, standing, and walking groups. The number of VV per 100,000 NEI population was higher in the BC (2,547.8) than in WC group (1,748.7). Considering the gender, the prevalence of VV was higher among women than men, in both BC (men: 1,696.8, women: 4,019.0) and WC groups (men: 1,181.3, women: 2,550.1) (Fig. 2).
Fig. 2

Number of patients with varicose vein per 100,000 individuals according to occupation type and gender.
M: male; F: female; BC: blue-collar; WC: white-collar.
According to the working position of BC workers, the number of VV patients per 100,000 individuals was highest in the standing group (3,042.4), followed by the walking group (2,643.8), and sitting group (1,483.2). In men, the proportion of VV patients was the lowest in the sitting group (1,057.5), and there was no significant difference between the standing group (1,805.6) and walking group (1,839.7) (p-value = 0.08). In women, the proportion was highest in the standing group (4,649.8), followed by the walking group (4,061.1) and sitting group (2,499.2) (p-value < 0.001). Unlike BC workers, t WC workers consisted of only the standing and sitting group. The proportion of VV cases was higher in the standing group (3,034.1) than in the sitting group (2,550.5) in WC workers. In men, there was no significant difference between the 2 groups (standing group: 1,190.1, sitting group: 1,189.3; p-value = 0.76). In women, the proportion of VV was higher in the standing group (3,034.1) than in sitting group (2,550.5) (p-value < 0.001) (Fig. 3).
Fig. 3
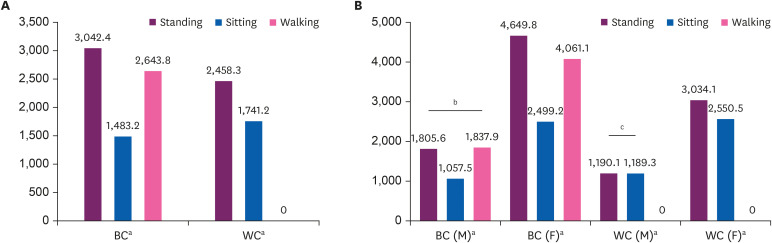
(A) Number of patients with varicose vein per 100,000 individuals according to occupation type and working posture. (B) Number of patients with varicose vein per 100,000 individuals according to gender, occupation type, and working posture.
M: male; F: female; BC: blue-collar worker; WC: white-collar worker.
The χ2 test according to each groups, ap-value < 0.001; bp-value = 0.082; cp-value = 0.766.
Further, we extracted the occupations that had a high proportion of VV cases. Occupations with a small number of employees were excluded. In the BC group, the proportion of VV cases was the highest among medical and welfare-related elementary workers (11,068.6), bakers and cookie makers (9,152.5), automobile assemblers (8,106.4), cleaning and guarding-related elemental workers (7,921.0), and nurses and dental hygienists (7,281.2). For the men in the BC group, guards (5,564.7), cleaning and guarding-related elemental workers (5,524.0), automobile assemblers (5,191.9), medical and welfare-related service workers (5,161.3), and bakers and cookie maker (4,960.3) comprised the high-risk occupations. For women in the BC group, automobile assemblers (16,764.5), bakers and cookie makers (13,560.5), medical and welfare-related elementary workers (11,633.4), medical and dental equipment technicians (9,941.5), and meter reading or money collecting and parking-related workers (9,344.9) comprised the high-risk occupations. In the WC group, food/lodging/tourism/entertainment and sports-related manager (10,963.5), environment and cleaning, and protective service-related manager (7,556.9), finance and insurance-related clerk (4,964.4), accounting book-keeping clerk (4,953.6), and social welfare and counseling professional (4,671.7) were the high-risk occupations. For men in the WC group, food/lodging/tourism/entertainment and sports-related manager (5,930.9), Environment/cleaning/protective service-related manager (5,892.7), finance and insurance clerk (3,624.9), sales and transport manager (2,871.8), and administration and business support clerk (2,780.2) were the high risk occupations. For women in the WC group, food/lodging/tourism/entertainment and sports-related manager (15,322.8), environment and cleaning, and protective service-related manager (10,475.1), business and sales-related manager (9,795.8), administration and business support clerk (6,341.6), and product-related manager (5,105.5) were the high-risk occupations (Table 4).
Table 4
Occupations of high proportion of varicose veins according to gender and occupation type
DISCUSSION
This study aimed to investigate the difference in the proportion of VV patients according to gender, age, and most importantly, occupational working posture and determine the high-risk occupations. In this study, the proportion of VV was greater among women than men and in the BC group than in the WC group. In the BC group, the proportion of VV cases was the highest in the standing group, followed by the walking group and sitting group, but did not show difference between standing and working group among men. In the WC group, the standing group had a higher proportion of VV cases than the sitting group, and there was similar proportion between the standing and sitting among men.
In this study, the number of patients per 100,000 increased with the age, regardless of gender and occupation type. Many studies have found a significant correlation between age and incidence of VV [14,15]. Our result was compatible with that of other studies, namely we found an increase in the proportion of VV cases with age, especially in the over 60 years age group. As we covered currently working subjects enrolled in the NEI data, the pattern of increasing proportion with age could have been influenced by working status. Our findings also indicated that the proportion of VV among women was about 2.3-fold higher (3,411.9) than men (1,505.7). The gap in the proportion between sex was higher for the BC than WC group. In many studies, VV was found to be more common in women than men [6,16] because venous dysfunction is associated with the hormonal effect of pregnancy, and women tend to frequently present with VV and receive treatment for the same, leading to overestimation. On the other hand, several studies have reported a higher prevalence of VV among men [17,18], mainly due to the influence of occupational risk factors [5,13,19]. Although our results showed high proportion of VV in women than in men, it is limited to say our results were influenced by these factors because they were not adjusted by age and occupations. Further study about the effect of sex and occupations on varicose vein is needed.
To analyze the impact of occupational working position on the prevalence of VV, 240 occupations were categorized into standing, walking, and sitting position by 2 experts according to the dominant posture during the working hours. In this study, the standing group had the highest proportion of VV cases in both BC and WC groups. For women, the number of VV patients for 100,000 individuals was the highest in the standing group, followed by the walking group and sitting group in both BC and WC groups. For men in the BC group, the proportion of VV cases was higher in the standing and walking groups than in sitting groups, with no significant difference between the standing and walking groups. For men in the WC group, there was no significant difference between the proportion of VV cases in the standing group and sitting group. Several studies have suggested the association between prolonged standing and VV [11,12,20,21,22]. VV is associated with prolonged standing at work and also sedentary work [6,23]. In the BC group, the proportion of VV among men was higher in the standing and walking groups than in the sitting group. One of the reasons is the lack of a clear dominant working posture in several occupations. Another reason is that men are likely exposed to other occupational risk factors, such as heavy lifting, adding to the prolonged standing effect in the walking group than in the standing group. In the WC group, there was no difference between the standing group and sitting group. As WC workers tend to sit more than BC workers, even for occupations in the standing group, the influence of standing on VV could be weakened.
We extracted the high-risk occupations for VV in the BC and WC groups. In the BC group, the proportion of VV cases was the highest for the medical and welfare-related elementary worker, baker and cookie maker, automobile assembler, cleaning and guarding-related elemental worker, and nurse and dental hygienist occupations. In the WC group, the proportion of VV cases was high for the food/lodging/tourism/entertainment and sports-related manager, environment/cleaning/protective services-related manager, finance and insurance-related clerk, accounting book-keeping clerk, and social welfare and counseling professional occupations. A few studies were performed on the association between VV and occupations such as hairdresser and nurse, but no study has determined high-risk occupational groups. One study examined the health status of hospital employees and reported a noticeable VV prevalence [24]. These findings suggest the need for further studies on the occupational risk factors of VV and preventive policies for high-risk groups.
For classifying the occupations into 3 categories, we defined the standing group as involving standing for more than 4 h/day, walking group as involving walking for more than 2 h/day, and sitting group as involving standing/walking for less than 4 h/day. Therefore, the sitting group represents fewer standing hours and not sedentary occupations. In other articles, there were different criteria and there is no consensus on how to categorize the working posture among workers. One study used a questionnaire asking, “Does your work entail that you sit?” with 6 response options: “almost all the time,” “approximately 3/4 of the time,” “approximately 1/2 of the time,” “approximately 1/4 of the time,” “seldom,” and “never” [11]. Another study used the criterion of standing/walking for less than 4 h/day or more than 6 h/day [12]. Other studies divided the 3 groups depending on the working condition: prolonged standing (≥ 5 hours), prolonged standing (≥ 5 hours) with substantial movement, and not standing for a prolonged time (< 5 hours) [25]; this concept is similar that used in our study [25]. Several studies focused on the effect of prolonged standing at work among nurses and used the criteria of less than 2 hours, between 2 and 4 hours, and more than 4 hours, for standing, walking, and sitting time [21,22].
Our study enrolled 9,720,552 subjects in 240 different occupations, so the strength of our study is that we could analyze a large amount of data according to the working posture of different occupations. By comparing occupations with large and small number of patients, we could estimate the occupational risk factor for VV. It is one of the largest studies to investigate the prevalence of VV in occupations with different dominant working postures. One of the limitations of this study is the coverage of data. Private school faculty and public service officials were not enrolled in the data and about 15% of NHI and NEI data were lost because of mismatch. The study included workers enrolled in the NEI data, not the general population, so the sociodemographic characteristics of our sample cannot represent the general situation. Another one is the limitation of study design. As we could not get individual person-year information, we used the number enrolled workers in 2012 as a denominator to find distribution of varicose vein patients among diverse occupations. We assumed that there are no migration between BC and WC workers from 2008 to 2015, and the age-distribution is fixed. As we represented the number of VV patients among 100,000 workers without standardization of age, it is restricted to interpret the value as prevalence. Also the experts who designated the categories for the 240 occupations could have made some errors. Despite of these limitations, our study is the first to compare different occupations and can be used as the basis for further cohort studies on occupational risks for VV. We need to include government officers and school personnel and unmatched workers and further analyze the occupational burden of VV in specific high-risk occupations.
CONCLUSIONS
The proportion of VV cases increased with age and was higher among women than men. Furthermore, the number of VV patients was higher in the BC group than in the WC group. In the BC group, the number of VV patients was the highest in the standing group, followed by the walking group and the sitting group. In the WC group, there was no walking group and the proportion of VV cases was higher in standing group than in the sitting group. For women, the standing group had the highest proportion of VV cases in both groups. In the BC group, the standing or walking group had a significantly higher prevalence of VV than the sitting group, but there were no significant difference between the standing group and sitting group for men. In the WC group, there was no significant difference between the standing group and walking group for men. In the BC group, the proportion of VV patients was the highest in the medical and welfare-related service worker, baker and cookie maker, automobile assembler, and cleaning and guarding-related elemental worker, and nurses and dental hygienist occupations. In the WC group, the proportion of VV patients was highest in the food/lodging/tourism/entertainment and sports-related manager, environment/cleaning/protective services-related manager, finance and insurance-related clerk, accounting and book-keeping clerk and social welfare and counseling professional occupations. This study covered diverse occupations using large-scale datasets. The findings can help determine the occupational risk factors for VV as a musculoskeletal burden. Further studies are needed with specific analysis on the impact of occupational risk factors of VV.
Acknowledgements
National Health Information Database was provided by the National Health Insurance Service (NHIS) of Korea. This study was approved by NHIS (NHIS-2018-1-400). The authors would like to thank the NHIS for cooperation.
-
Funding: This work was supported by a 2-year Research grant of Pusan National University (2019).
-
Competing interests: The authors declare that they have no competing interest.
-
Author Contributions:
NOTES
Abbreviations
BC
blue-collar
BMI
body mass index
CVI
chronic venous insufficiency
DM
diabetes mellitus
NEI
National Employment Insurance
NHI
National Health Insurance
NHIS
National Health Insurance Service
VV
varicose veins
WC
white-collar
- 1. DePopas E, Brown M. Varicose veins and lower extremity venous insufficiency. Semin Intervent Radiol 2018;35(1):56–61. 29628617.ArticlePubMedPMC
- 2. Jacobs BN, Andraska EA, Obi AT, Wakefield TW. Pathophysiology of varicose veins. J Vasc Surg Venous Lymphat Disord 2017;5(3):460–467. 28411716.ArticlePubMed
- 3. Callam MJ. Epidemiology of varicose veins. Br J Surg 1994;81(2):167–173. 8156326.ArticlePubMedPDF
- 4. Evans CJ, Fowkes FG, Ruckley CV, Lee AJ. Prevalence of varicose veins and chronic venous insufficiency in men and women in the general population: Edinburgh Vein Study. J Epidemiol Community Health 1999;53(3):149–153. 10396491.ArticlePubMedPMC
- 5. Eberhardt RT, Raffetto JD. Chronic venous insufficiency. Circulation 2014;130(4):333–346. 25047584.ArticlePubMed
- 6. Brand FN, Dannenberg AL, Abbott RD, Kannel WB. The epidemiology of varicose veins: the Framingham Study. Am J Prev Med 1988;4(2):96–101. 3395496.ArticlePubMed
- 7. Tibbs DJ. Varicose veins and related disorders. Oxford: Butterworth-Heinemann; 1992.
- 8. Chiesa R, Marone EM, Limoni C, Volontè M, Petrini O. Chronic venous disorders: correlation between visible signs, symptoms, and presence of functional disease. J Vasc Surg 2007;46(2):322–330. 17600668.ArticlePubMed
- 9. Fowkes FG, Lee AJ, Evans CJ, Allan PL, Bradbury AW, Ruckley CV. Lifestyle risk factors for lower limb venous reflux in the general population: Edinburgh Vein Study. Int J Epidemiol 2001;30(4):846–852. 11511615.ArticlePubMed
- 10. Scott TE, LaMorte WW, Gorin DR, Menzoian JO. Risk factors for chronic venous insufficiency: a dual case-control study. J Vasc Surg 1995;22(5):622–628. 7494366.ArticlePubMed
- 11. Tüchsen F, Hannerz H, Burr H, Krause N. Prolonged standing at work and hospitalisation due to varicose veins: a 12 year prospective study of the Danish population. Occup Environ Med 2005;62(12):847–850. 16299093.ArticlePubMedPMC
- 12. Tabatabaeifar S, Frost P, Andersen JH, Jensen LD, Thomsen JF, Svendsen SW. Varicose veins in the lower extremities in relation to occupational mechanical exposures: a longitudinal study. Occup Environ Med 2015;72(5):330–337. 25575530.ArticlePubMed
- 13. Kontosić I, Vukelić M, Drescik I, Mesaros-Kanjski E, Materljan E, Jonjić A. Work conditions as risk factors for varicose veins of the lower extremities in certain professions of the working population of Rijeka. Acta Med Okayama 2000;54(1):33–38. 10709620.PubMed
- 14. Reček Č. Conception of the venous hemodynamics in the lower extremity. Angiology 2006;57(5):556–563. 17067977.ArticlePubMedPDF
- 15. Beebe-Dimmer JL, Pfeifer JR, Engle JS, Schottenfeld D. The epidemiology of chronic venous insufficiency and varicose veins. Ann Epidemiol 2005;15(3):175–184. 15723761.ArticlePubMed
- 16. Zahariev T, Anastassov V, Girov K, Goranova E, Grozdinski L, Kniajev V, et al. Prevalence of primary chronic venous disease: the Bulgarian experience. Int Angiol 2009;28(4):303–310. 19648874.PubMed
- 17. Ahti T. Risk factors of varicose veins. Tampere: Tampere University Press; 2010.
- 18. Das K, Ahmed S, Abro S, Arain MS. Varicose veins; outcome of surgical management and recurrences. Prof Med J 2014;21(3):509–513.
- 19. Sahu S, Bhushan S, Sachan P. Clinco-anatomical and radiological study of varicose veins of lower limb and their management outcomes. Internet J Surg 2012;28(2.
- 20. Chen CL, Guo HR. Varicose veins in hairdressers and associated risk factors: a cross-sectional study. BMC Public Health 2014;14:885. 25168336.ArticlePubMedPMCPDF
- 21. Sharif Nia H, Chan YH, Haghdoost AA, Soleimani MA, Beheshti Z, Bahrami N. Varicose veins of the legs among nurses: occupational and demographic characteristics. Int J Nurs Pract 2015;21(3):313–320. 24689446.ArticlePubMed
- 22. Yun MJ, Kim YK, Kang DM, Kim JE, Ha WC, Jung KY, et al. A study on prevalence and risk factors for varicose veins in nurses at a university hospital. Saf Health Work 2018;9(1):79–83. 30363079.ArticlePubMedPMC
- 23. Abramson JH, Hopp C, Epstein LM. The epidemiology of varicose veins. A survey in western Jerusalem. J Epidemiol Community Health 1981;35(3):213–217. 7328382.ArticlePubMedPMC
- 24. Lim HS. A study on the development of the occupational health manual for hospital employees. Ulsan: KOSHA; 2002.
- 25. Kohno K, Niihara H, Hamano T, Takeda M, Yamasaki M, Mizumoto K, et al. Standing posture at work and overweight exacerbate varicose veins: Shimane CoHRE Study. J Dermatol 2014;41(11):964–968. 25298232.PubMed
References
Figure & Data
REFERENCES
Citations
Citations to this article as recorded by 
- Venous disorders as an occupational disease – a systematic review on epidemiology, pathophysiology, and modification strategies
Tobias Hirsch, Uwe Wahl, Eberhard Rabe
Vasa.2024; 53(3): 172. CrossRef - Social Determinants of Health and Vascular Diseases: A Systematic Review and Call for Action
Davide Costa, Nicola Ielapi, Egidio Bevacqua, Salvatore Ciranni, Lucia Cristodoro, Giuseppina Torcia, Raffaele Serra
Social Sciences.2023; 12(4): 214. CrossRef - Randomized controlled trial on occupational graduated compression clinical and cost-effectiveness
Sergio GIANESINI, Emidia VAGNONI, Caterina CAVICCHI, Yung-Wei CHI, Anselmo PAGANI, Mirko TESSARI, Paolo ZAMBONI, Erica MENEGATTI
International Angiology.2023;[Epub] CrossRef - Factors associated with chronic venous disease: study in 1,136 patients treated for varicose veins of the lower limbs in a specialized clinic
Martha Ofelia Correa Posada, Laura Maria Contreras Correa, John Fernando García Vélez
Jornal Vascular Brasileiro.2022;[Epub] CrossRef - Occupational morbidity and occupational injury in the food industry
V. Yu. Kontareva, S. N. Belik
Safety of Technogenic and Natural System.2022; (1): 32. CrossRef - Factores asociados con la enfermedad venosa crónica: estudio en 1.136 pacientes tratados por várices de miembros inferiores en una clínica especializada en Colombia
Martha Ofelia Correa Posada, Laura Maria Contreras Correa, John Fernando García Vélez
Jornal Vascular Brasileiro.2022;[Epub] CrossRef - Gender differences and site-specific incident risks of musculoskeletal disorders among 224 506 workers in the food and beverage service industry in Taiwan: A 15-year Nationwide Population-Based Cohort Study
Chiung-Yu Peng, Hui-Min Hsieh, Meng-Yun Li, Lih-Jiun Liaw, Chao-Ling Wang, Chih-Hong Pan, Ming-Tsang Wu
Journal of Occupational Health.2021;[Epub] CrossRef
 PubReader
 ePub Link
 Cite
CiteDistribution of working position among workers with varicose veins based on the National Health Insurance and National Employment Insurance data
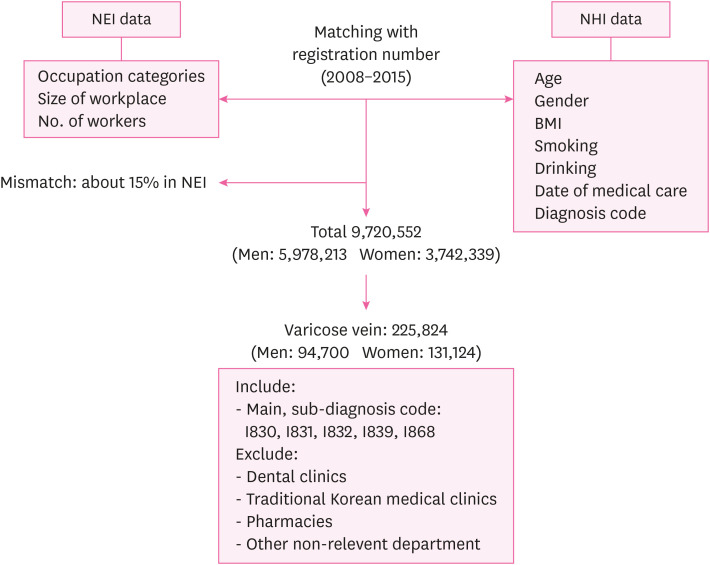
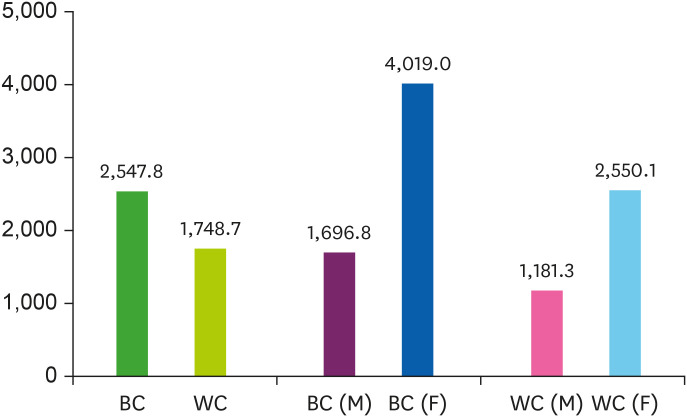

Fig. 1 Flowchart of selection of study participants.NEI: National Employment Insurance; NHI: National Health Insurance; BMI: body mass index.
Fig. 2 Number of patients with varicose vein per 100,000 individuals according to occupation type and gender.M: male; F: female; BC: blue-collar; WC: white-collar.
Fig. 3 (A) Number of patients with varicose vein per 100,000 individuals according to occupation type and working posture. (B) Number of patients with varicose vein per 100,000 individuals according to gender, occupation type, and working posture.M: male; F: female; BC: blue-collar worker; WC: white-collar worker.The χ2 test according to each groups, ap-value < 0.001; bp-value = 0.082; cp-value = 0.766.
Fig. 1
Fig. 2
Fig. 3
Distribution of working position among workers with varicose veins based on the National Health Insurance and National Employment Insurance data
| Variables | Category | Men (%) | Women (%) | p-valuea |
|---|---|---|---|---|
| Age (years) | < 20 | 86 (0.1) | 292 (0.2) | < 0.001 |
| 20–29 | 8,428 (9.0) | 27,195 (20.7) | ||
| 30–39 | 22,929 (24.2) | 28,800 (22.0) | ||
| 40–49 | 24,735 (26.1) | 38,424 (29.3) | ||
| 50–59 | 23,691 (25.0) | 28,916 (22.1) | ||
| 60–69 | 12,234 (12.9) | 6,918 (5.3) | ||
| ≥ 70 | 2,597 (2.7) | 579 (0.4) | ||
| BMI (kg/m2) | ≥ 26 | 20,227 (21.4) | 13,545 (10.3) | < 0.001 |
| < 26 | 74,473 (78.6) | 117,579 (89.7) | ||
| DM | Yes | 3,209 (3.3) | 1,335 (1.0) | < 0.001 |
| No | 91,491 (96.7) | 129,789 (99.0) | ||
| Smokingb | Yes | 30,349 (38.5) | 3,028 (2.9) | < 0.001 |
| No | 48,436 (61.5) | 102,670 (97.1) | ||
| Alcohol drinkingc | Yes | 48,326 (68.3) | 33,473 (34.7) | < 0.001 |
| No | 22,416 (31.7) | 62,870 (65.3) | ||
| Work period (years) | ≥ 5 | 31,106 (32.8) | 23,709 (18.0) | < 0.001 |
| < 5 | 63,594 (67.2) | 107,415 (82.0) | ||
| Number of employees | < 5 | 9,472 (10.0) | 18,163 (13.9) | < 0.001 |
| 5–50 | 30,809 (32.5) | 46,785 (35.7) | ||
| 50–300 | 22,529 (23.8) | 28,891 (22.0) | ||
| 300–1,000 | 11,376 (12.0) | 13,527 (10.3) | ||
| > 1,000 | 20,514 (21.7) | 23,758 (18.1) | ||
| Total number | 94,700 | 131,124 |
| Age (years) | Men | Women | ||||
|---|---|---|---|---|---|---|
| NEIa | Pb | Nc | NEIa (person) | Pb | Nc | |
| < 20 | 165,729 | 86 | 51.9 | 292,673 | 292 | 99.8 |
| 20–29 | 1,642,481 | 8,428 | 513.1 | 1,283,310 | 27,195 | 2,119.1 |
| 30–39 | 1,902,452 | 22,929 | 1,205.2 | 977,270 | 28,800 | 2,947.0 |
| 40–49 | 1,359,323 | 24,735 | 1,819.7 | 787,600 | 38,424 | 4,878.6 |
| 50–59 | 675,166 | 23,691 | 3,508.9 | 333,426 | 28,916 | 8,672.4 |
| 60–69 | 215,266 | 12,234 | 5,683.2 | 65,064 | 6,918 | 10,632.6 |
| ≥ 70 | 17,796 | 2,597 | 14,593.2 | 2,996 | 579 | 19,325.8 |
| Total | 5,978,213 | 94,700 | 1,584.1 | 3,742,339 | 131,124 | 3,503.8 |
| Age (years) | Blue-collar | White-collar | ||||
|---|---|---|---|---|---|---|
| Men | Women | Total | Men | Women | Total | |
| < 20 | 54.8 | 141.0 | 101.2 | 46.2 | 61.8 | 57.8 |
| 20–29 | 638.0 | 3,184.4 | 1,487.7 | 382.4 | 1,592.4 | 1,670.1 |
| 30–39 | 1,306.5 | 2,825.7 | 1,789.2 | 98.4 | 2,893.7 | 1,670.1 |
| 40–49 | 1,894.6 | 4,791.2 | 3,079.1 | 1,515.6 | 4,873.5 | 2,546.0 |
| 50–59 | 3,869.4 | 8,680.9 | 5,750.5 | 2,699.7 | 8,253.3 | 4,016.6 |
| 60–69 | 7,322.8 | 9,854.8 | 8,252.6 | 4,492.8 | 13,009.2 | 5,356.7 |
| ≥ 70 | 21,845.7 | 20,504.9 | 21,465.3 | 11,792.3 | 16,966.8 | 12,183.8 |
| Type of occupation | Men | Women | Total | |||
|---|---|---|---|---|---|---|
| Occupations | Na | Occupations | Na | Occupations | Na | |
| BC | Guard | 5,564.7 | Automobile assembler | 16,764.5 | Medical and welfare-related elementary worker | 11,068.6 |
| Cleaning and guarding-related elemental worker | 5,524.0 | Baker and cookie maker | 13,560.5 | Bakers and cookie maker | 9,152.5 | |
| Automobile assembler | 5,191.9 | Medical and welfare-related elementary worker | 11,633.4 | Automobile assembler | 8,106.4 | |
| Medical and welfare-related elementary worker | 5,161.3 | Medical and dental equipment technician | 9,941.5 | Cleaning and guarding-related elemental worker | 7,921.0 | |
| Bakers and cookie maker | 4,960.3 | Meter reading or money collecting and parking-related worker | 9,344.9 | Nurses and dental hygienist | 7,281.2 | |
| WC | Food/lodging/tourism/entertainment and sports-related manage | 5,930.9 | Food/lodging/tourism/entertainment and sports-related manage | 15,322.8 | Food/lodging/tourism/entertainment and sports-related manager | 10,963.5 |
| Environment/cleaning/protective service-related manager | 5,892.7 | Environment/cleaning/protective service-related manager | 10,475.1 | Environment/cleaning/protective service-related manager | 7,556.9 | |
| Finance and insurance-related clerk | 3,624.9 | Business and sales-related manager | 9,795.8 | Finance and insurance-related clerk | 4,964.4 | |
| Sales and transport manager | 2,871.8 | Administration and business support clerk | 6,341.6 | Accounting book-keeping clerk | 4,953.6 | |
| Administration and business support clerk | 2,780.2 | Product-related manager | 5,105.0 | Social welfare and counseling professional | 4,671.7 | |
Table 1 General characteristics of the study participants
BMI: body mass index; DM: diabetes mellitus.
aχ2 test according to sex, BMI, DM, smoking, drinking, work period, and number of employees; bMissing value: 41,341; cMissing value: 58,739.
Table 2 The proportion of varicose vein cases with NEI data according to gender and age
NEI: National Employment Insurance.
aNumber of NEI subscribers in 2012, bNumber of patients with varicose vein, cNumber of patients per 100,000 individuals.
Table 3 Number of patients per 100,000 individuals according to age and occupation type
Table 4 Occupations of high proportion of varicose veins according to gender and occupation type
BC: blue-collar; WC: white-collar.
aNumber of patients per 100,000 individuals.

