Association of heavy metal complex exposure and neurobehavioral function of children
Article information

Abstract
Background
Exposure to heavy metals is a public health concern worldwide. Previous studies on the association between heavy metal exposure and neurobehavioral functions in children have focused on single exposures and clinical manifestations. However, the present study evaluated the effects of heavy metal complex exposure on subclinical neurobehavioral function using a Korean Computerized Neurobehavior Test (KCNT).
Methods
Urinary mercury, lead, cadmium analyses as well as symbol digit substitution (SDS) and choice reaction time (CRT) tests of the KCNT were conducted in children aged between 10 and 12 years. Reaction time and urinary heavy metal levels were analyzed using partial correlation, linear regression, Bayesian kernel machine regression (BKMR), the weighted quantile sum (WQS) regression and quantile G-computation analysis.
Results
Participants of 203 SDS tests and 198 CRT tests were analyzed, excluding poor cooperation and inappropriate urine sample. Partial correlation analysis revealed no association between neurobehavioral function and exposure to individual heavy metals. The result of multiple linear regression shows significant positive association between urinary lead, mercury, and CRT. BMKR, WQS regression and quantile G-computation analysis showed a statistically significant positive association between complex urinary heavy metal concentrations, especially lead and mercury, and reaction time.
Conclusions
Assuming complex exposures, urinary heavy metal concentrations showed a statistically significant positive association with CRT. These results suggest that heavy metal complex exposure during childhood should be evaluated and managed strictly.
BACKGROUND
Childhood exposure to heavy metals is a major global public health concern. This mainly occurs due to environmental exposure, rather than occupational exposure. Unlike occupational exposure, environmental exposure occurs chronically at low levels and causes subtle clinical changes but affects a wider population. Thus, there is an increasing need for research on the environmental exposure to heavy metal complexes.
Heavy metal concentrations in children are decreasing in developed countries. According to the Centers for Disease Control and Prevention, in American children aged 6–11 years, the median value of urine mercury levels was under 0.35 μg/g creatinine in 2007–2014. The median value of lead levels has decreased from 1.10 μg/L in 1999 to 0.24 μg/L in 2014. The median value of urinary cadmium levels, which was about 0.80 μg/g creatinine, has been decreasing since 1999.1 Similarly, the Korea National Health and Nutrition Examination Survey showed that the median values of blood mercury, lead, and cadmium levels have consistently decreased in the Republic of Korea.2 Therefore, concerns regarding the safety of low-concentration exposure are rising.3 Thus, the focus of research has recently shifted from high-concentration single-source exposure to low-concentration complex exposure.
Neurological problems or toxicity caused by exposure to heavy metals are widely recognized, and various epidemiological studies45 and mechanistic studies67 have been conducted. However, most studies have focused on the relationship between heavy metals and disease or clinical symptoms. There is still a lack of research on whether neurological effects occur at low levels observed in the general population. Thus, the present study focused on the association between exposure to complex heavy metals and neurobehavioral function.
METHODS
Study population
We used the data from “health impact assessment of Pohang region near incinerator.” Health examinations, including sampling, surveys, and the Korean Computerized Neurobehavior Test (KCNT), were performed in July 2022. Urinalysis, urinary heavy metal analysis, and symbol digit substitution (SDS) and choice reaction time (CRT) tests given by the KCNTs (MaxMedica Inc., Seoul, Korea) were performed. Participants previously diagnosed with mental retardation were excluded from the study. Participants in the bottom 5% of scores were considered as extreme value and were excluded from the analysis; CRT test scores < 13 and participants with SDS test scores < 7 were excluded for each analysis.8
Measurement of urinary heavy metals
Urine was sampled in a 50 mL conical tube without additives. The samples were stored in an icebox and transferred to the Seoul Clinical Laboratory (Yongin, Korea). Urinary heavy metal analysis was performed using inductively coupled plasma mass spectrometry (ICP-MS). Urine was distributed into 4 tubes: blank, quality control (QC), sample, and standard. We added 200 μL of 1% HNO3 to each tube. A standard calibration solution (Sigma-Aldrich, St. Louis, MO, USA) was added in the standard tube. ClinChek® Urine Control for Trace Elements (Recipe, München, Germany) was added in the QC tube. In the sample tube, 200 μL of urine was collected. Each tube was vortexed for 30 seconds and placed in ICP-MS/Agilent 7700, 7900 (Agilent, Santa Clara, CA, USA). The limits of detection for mercury, lead, and cadmium were 34 ng/L, 0.7 ng/L, and 1.1 ng/L, respectively. Urinary creatinine analysis was performed using a kinetic colorimetric assay based on the Jaffé method using a Roche/Hitachi Cobas c 701/702 analyzer (Roche Diagnostics, Manheim, Germany). Range of detection was 4.2–622 mg/dL.
CRT test
The medical history was recorded by a doctor before conducting the test. Crosses with one arm shorter than the other appeared on the monitor, and the test participant was asked to press the arrow key on the keyboard corresponding to the shorter arm as quickly as possible. The test recorded whether the appropriate arrow had been pressed, and the reaction time until it was pressed. One set of the CRT tests contained 32 items, and 2 sets were conducted for each participant. The highest score recorded was 16 points. In this process, the participant was required to memorize the right reaction, make a cognitive judgement, and adequately select and conduct the appropriate motor activity. This test evaluated attention, reaction time, and spatial awareness.9
SDS test
The medical history was recorded by a doctor before conducting the test. Nine combinations of numbers and symbols appeared, and a random combination of 9 symbols appeared underneath. The test participant was asked to press the number key corresponding to the symbols above.10 The test recorded whether the appropriate number had been pressed, and the reaction time until it was pressed. One set of SDS tests contained 9 items, and 2 sets were conducted for each participant. The highest score recorded was 9 points. In this process, the participant was required to memorize the right reaction, make a cognitive judgement, and adequately select and conduct the appropriate motor activity.9 This test evaluated attention, reaction time, and spatial awareness. All the tests were conducted by a professional clinical psychologist.
Statistical analysis
General characteristics are presented as means and standard deviations. For variables with skewed distributions, the median, 25th percentiles, and 75th percentiles are presented. Right-skewed variables (urinary heavy metals) were used as natural log-transformed variables for the statistical analysis.
To assess the correlation between cognitive function and heavy metals, a partial correlation analysis between reaction time in SDS and CRT tests and heavy metals was performed and adjusted confounders. Additionally, to assess the effects of exposure to each heavy metal, 3 separate linear regression models were calculated using the ordinary least squares (OLS) method, with heavy metal as an independent variable and reaction time as a dependent variable. Most of the reviewed studies presented urinary concentrations of mercury and cadmium as creatinine adjustments and lead as specific gravity adjustments; therefore, the present study was followed to enable easy comparison.111213 Sex and age were selected as confounding factors that could potentially influence both the outcome and the independent variable.14 The model was developed with 3 urinary heavy metals (log-transformed), age, and sex as independent variables, and reaction time as the dependent variable. Regression analysis using the OLS method yields biased results when the independent variables show a strong correlation, mainly owing to common exposure issues. Thus, we used a novel statistical approach for complex toxic material exposure, such as the Bayesian kernel machine regression (BKMR), weighted quantile sum (WQS), and quantile G-computation models.
Several studies have used the BKMR approach for modeling complex exposure.15 Briefly, BKMR uses a Gaussian predictive process approach and component-wise variable selection to estimate posterior inclusion probabilities. The final model was fitted using the Markov Chain Monte Carlo sampler for 50,000 iterations. The model is given by as follows.

Yi denotes the response for individual i, Cd, Hg and Pb are the exposure variables, h denotes the unknown exposure-response function to be estimated, β denotes the effect of the confounders (Xi is a vector) and εi is residuals, assumed to be independent and identically normally distributed with a common variance.
WQS and quantile G-computation analyses were performed to identify the weights of the effects of each of the 3 heavy metals on reaction time. WQS regression was used to calculate the burden index of correlated environmental chemicals, which was constrained to better model associations between the outcome and chemicals with unidirective.16 The quantile G-computation model estimated the parameters of the marginal structural model.17 Compared with WQS, it is possible to model more suitable nonlinear associations between variables and improve the limitations that can only identify unidirectional effects of WQS.
A regression model with complex exposure was calculated using both WQS and quantile G-computation models. Bootstrapping was performed to evaluate the weights of the 3 heavy metals in the mixture using the training dataset for both models. After calculating for both models using linear and quadratic terms of the exposure complex variable, the model with a lower Akaike information criterion (AIC) was selected for the analysis. Bootstrap sampling was performed 100 times to calculate the weights. The WQS approach calculates the weighted linear index using bootstrap sampling. For WQS regression, the sample size was randomly split into a training dataset (40%) and a validation dataset (60%). The weight of each heavy metal in the mixture was calculated using the WQS and quantile G computation models. Bootstrap sampling was performed 100 times to calculate the weights.
SPSS 23.00 (IBM, Armonk, NY, USA) was used for descriptive statistics, partial correlation analysis, and OLS regression analysis. BKMR, WQS regression, and quantile G-computation models were developed by R Project 4.2.2 (https://r-project.org; R Foundation, Vienna, Austria) using the “bkmr,” “gwqs,” and “qgcomp” packages, respectively.
Ethics statement
The study protocol was reviewed and approved by the Institutional Review Board (IRB) of Yeungnam University (IRB No. 2021-11-008-001). Informed consent was obtained from all participants during enrollment. This study was conducted in accordance with the ethical standards of the Institutional Research Committee and/or National Research Committee of the 1964 Helsinki Declaration and its later amendments or comparable ethical standards.
RESULTS
General characteristics, urinary heavy metals, and KCNT
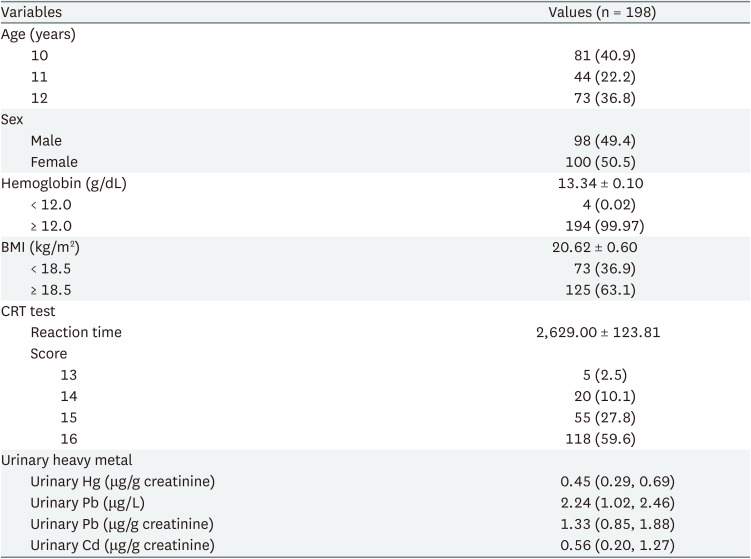
A total of 211 students, aged between 10 and 12 years, from 4 elementary schools were screened for this study. Fig. 1 depicts the participant selection flowchart for this study. Table 1 presents the general characteristics of the participants in the CRT analysis. A total of 98 girls and 100 boys were included in this study. Average age of the 198 participants was 10.0 ± 0.88 years, of which 81 (40.9%) aged 10 years, 44 (22.2%) aged 11 years, and 73 (36.8%) aged 12 years. The average reaction time in the CRT test was 2,629.00 ± 123.81 ms. The 25th percentile, median, and 75th percentile values of each urinary heavy metal were 0.29, 0.45, 0.69 μg/g creatinine for mercury, 1.02, 2.24, 2.46 μg/L for lead, and 0.20, 0.56, 1.27 μg/g creatinine for cadmium, respectively. The general characteristics of participants in the SDS reaction time test were presented in Supplementary Tables 1, 2, 3. In total, 99 girls and 104 boys were recruited. Average age of the 203 participants was 10.9 ± 0.88 years, of which 41% aged 10 years, 23% aged 11 years, and 35% aged 12 years. The average reaction time in the SDS test was 2,813.31 ± 782.64 ms. The 25th percentile, median, and 75th percentile values of each urinary heavy metal were 0.29, 0.45, 0.70 μg/g creatinine for mercury, 1.02, 2.24, 2.45 μg/L for lead, and 0.20, 0.51, 1.27 μg/g creatinine for cadmium, respectively.
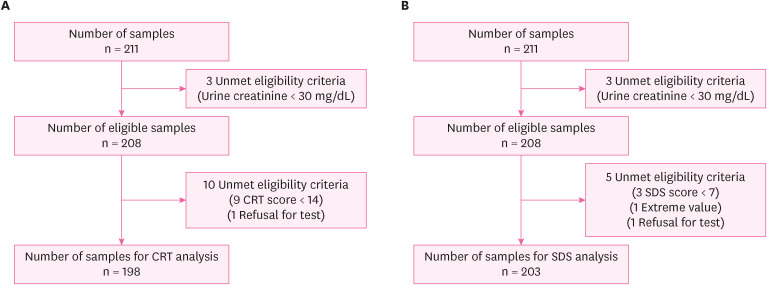
Flow chart of participant selection.
CRT: choice reaction time; SDS: symbol digit substitution.
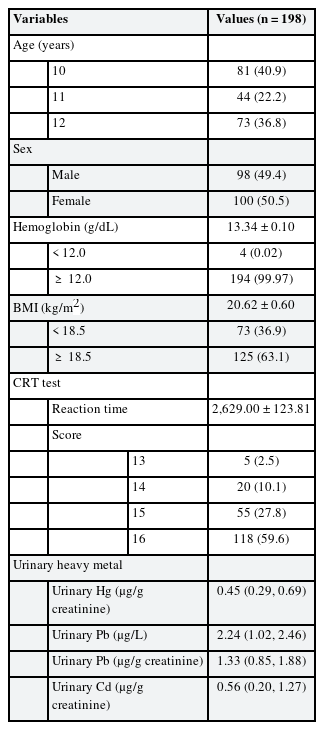
General characteristics of participants for the CRT test reaction time analysis
Fig. 2 shows the distribution of urinary heavy metals and reaction times of the CRT tests. The distribution of urinary mercury and cadmium levels was skewed to the right. The urinary lead level distribution showed right-skewed data in a double-peak form. Since each heavy metal data distribution was right-skewed, further statistical evaluations were performed using the log-transformation of urinary heavy metal value.18
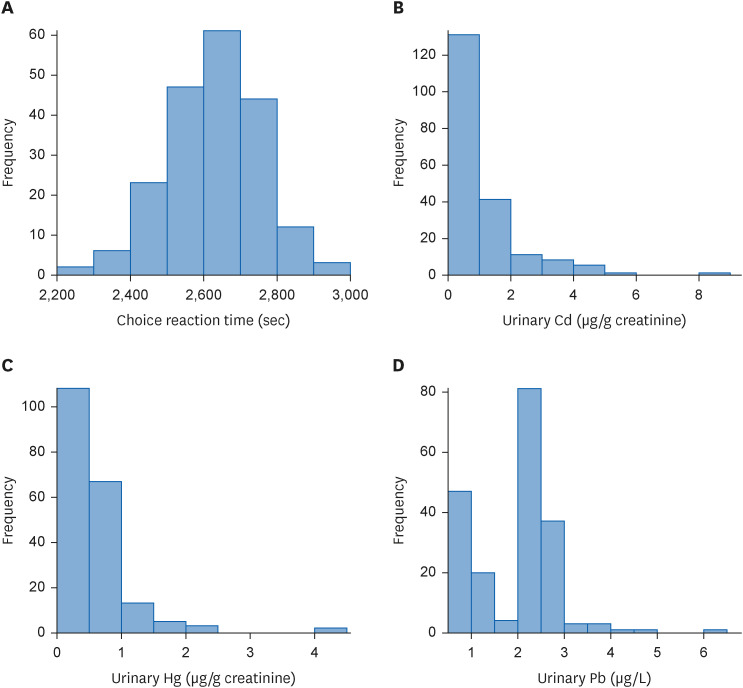
Distribution of choice reaction time and urinary heavy metal level. (A) Distribution of reaction time of choice reaction time test. (B) Distribution of urinary Hg levels. (C) Distribution of urinary Pb levels. (D) Distribution of urinary Cd levels.
Cd: cadmium; Hg: mercury; Pb: lead.
Correlation between heavy metals and reaction time
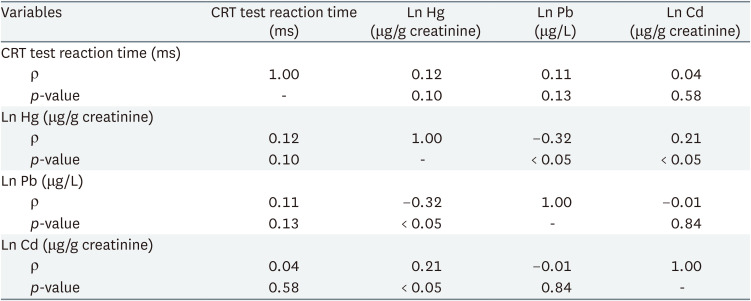
Table 2 shows partial correlation analysis of urinary heavy metal and reaction time. Results showed no statistically significant association between individual urinary heavy metals and reaction time. Table 3 shows linear regression analysis under assumption of heavy metal complex exposure. After adjustment for sex and age, multiple linear regression showed that urinary lead and mercury levels had statistically significant association with CRT test reaction time.
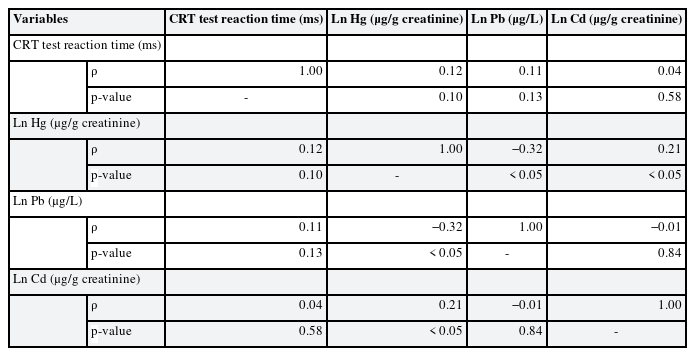
Partial correlation analysis of CRT and symbol digit substitution reaction time and heavy metals
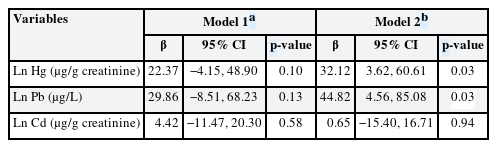
Linear regression analysis of choice reaction time test reaction time and heavy metals
Partial correlation analysis and linear regression analysis of SDS reaction time and urinary heavy metal concentration are presented in Supplementary Tables 1, 2, 3. There were no statistically significant association between reaction time and urinary heavy metal concentration; therefore, further statistical analysis was done only with CRT test reaction time and urinary heavy metals.
In the BKMR analysis, urinary mercury and lead levels showed a positive linear correlation with reaction time when other variables were fixed at the median value. Under the assumption of complex exposure to mercury and lead, the 25th percentile was set as the reference point. Groups below the 25th percentile showed a statistically significant decrease. Groups higher than the 10th percentile showed a statistically significant increase.
Fig. 3A shows the results of the BKMR analysis of the univariate dose-response association of each heavy metal. Each graph depicts the dose-response associations of urinary mercury, lead, and cadmium levels, assuming that the other 2 heavy metal levels were fixed at the median level. The results showed that urinary mercury and lead levels were positively correlated with reaction time; however, cadmium levels showed no correlation. Fig. 3B shows the overall mixture effect of heavy metals and reaction time. The effects of exposure to the 3 heavy metals were collectively evaluated at 95% credible intervals. The reference value is the 25th percentile, and the graph shows an almost linear positive correlation.
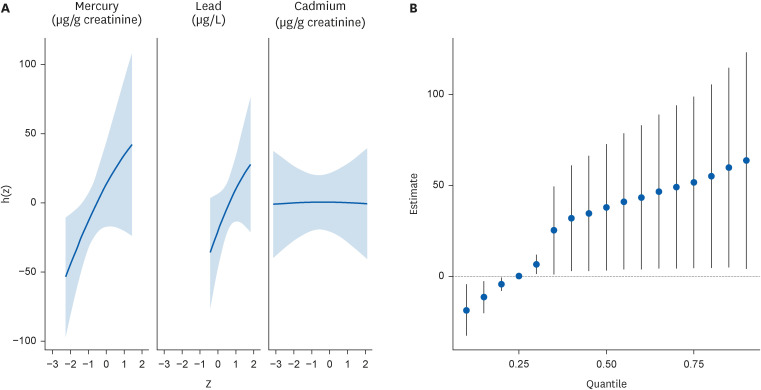
Dose response associations from the Bayesian kernel machine regression. (A) Univariate dose-response association of mercury, lead, and cadmium, while other variables are fixed at the median values. From the left, each graph indicates dose-response association of mercury, lead, and cadmium. Age and sex are adjusted. (B) Overall mixture effect from the Bayesian kernel machine regression analysis. Reference is 25th percentile, and 95% credible interval is presented. Age and sex are adjusted.
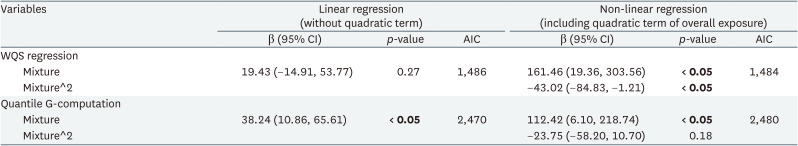
Table 4 shows the mixture effect of exposure to mercury, cadmium, and lead evaluated using the WQS regression and quantile G-computation analyses. Each method involved linear or non-linear regression models with quadratic terms, and AIC showed that the WQS regression was more adequate with a non-linear regression model, and the quantile G-computation was more adequate with a linear regression model. More adequate models for each analysis showed statistically significant association between heavy metal complex exposure and CRT. Fig. 4 shows results of the WQS and quantile G-computation analyses. Both analyses show positive, but non-linear, correlations between heavy metals and reaction time. Fig. 5 shows contribution weight of each heavy metal calculated by the WQS and quantile G-computation methods. In the WQS regression analysis, weights of lead, mercury, and cadmium were 0.51, 0.36, and 0.13, respectively. Whereas in the quantile G-computation analysis, weights of lead, mercury, and cadmium were 0.48, 0.52, and 0.00, respectively. Each log-transformed urinary heavy metal value showed positive weights with reaction time.
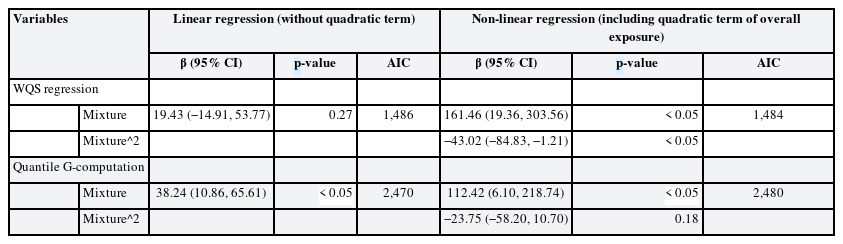
Mixture effect of mercury, cadmium, and lead calculated by the WQS regression and quantile G-computation models
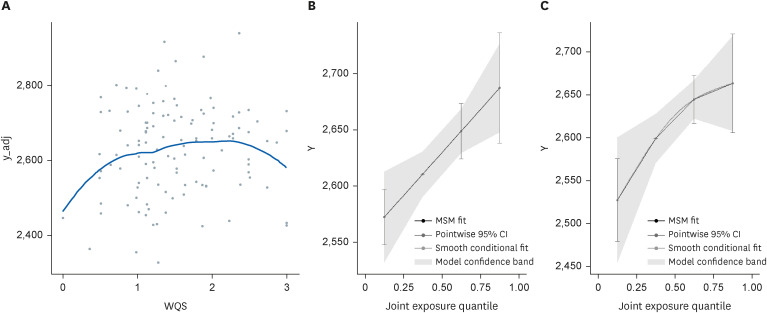
Visualization of WQS regression analysis and quantile G-computation analysis. (A) Visualization of the WQS regression analysis. X axis shows the WQS of the 3 heavy metals on the basis of quartile, and Y axis shows choice reaction time (ms). (B) Visualization of quantile the G-computation analysis; X axis shows joint exposure quartile of the 3 heavy metals, and Y axis shows choice reaction time (ms).
MSM: marginal structural model; CI: confidence interval; WQS: weighted quantile sum.
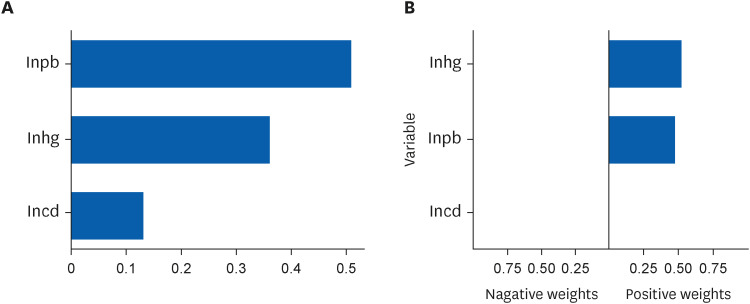
Contribution weight of mercury, lead, and cadmium in the weighted quantile sum regression and quantile G-computation analyses.
The results of statistical analysis with urinary lead levels adjusted with creatinine are shown in Supplementary Tables 4 and 5, and Supplementary Figs. 1 and 2.
DISCUSSION
The association between complex heavy metal exposure and neurobehavioral function was evaluated by studying the levels of mercury, lead, and cadmium in the urine and analyzing the CRT test results. Considering the complex exposure, lead and mercury were positively associated with reaction time in the CRT test. This result was consistently shown in all analysis methods; multiple OLS linear regression, BKMR, WQS, and quantile G-computation methods.
It is well known that heavy metals affect neurological function in various, and physiologic and histologic researches are well established. Mercury induces cognitive disability by disrupting the glutathione antioxidant system, thereby increasing oxidative stress.6 Lead crosses the blood-brain barrier through calcium transporters and interacts with Ca2+ binding sites, resulting in a decreased postsynaptic receptor activity.7 Cadmium disrupts neuronal activity by inhibiting the Na+/K+-ATPase, resulting in the dysregulation of synaptic neurotransmission.19 Recent studies have shown that exposure of the developing brain to lead, cadmium, and mercury results in impaired hippocampus-dependent function.20 With complex exposure, high concentration of mixture of chromium, cobalt, cadmium, and lead was associated with poor liver function.21 Co-exposure of multiple heavy metal is positively associated with renal function damage.22
Children are unlikely to be exposed to high concentrations of heavy metals. However, recent studies have shown that chronic exposure to small amounts of radiation can lead to neurological deficits in children. Children living within 1 km of an industrial area are more exposed to heavy metals and show significantly lower neurobehavioral performance than those living > 1 km from an industrial area.23 Mercury exposure is related to worse neurobehavioral development in 9-year-old children.4 Prenatal exposure to heavy metals, particularly to lead, is associated with an increased risk of autism.5 However, prior research showed that urinary mercury levels less than 5 μg/g creatinine did not change cognitive behavioral function in children aged 5–7 years24; although it was confined to amalgam, single-source exposure. Most studies have used clinical diseases or symptoms as indicators of nervous system effects, and only few studies have assessed whether the effects of heavy metal exposure on the nervous system exist at subclinical levels. In addition, despite the need for studies on the association between heavy metal complex exposure and neurobehavioral function, many studies have focused on individual heavy metal exposure, and complex exposure has seldom been considered.
In terms of complex exposure, the mixed effects of multiple heavy metals can be important factors.1325 Several statistical approaches have been proposed from this perspective. The OLS method is a classic and well-known method; however, it is not adequate for identifying mixture effects because of multicollinearity.26 Thus, the present study used the BKMR,27 WQS regression,16 and quantile G-computation analyses.17 Statistically significant associations between CRT and complex exposures to mercury and lead were consistently identified in the linear regression analysis using the OLS, WQS, and quantile G-computation analyses.
Difference between 25th and 75th percentiles of each urinary heavy metal in the present research was very low (mercury 0.4 μg/g creatinine; lead 1.4 μg/L; cadmium 1.0 μg/g creatinine); however, a statistically significant increase in CRT was observed in the neurobehavioral tests. This result suggests that the previously considered insignificant subclinical level of exposure can trigger functional defects at the behavioral level that can be detected using more sensitive tests. Therefore, the strict and systematic management of heavy metals is necessary.
The main objective of our study was to observe the neurological effects of exposure to heavy metals in humans, and we used urinary metals for the assessment of heavy metal exposure. The measurement of heavy metal concentration in urine is commonly used in monitoring children population due to its non-invasive and ease of specimen collection, and the fact that urine serves as a major excretion route during chronic exposure.28 To sensitively identify subclinical levels of neurological effects, we examined the reaction times of SDS and CRT and analyzed their correlation with exposure to heavy metals. The KCNT is a neurocognitive behavioral test based on the Swedish Performance Evaluation Test. Among the KCNT, the SDS and CRT tests examine the response speed to temporally unpredictable visual signs and response selection ability by evaluating the mean reaction time and number of errors.29 The CRT test is relatively easy and can be used for participants with low educational levels. The SDS test is relatively difficult and can reveal deficits in higher-order cognitive processes.30 Both tests are intuitive, easy, and doesn’t need high level of education, so these are suitable for elementary school student. In addition, both tests were conducted with elementary school students in prior research, making them a reasonable comparison group.3132
Notably, the reaction time of the SDS test showed no statistically significant association, whereas that of the CRT test did. This may be because the intellectual level of the participants was of the elementary-school level; therefore, the SDS test was difficult for them to comprehend. The CRT test was easy and intuitive; therefore, it is more optimal for children with varying intellectual levels.30 It is presumed that the CRT test would reflect the neurobehavioral functions of elementary school students more sensitively.
This study had several limitations. This was a cross-sectional study showing an association at a specific point in time with insufficient proof of causality. In addition, various potential confounders, such as socioeconomic status, individual and parental educational levels, and lifestyle were not considered. Many other heavy metals are known to affect the central nervous system; however, only mercury, lead, and cadmium were considered in this study. The levels of heavy metals measured in this study were higher than those measured in the general Korean and American population. The Korean National Environmental Health Survey showed that the arithmetic means of urinary mercury and cadmium levels in Korean elementary school students in 2020 were 0.353 μg/g creatinine and 0.171 μg/g creatinine, respectively.33 Mean and 95th percentile of urinary lead in American 6 to 11 years old children in 2014 were 1.62 μg/g creatinine and 1.2 μg/L, respectively.1 Overall, although we suggest median value instead of arithmetic means, the median values of urinary heavy metal levels in this study were higher than arithmetic mean in the Korean general elementary school students population, which is presumed to be attributable to the local environment and dietary habits.343536 Therefore, we cannot conclude that this study represented the overall condition of the entire population. Overall, heavy metal concentrations were higher than the general demographics, and further studies, including a follow-up and an extensive history check, are needed to confirm our results.
CONCLUSIONS
This study aimed to evaluate the association between heavy metal complex exposure and neurobehavioral function in children. Participants of the study underwent SDS, CRT test and urinary mercury, lead, and cadmium analyses. Partial correlation analysis showed no statistical association between individual heavy metals and reaction time. Regarding complex exposure, the following tests were performed: multiple OLS linear regression, BKMR, WQS, and quantile G-computation. The results of these analyses consistently showed a statistically significant association between complex exposure and CRT test reaction time, and this tendency was more pronounced in lead and mercury. These findings suggest that even at low concentrations, heavy metal complex exposure can affect neurobehavioral function. Thus, sensitive and strict management of childhood heavy metal exposure is required.
Notes
Funding: This research was supported by the Inha University Hospital's Environmental Health Center for Training Environmental Medicine Professionals funded by the Ministry of Environment, Republic of Korea (2022).
Competing interests: The authors declare that they have no competing interests.
Authors contributions:
Conceptualization: Kim MK.
Data curation: Baek KO, Park CY.
Formal analysis: Kim MK, Baek KO, Ye SH.
Funding acquisition: Sakong J, Park CY.
Investigation: Kim MK, Son SY.
Methodology: Park CY, Baek KO.
Software: Baek KO, Ye SH.
Validation: Park CY, Baek KO.
Visualization: Baek KO, Ye SH.
Writing - original draft: Kim MK.
Writing - review & editing: Kim MK, Son SY, Baek KO, Park CY, Sakong J.
Abbreviations
AIC
Akaike information criterion
BKMR
Bayesian kernel machine regression
BMI
body mass index
Cd
cadmium
CI
confidence interval
CRT
Choice Reaction Time
ICP-MS
inductively coupled plasma mass spectrometry
IRB
Institutional Review Board
KCNT
Korean Computerized Neurobehavior Test
Ln Cd
log-transformed urinary cadmium
Ln Hg
log-transformed urinary mercury
Ln Pb
log-transformed urinary lead
MSM
marginal structural model
OLS
ordinary least squares
Pb
lead
QC
quality control
ρ
correlation coefficient
SDS
symbol digit substitution
WQS
weighted quantile sum
Hg
mercury
References
SUPPLEMENTARY MATERIALS
Supplementary Table 1
General characteristics of participants for the symbol digit substitution reaction time analysis
Supplementary Table 2
Partial correlation analysis of SDS reaction time and heavy metals
Supplementary Table 3
Linear regression analysis of symbol digit substitution reaction time and heavy metals
Supplementary Table 4
Linear regression analysis of choice reaction time test reaction time and heavy metals
Supplementary Table 5
Mixture effect of mercury, cadmium and lead calculated by WQS regression and quantile G-computation model
Supplementary Fig. 1
Univariate dose-response association of mercury, lead and cadmium while other variables are fixed at median. From the left, each graph indicates dose-response association of mercury, lead and cadmium. Urinary lead concentration is adjusted to urinary creatinine. Age and sex were adjusted.
Supplementary Fig. 2
Overall mixture effect from Bayesian kernel machine regression analysis. Reference is 25 percentile, and 95% credible interval was presented. Urinary lead concentration is adjusted to urinary creatinine. Age and sex were adjusted.