Exposure to polycyclic aromatic hydrocarbons and serum total IgE in the Korean adults: the Third Korean National Environmental Health Survey (2015–2017)
Article information

Abstract
Background
Polycyclic aromatic hydrocarbons (PAHs) have become common pollutants with industrial development. Although the effect of exposure to PAHs on allergic disease in humans has been evaluated, evidence of an association is sparse. The association between PAH exposure and serum total immunoglobulin E (IgE) levels was evaluated in Korean adults.
Methods
In total, this study included 3,269 participants in the Third Korean National Environmental Health Survey (2015–2017). Four urinary PAH metabolites were used to assessed exposure to PAHs: 1-hydroxypyrene, 1-hydroxyphenanthrene, 2-naphthol, and 2-hydroxyfluorene. The analyses were performed on 3 cutoff levels (100 IU/mL, 114 IU/mL, and 150 IU/mL) set as the total IgE elevation. Prevalence of total IgE elevation by PAH exposure group and general characteristics (age, sex, BMI, smoking, alcohol drinking, and occupation) were analyzed using the Rao–Scott χ2 test. Multiple logistic regression analyses were conducted to calculate adjusted odds ratios (ORs) for total IgE elevation by PAH exposure groups.
Results
Total IgE elevation differed significantly by age, sex, smoking status, alcohol drinking status, and occupation. For 2-hydroxyfluorene, the fourth quartile showed a significant association with IgE elevation compared to the first quartile in the analyses of cutoff-level 100 IU/mL (OR: 1.372, 95% confidence interval [CI]: 1.007–1.869) and 114 IU/mL (OR: 1.643, 95% CI: 1.167–2.312). In the analysis of cutoff-level 150 IU/mL, the adjusted ORs of the third and fourth quartile of 2-hydroxyfluorene were significantly higher than the first quartile (3rd quartile: OR: 1.478, 95% CI: 1.034–2.113; 4th quartile: OR: 1.715, 95% CI: 1.161–2.534). However, there were no significant positive associations for the other metabolites.
Conclusions
This study implied that PAHs exposure is associated with total IgE elevation in Korean adults. More research is needed to confirm the effect of exposure to PAHs on serum IgE and allergic diseases.
BACKGROUND
Polycyclic aromatic hydrocarbons (PAHs) have become common pollutants which exist everywhere with industrial development.1 PAHs are a group of toxic chemicals consisted of several benzene rings.2 For example, naphthalene, fluorene, pyrene, benzo[a]pyrene and many other PAHs consist of PAHs complex. They are produced as a result of incomplete combustion of various organic material.3 Industrial operations, power generation, waste incineration, and residential heating are the major sources of PAHs.4 They are absorbed by inhaling diesel exhaust particles (DEPs), smoking cigarettes, and eating grilled foods.56 When PAHs are absorbed into the body, they are mainly metabolized by liver and kidney. The metabolites of PAHs are excreted through bile and urine, and their half-life in the body are within several hours.78
There are lots of studies about the effect of PAHs on various organ of human body. For example, occupational PAH exposure can increase serum liver enzyme levels.9 The fact that PAH exposure increases the risk of various cancers has been well known. PAHs exposure can induce lung cancer, skin cancer, and bladder cancer.1011 Exposure to PAHs is also associated with cardiovascular diseases like hypertension and heart attack.12 PAHs exposure is not only a problem for adults but also a problem for children. Prenatal exposure to PAHs can adversely affect fetal growth and children’s cognitive development.1314
The role of PAHs exposure on causing allergic diseases is relatively little known. They may induce allergic diseases such as allergic rhinitis, allergic dermatitis, and asthma.15 The prevalence of allergic diseases is higher among people living in polluted cities than in those living in rural areas.1617 In other case, Chinese government restricted the emission of air pollutants to improve air quality during 2008 Beijing Olympics, and outpatient visits for asthma decreased during that period.18 In that study, ambient concentrations of PM2.5 and O3 were associated with outpatient visits for asthma. PAHs are major components of PM2.5 which cause air pollution.19 In addition, there is a study which shows significant association between various pollutants including PM2.5 and allergic rhinitis.20 These studies suggest the possibility of association between PAHs and allergic disease. Also, a study showed that urinary PAH metabolites are significantly associated with allergic sensitization to several allergens in the US population.21
The prevalence of allergic diseases is increasing in South Korea,22 and the socioeconomic burden is considerable.2324 Because PAHs are ubiquitous in the environment, people can be exposed to them in their daily lives. Therefore, identifying the effect of PAHs exposure in allergic diseases can be significant. Though several studies have studied the effect of PAHs exposure on allergic disease in humans, the evidences are sparse. In particular, the studies on Korean adults are lacking. Therefore, further researches are needed to add evidences supporting the association between PAHs exposure and allergic diseases. Urinary PAH metabolites are widely used as a useful indicator to reflect exposure to PAHs.25 Immunoglobulin E (IgE), a marker of allergic reaction is a key component of the immune response to allergens, which is called type I hypersensitivity.26 In this study, we examined the association between PAH metabolites and serum total IgE elevation in Korean adults using the Third Korean National Environmental Health Survey (KoNEHS) data.
METHODS
Participants
National Institute of Environmental Research conducted the third KoNEHS from 2015 to 2017. Stratified sampling based on the 2015 national population and housing census was used in the survey. Face-to-face interviews were conducted with biological sampling. The participants comprised 3,787 individuals in 233 districts selected to be proportional to the population. Among the 3,787 subjects, 82 subjects with missing values were excluded. Finally, 3,269 subjects whose urinary creatinine concentration was within the reference range (0.3–3.0 g/L) were included in this analysis.
Total IgE
Serum total IgE was analyzed as follows. IgE levels were measured by competitive immunoassay using direct chemiluminescence (ADVIA Centaur®; Siemens, Munich, Germany). Serum was separated from whole blood by centrifugation at 3,500 rpm. The antigen-antibody reaction proceeded for 30 minutes at 37°C to incubate the specimen and alkaline phosphatase-conjugated antibodies on beads coated with an antibody specific for total IgE. Luminescent reaction of chemiluminescent substrate in the presence of alkaline phosphatase proceeded for 5 minutes. Luminescence was measured using a photometer and the sample concentration was calculated.
Elevated total IgE was defined as 3 cutoff levels (> 100 IU/mL, > 114 IU/mL, and > 150 IU/mL)2728 and subjects were classified into elevated- and non-elevated-IgE groups.
Exposure to PAHs
Four urinary PAH metabolites were used to assessed exposure to PAHs: 1-hydroxypyrene, 1-hydroxyphenanthrene, 2-naphthol, and 2-hydroxyfluorene. The urinary metabolites of PAHs were measured as follows. Random spot urine was sampled, frozen, and stored at −20°C. Urinary metabolites were hydrolyzed by β-glucuronidase/aryl sulfatase and derivatized with bistrimethylsilyltrifluoroacetamide, then analyzed using gas chromatography–mass spectrometry. The calibration curve by the standard addition method was used to calculate the concentration. The coefficient of determination (R2) was ≥ 0.995. The limits of detection (LODs) for each metabolite were as follows: 0.015 μg/L for 1-hydroxypyrene, 0.04 μg/L for 1-hydroxyphenanthrene, 0.05 μg/L for 2-naphthol, and 0.04 μg/L for 2-hydroxyfluorene. Concentrations below the LOD were substituted with a value of LOD divided by the square root of 2 for each metabolite.
Exposure groups for each PAH were categorized by quartile of urinary concentration of metabolites: “≤ 25th percentile,” “> 25th and ≤ 50th percentile,” “> 50th and ≤ 75th percentile,” and “> 75th percentile.” For urinary 1-hydroxyphenanthrene, exposure group was classified as “< LOD,” “≥ LOD and ≤ 50th percentile,” “> 50th and ≤ 75th percentile,” and “> 75th percentile” because 30.3% of urinary 1-hydroxyphenanthrene concentrations were below the LOD.
Urinary creatinine was separately included in the analyses as an independent variable to correct for the dilution of urine samples.29 Creatinine was analyzed by compensated rate-blanked Jaffe kinetic assay using the CREA_2 reagent (Siemens) and ADVIA 1800 (Siemens) instrument, and expressed in g/L.
Covariates
The following variables were included in the analyses: age, sex, body mass index (BMI), smoking, alcohol drinking, and occupation. Ages from 19 to over 70 years were grouped by 10-year intervals. BMI was categorized into 4 groups according to World Health Organization Asian BMI classification: underweight (< 18.5 kg/m2), normal (18.5–22.9 kg/m2), overweight (23–24.9 kg/m2), and obese (≥ 25 kg/m2). Smoking status was categorized as ‘current smoker,’ ‘ex-smoker,’ or ‘nonsmoker.’ Alcohol drinking status was categorized as ‘drinking’ or ‘non-drinking.’ Occupation was classified as white collar, blue collar, service and sales, agriculture and fishery, or full-time housekeeper. White-collar workers included manager, professional, and office worker. Blue-collar workers included technician, engineer, and laborer. Service and sales category included security-related service, health care service, transportation and leisure services, food service, and various types of sales.
Statistical analyses
In this study, the KoNEHS data was analyzed by applying strata, clusters, and sampling weights to address the stratified sampling design. The analyses were performed on 3 cutoff levels (> 100 IU/mL, > 114 IU/mL, and > 150 IU/mL) set as the total IgE elevation. Prevalence of total IgE elevation by PAH exposure group and general characteristics (age, sex, BMI, smoking, alcohol drinking, and occupation) were analyzed using the Rao–Scott χ2 test. Multiple logistic regression analyses adjusted for the general characteristics and urinary creatinine were performed to calculate adjusted odds ratios (ORs) for total IgE elevation by PAH exposure groups. Statistical analysis was performed using SPSS (version 25 for Windows; IBM, Armonk, NY, USA). The p < 0.05 was considered indicative of significance.
Ethics statement
Informed agreement to the use of data is obtained from all subjects in KoNEHS. The Institutional Review Board (IRB) of Inje University Haeundae Paik Hospital approved this study (IRB No. 2022-04-003).
RESULTS
Fig. 1 presents the distribution of the serum total IgE levels. IgE levels of 100 IU/mL, 114 IU/mL, and 150 IU/mL, the cutoff values for elevated IgE, correspond to about the 58.5th, 62.7th, and 70.3th percentile in the estimated percentiles of the total IgE level.
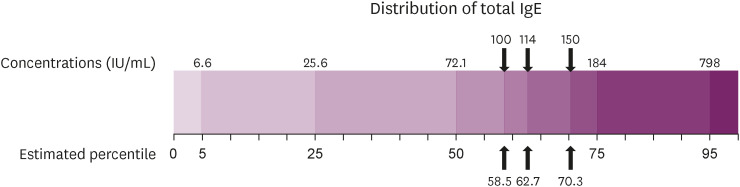
Estimated percentiles of serum total IgE level (IU/mL).
IgE: immunoglobulin E.
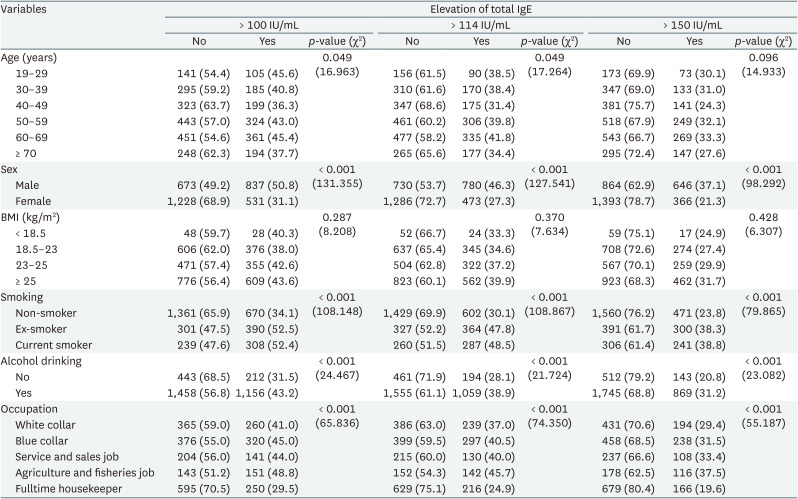
Table 1 shows elevated total IgE by demographic characteristics. Similar results were shown in all 3 cutoff values. IgE elevation differed significantly by age, sex, smoking status, alcohol drinking status, and occupation. The prevalence of elevated IgE levels did not differ by age group and was higher in male than in female. The prevalence of elevated IgE levels was higher in the current smoker and ex-smoker than in non-smoker, and higher in drinking group than in non-drinking group. Agricultural and fishery workers had the highest and full-time housekeepers the lowest prevalence of elevated IgE.
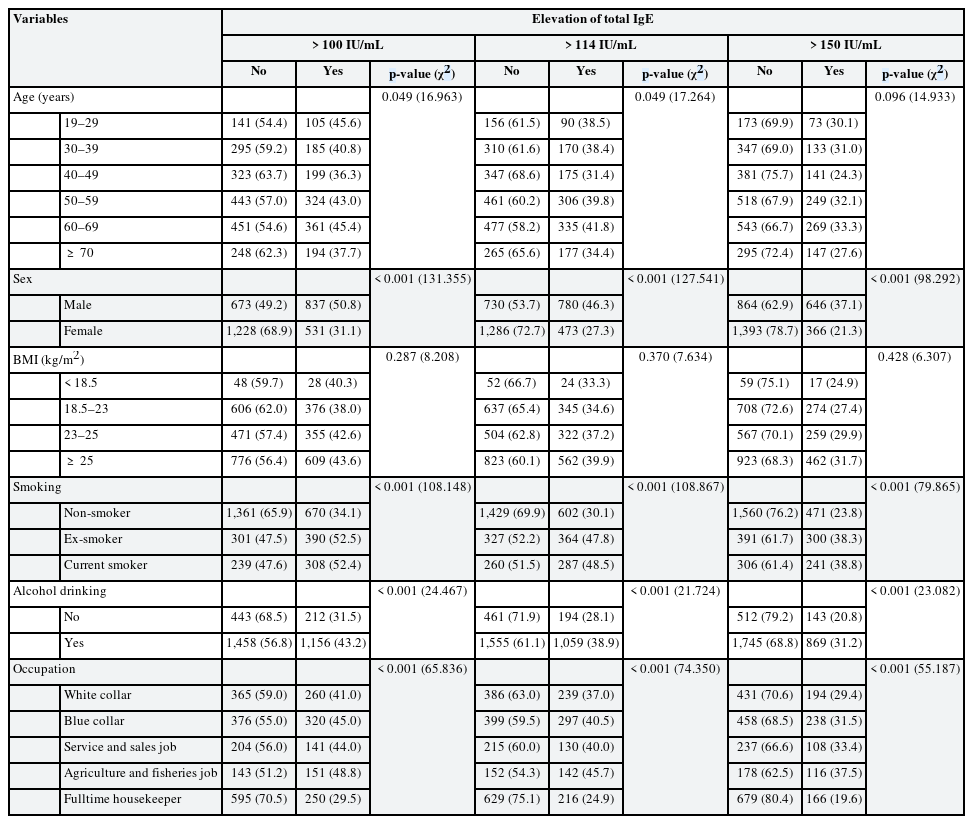
Elevation of total IgE according to general characteristics
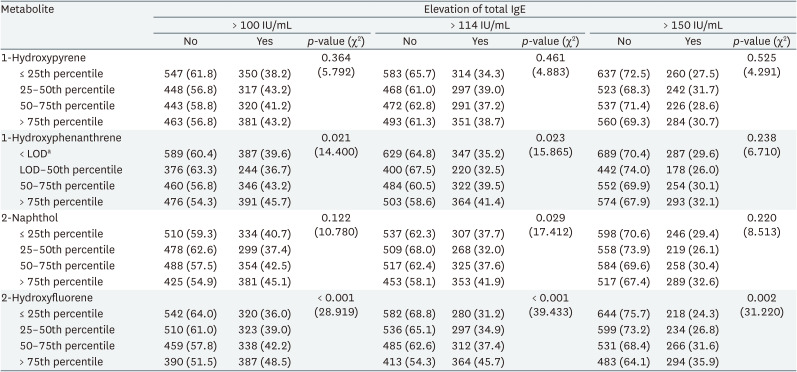
Table 2 shows total IgE elevation by quartile of urinary PAH metabolite concentration. In the analyses of cutoff-level 100 IU/mL, the elevation differed significantly by quartile of 1-hydroxyphenanthrene and 2-hydroxyfluorene. In the analysis using cutoff-level 114 IU/mL, the elevation differed significantly by quartile of 1-hydroxyphenanthrene, 2-naphthol, and 2-hydroxyfluorene. In the analysis using cutoff-level 150 IU/mL, the elevation differed significantly by quartile of 2-hydroxyfluorene.
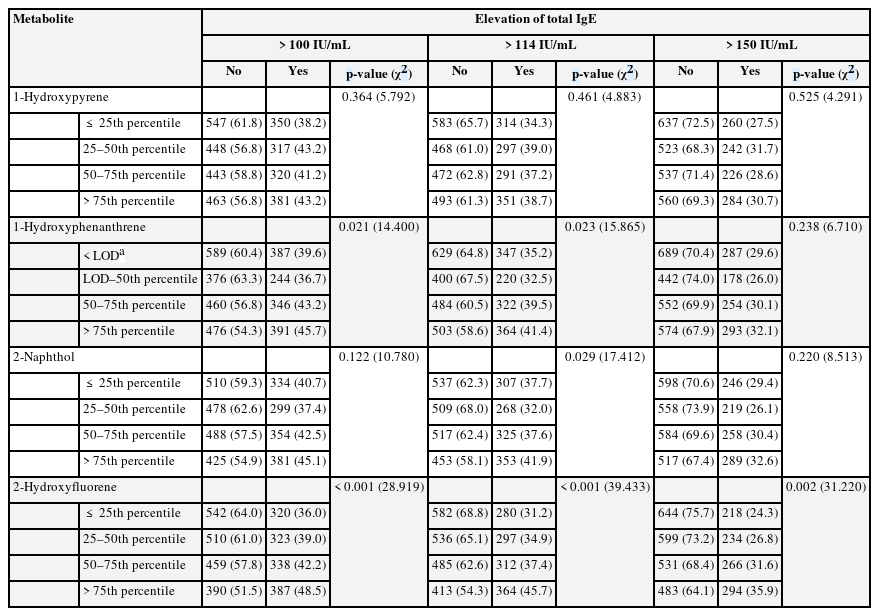
Elevation of total IgE according to urinary metabolites of polycyclic aromatic hydrocarbons
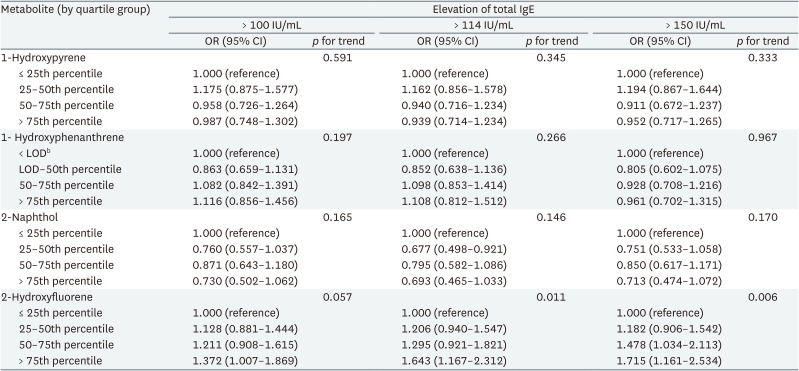
The association between each urinary PAH metabolite group and total IgE elevation was shown in Table 3. For 2-hydroxyfluorene, the fourth quartile showed a significant association with IgE elevation compared to the first quartile in the analyses of cutoff-level 100 IU/mL (OR: 1.372, 95% confidence interval [CI]: 1.007–1.869, p for trend 0.057) and 114 IU/mL (OR: 1.643, 95% CI: 1.167–2.312, p for trend 0.011). In the analysis of cutoff-level 150 IU/mL, the adjusted ORs of the third and fourth quartile of 2-hydroxyfluorene were significantly higher than the first quartile (3rd quartile: OR: 1.478, 95% CI: 1.034–2.113; 4th quartile: OR: 1.715, 95% CI: 1.161–2.534, p for trend 0.006). The OR of the second quartile of 2-naphthol was significantly lower than that of the first quartile in the analysis using cutoff-level 114 IU/mL (OR: 0.677, 95% CI: 0.498–0.921). The ORs of 2-hydroxyfluorene groups tended to increase according to PAH exposure level. However, there was no dose-response relationship between OR and 2-naphthol exposure. There were no significant associations for 1-hydroxypyrene and 1-hydroxyphenanthrene.
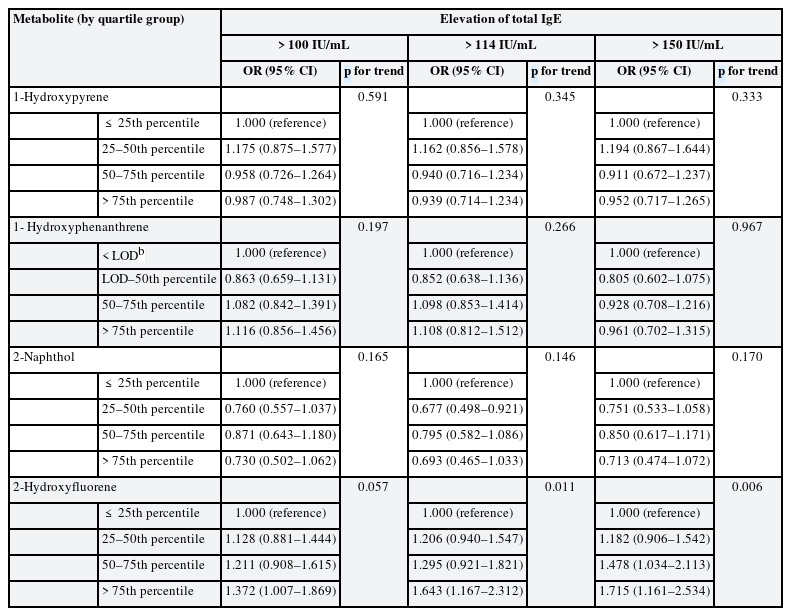
Multiple logistic regression analysis between urinary metabolites of polycyclic aromatic hydrocarbons and elevation of total IgEa
DISCUSSION
The associations between urinary metabolites of PAHs and serum total IgE elevation in the Korean adult population were examined in this study. In the analyses adjusted for the demographic factors, 2-hydroxyfluorene was positively associated with total IgE elevation. It suggests an evidence to the association between PAHs exposure and serum total IgE, one of major indicator of presence of allergic disease.
Several studies have found positive associations between exposure to PAHs and IgE levels. Studies on DEPs showed that PAHs induced production of IgE by affecting B-cell differentiation.30 In humans, nasal challenge with DEPs enhanced local nasal production of IgE, while applying ointment containing coal tar, which contains various PAHs, to the skin of psoriasis patients increased their serum total IgE levels.3132 Occupational exposure to PAHs also affects serum IgE levels. Non-atopic dockers exposed to DEPs in their work environment had higher serum IgE levels compared to non-exposed workers.33 In a birth cohort study in the United States, there were positive associations between several urinary PAH metabolites (1-hydroxyphenanthrene, 3-hydroxyphenanthrene, 2-hydroxyflourene, 3-hydroxyfluorene, and 2-hydroxynaphthalene) and anti-mouse IgE among children aged 5 years.34
PAHs can act as adjuvants for reactions to other allergens. The production of allergen-specific IgE was increased by simultaneous exposure to the allergen and DEPs. In animal studies of allergic reactions to ovalbumin, the IgE response was elevated by inoculation of allergen with DEPs compared to allergen alone.35 In humans, production of ragweed-specific IgE was significantly enhanced in nasal provocation with both DEP and ragweed compared to ragweed alone.36
Several mechanisms have been suggested for the enhanced production of IgE related to PAH exposure, but none completely explains the relationship. Absorbed PAHs are metabolized by aldo-keto reductases, resulting in excessive generation of reactive oxygen species (ROS)37; these ROS may affect the immune response and cause allergic reactions by enhancing IgE production.38 DEP-induced oxidative stress may contribute to airway inflammation, which can lead to asthma exacerbation.39 Alternatively, cytosolic aryl hydrocarbon receptor which induces the expression of several enzymes and regulates immune responses can be activated by PAHs binding.4041 Consequently, they may provoke allergic diseases such as allergic rhinitis or asthma.4243
There have been studies which evaluated the relationship between PAH exposure and allergic diseases, revealing significant associations of PAH exposure with allergic rhinitis, allergic dermatitis, and asthma. In a study in guinea pigs, long-term intranasal exposure to PAHs induced exacerbation of allergic rhinitis in response to Japanese cedar pollen.44 Urinary PAH metabolites levels have been positively associated with childhood asthma.45 In a study of asthma patients and healthy controls, there were positive associations between urinary PAHs metabolites (1-hydroxypyrene, 1-hydroxyphenanthrene, 2-hydroxyphenanthrene, 4-hydroxyphenanthrene, and 2-hydroxyfluorene) and the risk of asthma in adults.46
In this study, only 2-hydroxyfluorene showed a significant positive association with elevated total IgE. Although the PAH responsible differed among studies, exposure to several PAHs has been associated with serum IgE levels and allergic diseases. The different results may be attributed to PAHs having different mechanisms of action. However, study on individual PAHs is insufficient because exposure to PAHs mostly occurs not as an individual PAH but as a complex of PAHs.47 Further evaluation on the effect of exposure to individual PAHs is needed.
The prevalence of IgE elevation was also differed by age, sex, smoking status, alcohol drinking status, and occupation. Our study showed high prevalence of IgE elevation in agricultural and fishery workers, and blue-collar workers. In a study of Koreans, the PAHs exposure level was high in the same occupational groups.48 These suggest that IgE elevation in these occupational groups may be related to PAHs exposure by occupational groups. There are studies suggesting the possibility of obesity provoking allergic diseases.49 But the association between obesity and allergic diseases has not yet been fully clarified. In this study, the prevalence of IgE elevation was not significantly different by BMI groups.
There are several limitations in this study. First, an elevated total IgE level does not necessarily indicate allergic disease.50 But this analysis did not exclude various non-allergic diseases which increase total IgE due to the limitation of the KoNEHS data. Second, current history of allergic diseases should be considered in the analyses due to the effect of preexisting allergic disease on IgE elevation. But we could not exclude it because of the limitations of the KoNEHS data. Third, elevated levels of a specific IgE are more sensitive for detecting allergic disease. However, we did not evaluate the association between exposure to PAHs and specific IgE levels, because such data are not part of the KoNEHS. Fourth, causal relationship between exposure to PAHs and IgE elevation could not be examined due to cross-sectional observational characteristics of KoNEHS. Fifth, we were restricted to evaluating only 4 urinary metabolites of PAHs. Although there are many kinds of PAH metabolites, other urinary PAH metabolites were not included in the KoNEHS data.
Despite several limitations, the result of this study provides evidence supporting the association between PAHs exposure and IgE elevation. More researches which supplement the limitations of this study are needed to confirm the effect of exposure to PAHs on serum IgE and allergic diseases.
CONCLUSIONS
This study implies that exposure to PAHs is associated with total IgE elevation in Korean adult population. PAH exposure can induce allergic diseases such as rhinitis, asthma, and allergic dermatitis. Proper preventive measures to PAHs exposure are needed because there are many cases of occupational exposure as well as exposure in daily life through diesel-automobile fumes, smoking, diet, and so on.
Acknowledgements
This study used data from the Third Korean National Environmental Health Survey (2015–2017), which was conducted by National Institute of Environmental Research. The Authors gratefully acknowledge their effort.
Notes
Competing interests: The authors declare that they have no competing interests.
Authors contributions:
Conceptualization: Ryu JY.
Data curation: Jo JH.
Formal analysis: Jo JH, Ryu JY.
Investigation: Jo JH, Ryu JY.
Methodology: Kim DH.
Writing - original draft: Jo JH, Ryu JY.
Writing - review & editing: Ryu JY, Kim DH.
Abbreviations
BMI
body mass index
CI
confidence interval
DEP
diesel exhaust particle
IgE
immunoglobulin E
KoNEHS
Korean National Environmental Health Survey
LOD
limit of detection
OR
odds ratio
PAH
polycyclic aromatic hydrocarbon
ROS
reactive oxygen species