Association between insomnia and absenteeism or presenteeism among Korean employees
Article information

Abstract
Background
In Korea, few studies clarify insomnia and its association and absenteeism or presenteeism. Therefore, this study aims to examine the association between insomnia and absenteeism/presenteeism using the sixth Korean Working Conditions Survey.
Methods
Insomnia was evaluated by the Minimal Insomnia Symptoms Scale (MISS). Absenteeism and presenteeism were assessed by asking if the employee had experienced absence or working despite being ill for the prior 12 months at the point of the survey. Multiple logistic analyses were conducted to explore insomnia and its association with absenteeism and presenteeism.
Results
The odds ratios of insomnia for absenteeism and presenteeism were 3.48 (95% confidence interval [CI]: 2.76–4.39) and 3.68 (95% CI: 3.18–4.26) in the fully adjusted model. As the MISS scores increased, absenteeism and presenteeism showed the increasing trend that odd ratios increased accordingly from the first to the fourth quartile.
Conclusions
This study observed that insomnia was related to both absenteeism and presenteeism among Korean employees.
BACKGROUND
When workers feel sick, they have to decide whether they will try to make it to their jobs or become absent from the workplace for recovery. Regarding definition, the term absenteeism refers to “taking a sick leave,” while presenteeism refers to “attending work when ill,” and both are related to worker’s health status.123 Absenteeism has been relatively extensively researched,4 and this is mostly because it creates huge costs for companies. Nonetheless, presenteeism has grasped the attention of the scientific community in a similar fashion to absenteeism in recent years. While absenteeism is described to produce costs for companies, presenteeism may delay the delivery of proper treatment for the illness and even exacerbate it, hindering the worker’s ability to stay at work in the long term.56
Sleep is a vital component of human life and is related to regulating brain activities, metabolism, appetite, immunity, hormones, the cardiovascular system, and systemic physiology.7 Meanwhile, insomnia is characterized by several features: difficulty in initiating sleep; difficulty in maintaining sleep; non-restorative sleep.89 Insomnia has been shown to associate with various physical health problems, including exhaustion and energy depletion,10 obesity,11 diabetes,12 increased cardiovascular disease,13 mortality,14 and mental health problems.1516
Previous research has reported the association between insomnia and absenteeism/presenteeism internationally. A large-scale cross-sectional study using representative data in US reported that respondents with insomnia experienced significant work productivity loss with absenteeism, presenteeism and overall work productivity loss.17 In addition, countries such as Canada and France have reported that insomnia is associated with absenteeism or presenteeism.1819
However, there have been no large-scale studies in Korea to clarify insomnia and its association with absenteeism or presenteeism using representative data from the general population. Moreover, although absenteeism and presenteeism are opposite concepts, both may be induced by insomnia, there were no prior studies comparing whether insomnia has more influence on absenteeism or presenteeism in Korea. Therefore, this study aimed to examine insomnia and its association with absenteeism and presenteeism using the national representative data (the sixth Korean Working Conditions Survey [KWCS]).
METHODS
Study participants
This study used public data (the sixth KWCS) carried out under the initiative of Korea Occupational Safety and Health Agency in 17 cities and metropolitan areas in Korea between October 2020 and January 2021. The survey had a total of 50,538 respondents, but only those employees over the age of 20 (n = 32,916) were analyzed in the current study. This study excluded self-employed workers (n = 15,868), non-paid familial workers (n = 1,601) and employees below the age of 20 (n = 153) from the analysis.
Study variables
Absenteeism and presenteeism
Absenteeism was evaluated using the following question: “How many days have you been absent from your job in the past 12 months due to health problems (or since starting your main paid job)?” If the answer was “1 or more days,” it was considered that the person engaged in absenteeism. However, it was not considered absenteeism when the answer was “0 days.”
Presenteeism was evaluated using the following question “Have you worked despite being ill in the last 12 months (or since starting your main paid job)?” Responses to this question were categorized as “yes,” “no, but I was sick,” and “I was not sick.” If the answer was “yes,” it was considered as presenteeism, but the remaining answers were not considered to be presenteeism.
Insomnia
Insomnia was assessed using the Minimal Insomnia Symptoms Scale (MISS). The MISS is a screening tool for measuring insomnia in persons aged 20–64 years, and it comprises (3 components: i) difficulty in initiating sleep; ii) difficulty in maintaining sleep; iii) non-restorative sleep.20 According to the MISS scoring method, each subcomponent of insomnia has a score of 0–4 depending on the participants’ response; 0 “never,” 1 “less often,” 2 “several times a month,” 3 “several times a week,” and 4 “daily.” Each item was considered as having no symptoms from 0–2 points, and points 3 and 4 were considered as having symptoms. Total scores are calculated by summing up the scores for each subcomponent and range from 0–12 points, with a score of ≥ 6 points being considered as insomnia, while a score of < 6 points being considered as normal sleep.20
The MISS score was categorized into quartiles considering the entire investigated group (first quartile: 0 point; second quartile: 1–2 points; third quartile: 3 points; and fourth quartile: 4–12 points) to assess the trends of MISS scores with absenteeism and with presenteeism.
Covariates
This study assessed the sociodemographic characteristics of participants. Age, sex, educational attainment level, monthly income, occupation, employment status, weekly working hours, shift work, and self-rated health were assessed as the control variables.
Age was categorized into the following groups: “20–39 years,” “40–49 years,” “50–59 years,” and “60 years or older.” Educational attainment level was categorized as “middle school graduates or lower,” “high school graduates,” and “college graduates or higher.” Monthly income was divided into 4 quartiles based on average monthly income: “lowest,” “low middle,” “high middle,” and “highest.” The occupation was divided into “professional and managerial,” “clerical,” “sales and service,” and “manual.” Employment status was classified into “regular,” “temporary,” and “daily.” Weekly working hours were divided into “1–34 hours,” “35–40 hours,” “41–52 hours,” “53–60 hours,” and “≥ 61 hours.” Shift work was classified into a “yes” or “no” group based on the shift working status. Self-rated health status was determined by asking participants the following question: “How is your overall health?”. Responses of “very good" or “good” were considered as “good self-rated health,” whereas “fair”, “poor” or “very bad” responses were considered as “bad self-rated health.”
Statistical analysis
Data from 38,240 (the survey weighted sample size) employees were included in the analyses. Numbers and percentages were used to describe sociodemographic variables and examine the association of insomnia with absenteeism, presenteeism, MISS scores, and insomnia symptoms. A multiple logistic analysis was utilized to investigate the association between insomnia and absenteeism/presenteeism, for which the odds ratio (OR) and 95% confidence intervals (CIs) were provided. All statistical analyses were carried out using the STATA, version 17.0 (Stata Corp., College Station, TX, USA).
Ethics statement
The study data from the KWCS is opened to the public and need for informed consent and detailed study protocol review of the institutional review board was waived by the Dong-A Institutional Review Board (2-1040709-AB-N-01-202205-HR-029-02).
RESULTS
Sociodemographic characteristics of the participants
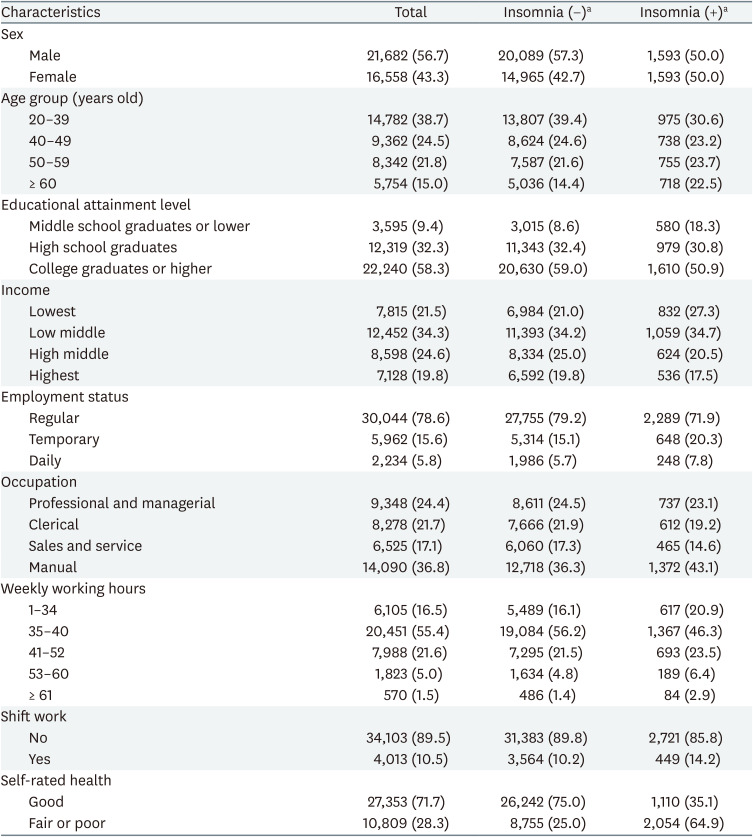
The participants’ baseline sociodemographic characteristics are shown in Table 1. Younger participants were more vulnerable to insomnia compared with their older counterparts. Moreover, insomnia was also relatively prevalent among those with a higher level of education, lower income, and regular employment status. Manual workers were more likely to suffer from insomnia (43.1%). Furthermore, the participants with bad self-rated health at work showed higher percentages for insomnia compared with those with good self-rated health (64.9% vs. 35.1%, respectively).
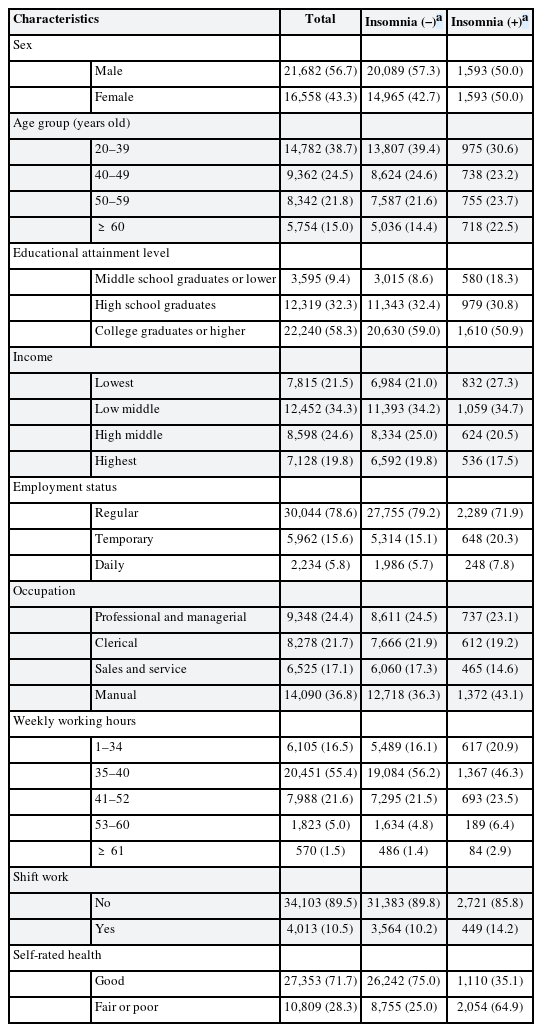
Characteristics of the study population by the presence of insomnia
The association of insomnia with absenteeism or presenteeism
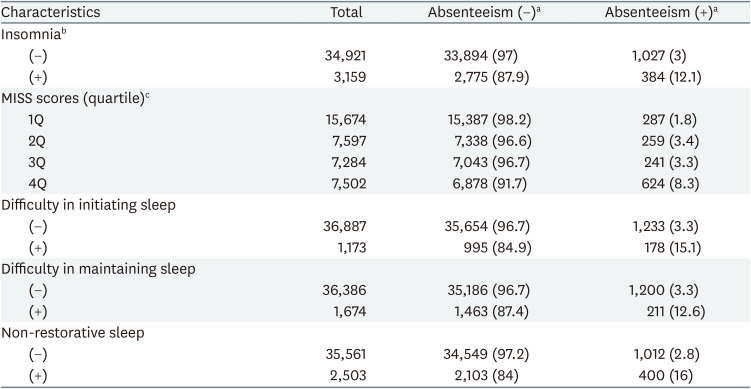
Table 2 shows the relationship between insomnia and absenteeism. Absenteeism was more prevalent in employees with insomnia compared with those without insomnia (12.1% vs. 3%, respectively). As the MISS scores increased, the prevalence of absenteeism also increased accordingly. Moreover, all components of insomnia symptoms in the MISS were associated with absenteeism.
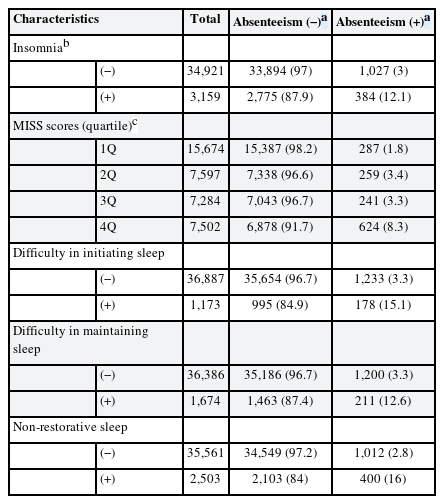
The relationship between insomnia, its components of symptoms and absenteeism
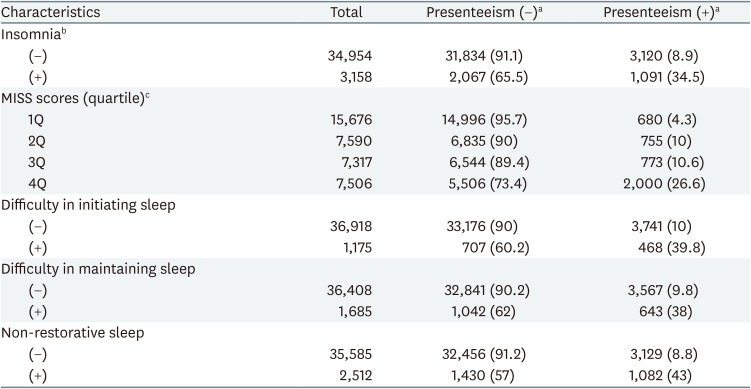
Table 3 presents the association between insomnia and presenteeism. Similar to Table 2, “insomnia” and a “high MISS score” were associated with presenteeism. Moreover, all components of insomnia symptoms showed similar tendencies (39.8% than 10% in “difficulty in initiating sleep,” 38% than 9.8% in “difficulty in maintaining sleep,” and 43% than 8.8% in the subgroup “non-restorative sleep,” respectively).
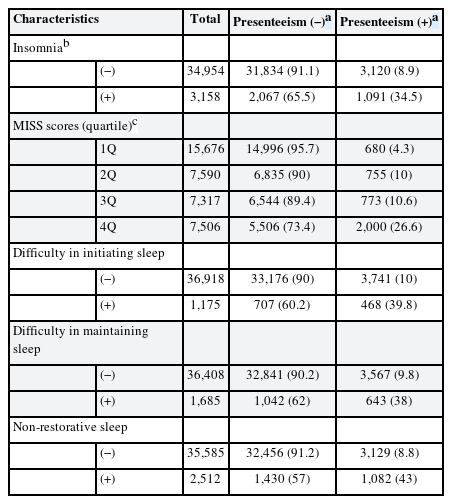
The relationship between insomnia, its components of symptoms and presenteeism
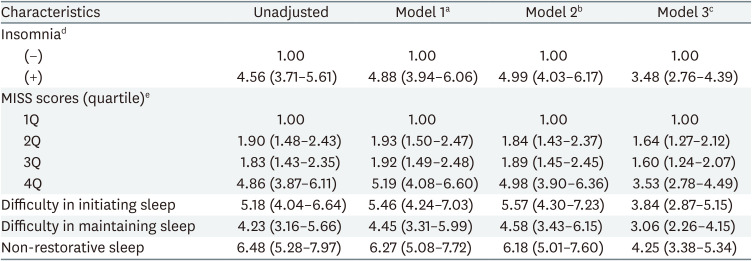
In Table 4, the employees with insomnia were more likely to engage in absenteeism compared with those without insomnia (OR: 4.56; 95% CI: 3.71–5.61). Moreover, employees with high MISS scores (fourth quartile, i.e., MISS scores between 4–12 points) showed markedly increased ORs. For components of insomnia symptoms, the ORs were found to be 5.18 (95% CI: 4.04–6.64) for “difficulty in initiating sleep,” 4.23 (95% CI: 3.16–5.66) for “difficulty in maintaining sleep,” and 6.48 (95% CI: 5.28–7.97) for “non-restorative sleep.”
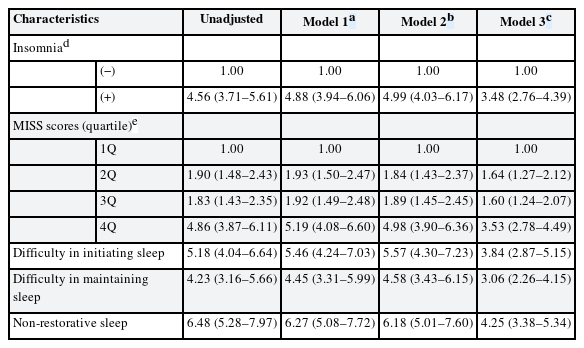
Association between insomnia and absenteeism by logistic regression analysis
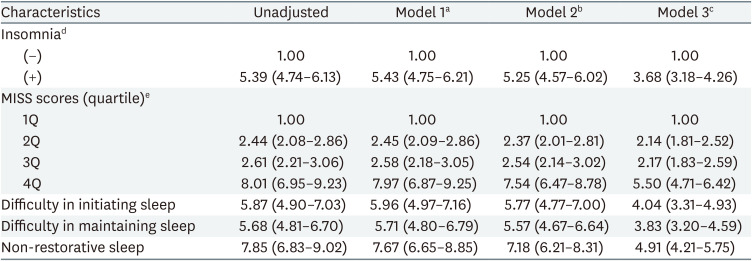
The results depicted in Table 5 also show that employees with insomnia and its components tended to engage in presenteeism. The OR for presenteeism among those with insomnia was 5.39 (95% CI: 4.74–6.13). Furthermore, the ORs for each MISS score quartile were 2.44 (95% CI: 2.08–2.86) for the second quartile, 2.61 (95% CI: 2.21–3.06) for the third quartile, and 8.01 (95% CI: 6.95–9.23) for the fourth quartile. The ORs for components of insomnia symptoms were 5.87 (95% CI: 4.90–7.03) for “difficulty in initiating sleep,” 5.68 (95% CI: 4.81–6.70) for “difficulty in maintaining sleep,” and 7.85 (95% CI: 6.83–9.02) for “non-restorative sleep,” respectively.
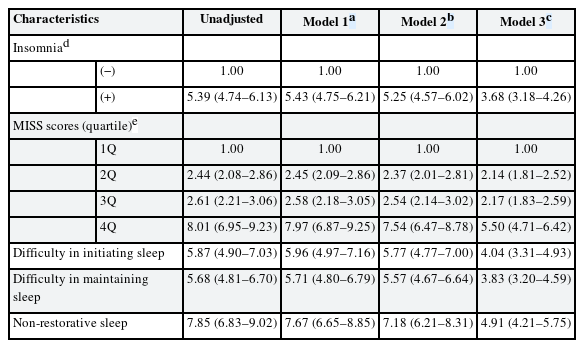
Association between insomnia and presenteeism by logistic regression analysis
DISCUSSION
This study found that employees with insomnia were more vulnerable to absenteeism and presenteeism than those without insomnia. Moreover, the odd ratios of the MISS score for absenteeism and presenteeism were shown gradually increase from the first to the fourth quartiles. Regarding the components of insomnia symptoms explored in the MISS, all were associated with both absenteeism and presenteeism: “non-restorative sleep” showed the highest OR in both absenteeism (OR: 4.25; 95% CI: 3.38–5.34) and presenteeism (OR: 4.91; 95% CI: 4.21–5.75) when adjusted in model 3. Some studies have shown that non-restorative sleep can evoke symptoms during the daytime, including physical fatigue and irritable mood, which may be associated with decreased productivity as it is expressed through either absenteeism or presenteeism.2122 These studies and our results suggest that non-restorative sleep is more important for absenteeism and presenteeism than the other 2 components of insomnia symptoms that were explored.
In all parts of insomnia and its components, the prevalence and overall ORs of presenteeism were higher than those of absenteeism. The OR of insomnia for presenteeism (OR: 3.68; 95% CI: 3.18–4.26) was higher than that for absenteeism (OR: 3.48; 95% CI: 2.76–4.39) when adjusted in model 3, showing that the strength of the association was stronger in the first. Nonetheless, the ORs decreased in the adjusted model including self-rated health, showing that health problems due to insomnia were related to absenteeism and presenteeism. This result may imply that bad self-rated health can be a mediator in the associations of insomnia with absenteeism or presenteeism. In other words, insomnia can lead to bad health and bad health can influence absenteeism or presenteeism.
The findings of this study show that insomnia is associated with both absenteeism and presenteeism. It is consistent with previous studies. A large-scale study of 19,711 adults in US showed the respondents with insomnia experienced significant work productivity loss with 10.7% work time missed (absenteeism), 29.2% productivity impairment at work (presenteeism), and 24.2% overall work impairment (work productivity loss),17 and another large-scale cross-sectional study in US reported that out of the total lost work performance of 20.3%, absenteeism accounted for 7.1% and presenteeism accounted for 13.2% in insomnia group.23 In addition, research conducted in Canada (prevalence of absenteeism: 17.1% in the good sleepers group, 25% in the insomnia group; OR: 1.74, 95% CI: 1.03–2.94; prevalence of presenteeism: 12.3% in the good sleepers group, 40.6% in the insomnia group; OR: 4.58, 95% CI: 3.12–7.37) and France (2-year period cohort study; The percentage of employees with at least one work absence were 50% and 34% for insomniacs and good sleepers, respectively) also indicated that insomnia contributes to absenteeism and decreased productivity (presenteeism).1819 Supporting these results, many studies show that absenteeism and presenteeism can reflect individual mental or physical health statuses, including bad self-rated health,24 depression,25 and cardiovascular disease.5
The findings of the current research in Korea and previous studies in other countries suggest that the health effects of insomnia can be an important area of research. It also suggests that further prospective studies are required. Moreover, intervention programs for workers’ sleep health may reduce absenteeism or presenteeism.26 Improving sleep health can enhance workforce productivity and reduce various medical and pharmaceutical expenses related to disabilities or diseases.2728
This study has several strengths. First, by utilizing nationally representative data, this study adds to the current information base on the relationship between insomnia and absenteeism/presenteeism. In Korea, there was no large-scale study that used validated questionnaire measures to assess insomnia. Second, we investigated insomnia using MISS, a short but validated questionnaire. Third, the ORs for absenteeism and presenteeism increased as the MISS score increased. Last, for each component of insomnia symptoms, workers with each insomnia symptom had greater ORs of absenteeism and presenteeism than workers without insomnia symptom.
This study has several limitations. Firstly, the cross-sectional nature of the current study does not allow for establishing causal relationships between insomnia and absenteeism or presenteeism. Secondly, other possible confounders such as alcohol, smoking, and other chronic diseases were not investigated in the KWCS and thus were not sufficiently adjusted in this study. Thirdly, the estimation of insomnia, absenteeism and presenteeism was self-reported, which may be related to information bias.
CONCLUSIONS
This study observed that insomnia was linked to both absenteeism and presenteeism. Moreover, the results of this study may imply the requirement for more research on the sleep health of workers and the development of effective intervention programs for their sleep health.
Acknowledgements
This study was supported by the National Research Fund of Korea (NRF-2021R1C1C1007796).
The authors appreciate the Occupational Safety and Health Research Institute and the Korea Occupational Safety and Health Agency for providing us with the data from the sixth Korean Working Conditions Survey.
Notes
Competing interests: The authors declare that they have no competing interests.
Authors contributions:
Conceptualization: Hwang J, Cho SS.
Formal analysis: Cho SS, Hwang J.
Methodology: Hwang J, Cho SS.
Writing - original draft: Hwang J.
Writing - review & editing: Hwang J, Cho SS, Kim JI.
Abbreviations
CI
confidence interval
KWCS
Korean Working Conditions Survey
MISS
Minimal Insomnia Symptoms Scale
OR
odds ratio