A proposal of spirometry reference equations for Korean workers
Article information

Abstract
Background
Although spirometry results can be interpreted differently depending on the reference equation used, there are no established criteria for selecting reference equations as part of the special health examinations for Korean workers. Thus, it is essential to examine the current use of reference equations in Korea, quantify their impact on result interpretation, and propose reference equations suitable for Korean workers, while also considering the environmental conditions of special health examination facilities.
Methods
The 213,640 results from the special health examination database were analyzed to identify changes in the ratio of measured values to reference values of lung capacity in Korean workers with changes in age or height, and changes in the agreement of interpretations with the reference equation used. Data from 238 organizations that participated in the 2018–2019 quality control assessment by the Korea Occupational Safety and Health Agency were used to identify the spirometer model and reference equations used in each special health examination facility.
Results
Korean special health examination facilities used six reference equations, and the rate of normal or abnormal ventilatory diagnoses varied with the reference equation used. The prediction curve of the Global Lung Function Initiative 2012-Northeast Asian (GLI2012) equation most resembled that of the normal group, but the spirometry model most commonly used by examination facilities was not compliant with the GLI2012 equation. With a scaling factor of 0.95 applied to the Dr. Choi equation, the agreement with the GLI2012 equation was > 0.81 for men and women.
Conclusions
We propose the GLI2012 equation as reference equation for spirometry in Korean workers. The GLI2012 equation exhibited the most suitable prediction curve against the normal lung function group. For devices that cannot use the GLI2012 equation, we recommend applying a scaling factor of 0.95 to the Dr. Choi equation.
BACKGROUND
The purpose of spirometry in special health examinations is to prevent respiratory diseases in workers handling hazardous substances. Respiratory functional abnormalities must be determined through accurate spirometry and interpretation of results. According to the 2018 Workers’ Health Examination report, 2,147,824 workers underwent a special health examination in 2018 alone,1 and there are 868,149 workers with spirometry records in the special health examination database.
As spirometry results can be interpreted differently depending on the reference values, it is important to standardize them by choosing an appropriate reference equation for the individuals being tested.2 Reference values vary according to race, even for the same age, height, and sex, and racial differences reportedly contribute 10% to spirometry results.3
The most well-known reference equation developed for the Korean population is the Dr. Choi equation.4 The Korean Academy of Tuberculosis and Respiratory Disease has recommended that the Dr. Choi equation be used as a reference equation for spirometry in Koreans. However, it has been reported that the National Health and Nutrition Examination Survey III (NHANES III) equation for Caucasians was more appropriate for the Korean population than the Dr. Choi equation.5 While reference equations must be chosen prudently for tests that require consistency, such as those for workers’ health examinations, there is no official report on the reference equations used by special health examination facilities. Moreover, the selection criteria for reference equations are lacking even in the guidelines used for workers’ health examinations, namely the Guidelines for Workers’ Health Examination6 and the Korea Occupational Safety and Health Agency (KOSHA) guide.7
There have been continued attempts to develop the most appropriate reference equations for the Korean population. Previous studies489 developed spirometry reference equations using the Korea National Health and Nutrition Examination Survey (KNHANES) data, while Myong et al.10 developed reference equations using the Workers’ Health Examination data.
Non-Korean researchers have also developed reference equations using the data on the Korean population. The Global Lung Function Initiative 2012-Northeast Asian (GLI2012) equation developed by Quanjer et al.,11 a task force team of the European Respiratory Society (ERS), is a prime example.
The American College of Occupational and Environmental Medicine (ACOEM) and US Occupational Safety and Health Administration (OSHA) recommends the use of the NHANES III reference equation developed in 1999 for a consistent interpretation of spirometry results for US workers. If devices without NHANES III reference equation installed are used, examiners are instructed to use a conversion program provided on the website, and a scaling factor has been recommended for Asians not included in the reference equation.1213
Currently, in Korea, there are no established guidelines for the standardization of spirometry result interpretations for workers, as provided by the ACOEM and OSHA, and relevant research is lacking. Thus, it is important to propose measures to standardize the interpretation of spirometry results such that workers’ respiratory disorders can be consistently assessed. To this end, the first step is to choose the appropriate reference equation. In this context, this study aims to examine the current uses of reference equations in all special health examination facilities in Korea, quantify their impact on result interpretation, and propose reference equations suitable for Korean workers, while also considering the environmental conditions of special health examination facilities.
METHODS
This study is a follow-up to the 2019 study “Current status of and measures to standardize spirometry findings in special health examinations” conducted by KOSHA,14 and was thus exempted from review by the Institutional Review Board at Inje University (approval No. INJE 2019-12-016).
Study subjects
Spirometry test results submitted to the KOSHA by special health examination facilities in 2018, per Article 209 (reporting of health examination results) of the Enforcement Decree of the Occupational Safety and Health Act,15 and spirometry quality control data collected in 2018 and 2019, per Article 135 (Special health examination facilities) of the Occupational Safety and Health Act16 were used.
Subjects’ birth date, height, weight, sex, forced vital capacity (FVC), FVC%, forced expiratory volume in 1 second (FEV1), FEV1%, spirometry interpretation, and testing date were obtained from the spirometry data in the special health examination results to examine the changes in the interpretation of the results with use of different reference equations.
Among the 868,149 people with spirometry records in 2018, 96,057 non-Korean and 320,284 Korean subjects with missing or major incorrect results (FVC, FVC%, FEV1, FEV1%), 197,545 missing or incorrect physical information (age, sex, height, weight), and 40,623 outliers were excluded. FEV1 greater than FVC was considered an error, and FVC% or FEV% exceeding 130% was considered an outlier (Fig. 1).
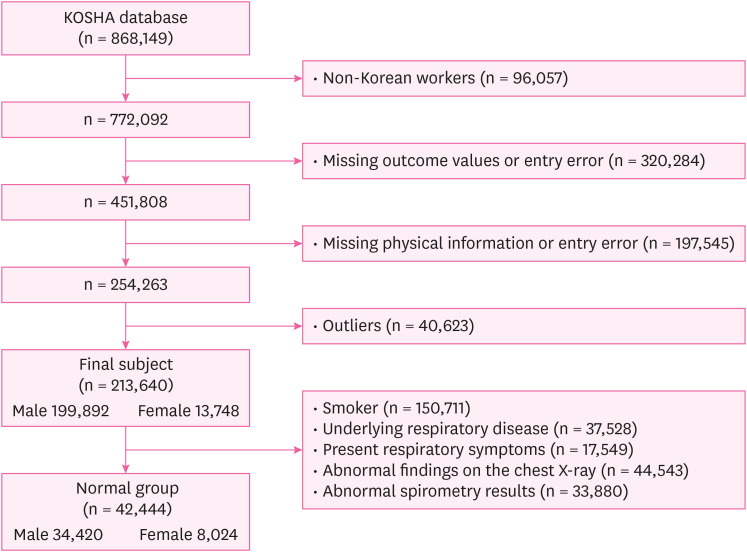
Sampling process.
KOSHA: Korea Occupational Safety and Health Agency.
To check whether the prediction curve reflects the change in lung capacity with the height or age of workers, FVC and FEV1 distributions of workers with normal lung capacities were compared with the prediction curve to which the average height or age was applied. For the “normal group” to confirm the spirometry distribution of workers with normal spirometry, Jo et al.’s method9 was applied mutatis mutandis. Among the study subjects, those who have: smoked all their lives (n = 150,711), underlying respiratory disease (n = 37,528), present respiratory symptoms (n = 17,549), abnormal findings on the chest X-ray (n = 44,543), and abnormal spirometry results (n = 33,880) were excluded.
The spirometry quality control data was obtained from 238 special health examination facilities, and we reviewed five randomly chosen cases of spirometry data from each facility to examine the spirometer model and reference equations used.
The spirometry data in the special health examination results were provided by the KOSHA database manager with all personally identifiable information (e.g., resident registration number, name) removed, and the spirometry results for quality control were reviewed after removal of personally identifiable information (e.g., name).
Selection of the prediction equations to be analyzed
Among the reference equations used by special health examination facilities, those that can be applied to Koreans and those developed for non-Korean populations and used by the greatest number of facilities were chosen as “major reference equations” for analysis.
Data analysis
In order to confirm the change in the interpretation of the spirometry results with reference equation, the ventilatory disorder rate determined by each health examination institution was compared with the ventilatory disorder rate determined after applying the “major reference equations”. Per the global chronic obstructive lung disease guidelines, an FEV1/FVC ratio < 0.7 was defined as an obstructive ventilatory disorder,17 and FVC% < 80% was defined as a restrictive ventilatory disorder. The presence of both obstructive and restrictive ventilatory disorders was defined as a mixed ventilatory disorder.
Participants’ characteristics and mean and distributions of each measurement value were analyzed with descriptive statistics and frequency analysis. Spirometry findings for ventilatory disorders according to the type of reference equations used were compared with chi-square tests. The diagnostic agreement between reference equations and scaled reference equation according to each independent factor was analyzed using the Kappa test (Kappa-value [κ], 95% confidence interval). Data were analyzed using the IBM SPSS Statistics 28.0 for Windows (IBM Co., Armonk, NY, USA), and statistical significance was set to < 0.05.
RESULTS
Subjects’ general characteristics
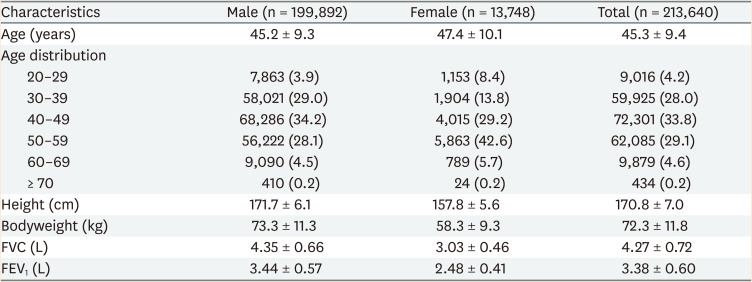
Of 213,640 subjects, 93.6% were male. The mean age was 45.2 and 47.2 years for men and women, respectively. 90.9% of the subjects were aged 30–59 years. The mean height was 171.7 cm in men and 157.8 cm in women, and the mean weights were 73.3 kg and 58.3 kg, respectively (Table 1).
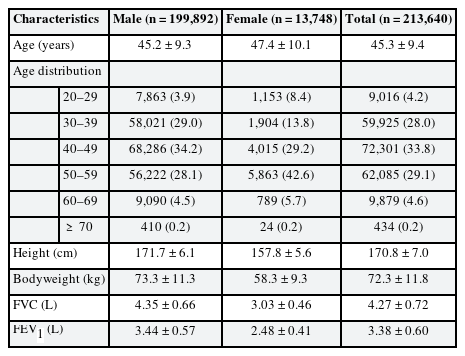
Subjects’ general characteristics
Currently used reference equations and changes in the rate of ventilatory disorders with the reference equation used
Of 238 facilities, 93 used the Morris equation. Thirty-four facilities used two or more equations without consistency in their choice of the equation, or did not have available information on the reference equations used (Table 2).

Current use of reference equations
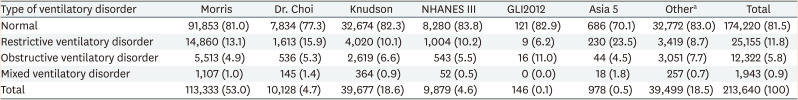
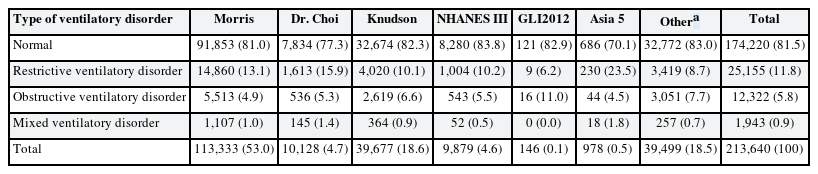
Except for facilities using the GLI2012 equation, the rate of restrictive ventilatory disorders was higher than that of obstructive ventilatory disorders (Table 3).
Changes in the rates of ventilatory disorder diagnosis with the choice of reference equation
Changes in the rates of ventilatory disorder findings with the use of major reference equations
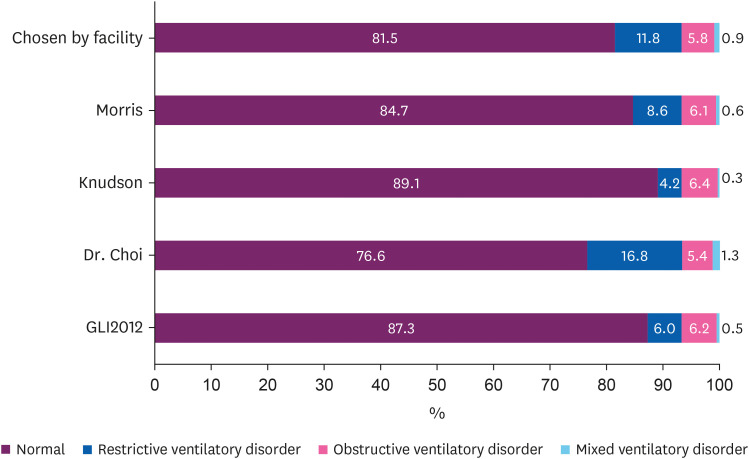
We examined the changes in the rates of ventilatory disorder findings after changing the reference equations used by each health examination facility to the major reference equations. The reference equations developed for Koreans were the Dr. Choi and GLI2012 equations, and those developed for non-Korean populations and most commonly used were the Morris and Knudson equations. Of the four major reference equations, the rate of normal findings was highest (89.1%) and lowest (76.6%) when the Knudson and Dr. Choi equations were used, respectively. The rate of restrictive ventilatory disorder was higher than that of obstructive ventilatory disorder with the Morris and Dr. Choi equations, while the rate of obstructive ventilatory disorder was higher than that of restrictive ventilatory disorder with the Knudson and GLI2012 equation (Fig. 2).
Changes in the rates of ventilatory disorder diagnosis with the choice of reference equation.
GLI2012: Global Lung Function Initiative 2012-Northeast Asian.
Agreement of ventilatory disorder diagnosis across reference equations
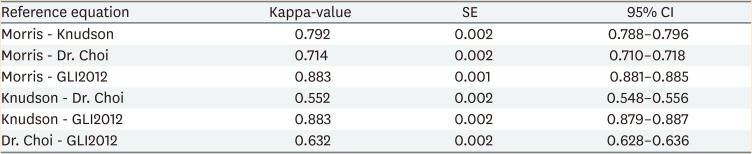
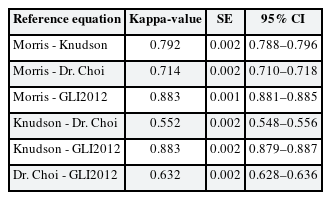
Kappa analysis showed that the agreement of diagnosis was the highest between the Morris and GLI2012 equations (κ = 0.88), and lowest between the Knudson and Dr. Choi equations (κ = 0.55; Table 4).
Agreement of ventilatory disorder diagnosis among reference equations
General characteristics of the normal group
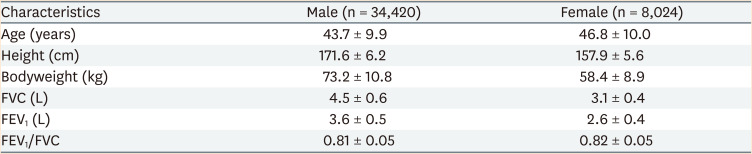
The mean ages, heights, and weights of men and women in the normal group were 43.7 years, 171.6 cm, and 73.2 kg, and 46.8 years, 157.9 cm, and 58.4 kg, respectively. The mean FVC and FEV1 values among men and women were 4.5 L and 3.6 L, and 3.1 L and 2.6 L, respectively (Table 5).
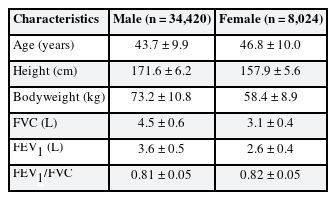
Physical characteristics and spirometry results of the normal group
Comparison of FVC or FEV1 distribution and prediction curves by age
Fig. 3 shows the distributions of FVC or FEV1 by age as a scatter plot in the normal group. The prediction curve for FVC or FEV1, considering the mean height and weight of the normal group, is also shown. The prediction curve for the Dr. Choi equation was drawn above other curves. The slope of the FVC curve for the Dr. Choi equation in men was smaller than that for other reference equations, and the gap between this curve and other curves widened with advancing age.
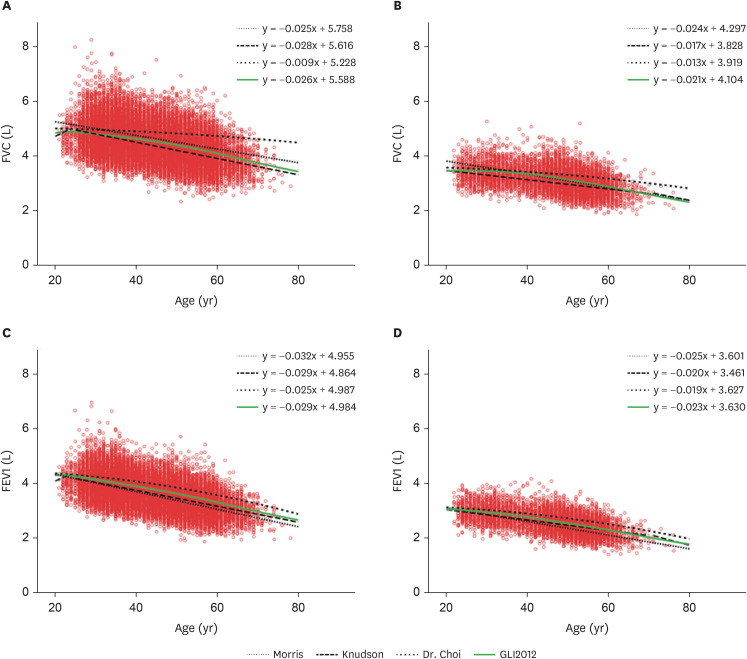
Comparison of FVC or FEV1 distributions and prediction curves by age.
(A) Male, changes in FVC with age, (B) Female, changes in FVC with age, (C) Male, changes in FEV1 with age, (D) Female, changes in FEV1 with age. Prediction curves by age were generated with reference to the mean height (171.6 cm for men, 157.9 cm for women) and mean weight (73.2 kg for men, 58.4 kg for women) in the normal group.
FVC: forced vital capacity; FEV1: forced expiratory volume in 1 second; GLI2012: Global Lung Function Initiative 2012-Northeast Asian.
Comparison of FVC or FEV1 distributions and prediction curves by height
Figure 4 shows the distributions of FVC or FEV1 by height as a scatter plot in the normal group. The prediction curve for FVC or FEV1, considering the mean age and weight of the normal group, is also shown. The prediction curve for the Dr. Choi equation was drawn above other curves. The slope of the curves for the Knudson equation were the largest for FVC in men and FEV1 in men, and the gap between this curve and other curves widened with decreasing height.
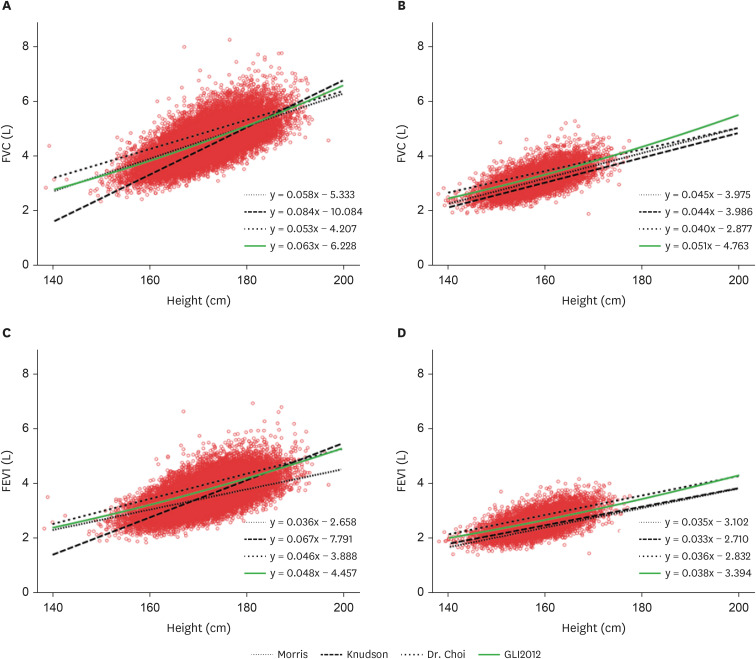
Comparison of FVC or FEV1 distributions and prediction curves by height.
(A) Male, changes in FVC with height, (B) Female, changes in FVC with height, (C) Male, changes in FEV1 with height, (D) Female, changes in FEV1 with height. Prediction curves by height were generated with reference to the mean age (43.7 years for men, 46.8 years for women) and mean weight (73.2 kg for men, 58.4 kg for women) in the normal group.
FVC: forced vital capacity; FEV1: forced expiratory volume in 1 second; GLI2012: Global Lung Function Initiative 2012-Northeast Asian.
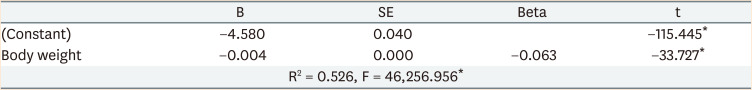
Effects of body weight on FVC
After adjusting for age and height, regression was performed with weight as the independent variable and FVC as the dependent variable. The results confirmed that body weight negatively affects FVC (Table 6).
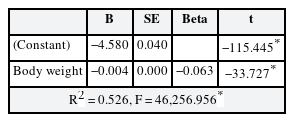
Effects of body weight on forced vital capacity
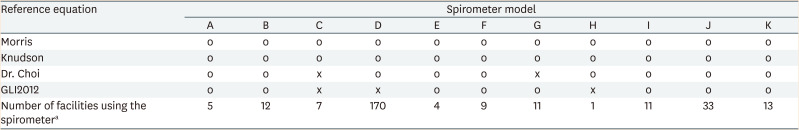
Applicability of reference equations by spirometer model
Of 11 spirometer models, the Dr. Choi equation could not be used in 2 models, and the GLI2012 equation could not be used in 3 models, including the most widely used D model (Table 7).
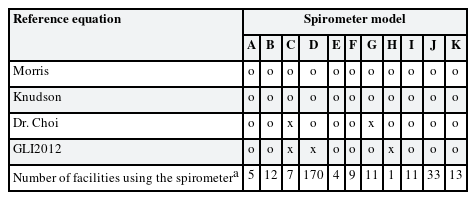
Available reference equations by spirometer model
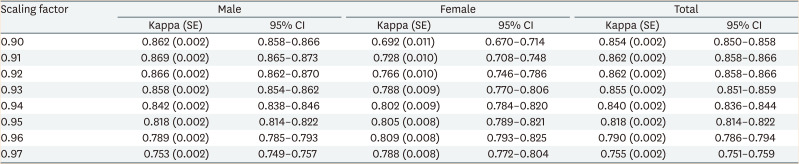
Diagnostic agreement between the Dr. Choi and GLI2012 equations with different scaling factors
We analyzed the agreement of diagnosis between the scaling factor-applied Dr. Choi equation and GLI2012 equation. The κ statistic was 0.87 at a scaling factor of 0.91 for men, and 0.81 at a scaling factor of 0.96 for women. For both sexes, the agreement was the highest at a scaling factor of 0.91 (κ = 0.86), but the diagnostic agreement for women dropped to κ = 0.73 at this level. At a scaling factor of 0.95, the κ statistic was 0.81 or higher in both men and women (Table 8).
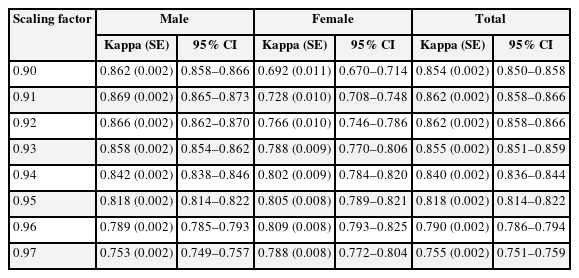
Agreement of diagnosis between the scaled Dr. Choi equation and the GLI2012 equation
DISCUSSION
Interpretation of spirometry results in Korea’s special health examination uses the ratio of measured values to reference values of lung capacity. In particular, for workers exposed to wood dust, welding fumes, cotton dust, or asbestos dust, 60%–80% of the reference value is suggested as the criterion for C1 (occupational disease observation required) or D1 (occupational disease findings) judgements. However, since the reference equation for calculating the reference value is not presented, the criteria for judgement may be different for each facility.
The American Thoracic Society (ATS), ERS, and ACOEM pinpointed the use of race-specific reference equations as one of the key factors influencing the interpretation of spirometry results.21118 However, it is speculated that most health examination facilities lack evidence for choosing the reference equation, and do not perceive the need to choose an appropriate reference equation. The fact that of the 238 facilities reviewed, 111 facilities chose reference equations that had been derived on populations not including Koreans or Asians, and 34 facilities chose different equations depending on the equipment or could not provide information about the reference equations used, attests to this speculation.
The most widely used reference equation among Korea's special health examination facilities was the Morris equation (39.1%). According to a 2019 KOSHA report, most facilities using the Morris equation did so because their equipment was set for the Morris equation at the time of their purchase, and because no one had informed them of the need for a change in equation, along with a lack of applicable standards.14 However, since the Morris equation was derived from Caucasians in a specific region and religious group in the US, it is not representative of Asians, let alone Koreans. Further, the Kory method was used to measure time zero, where the volume is calculated after subtracting 200 mL from the baseline.1920 However, this method has been reported to underestimate FEV1 by an average of 179 mL than the back extrapolation method, revealing limitations of the reference equation.21 The ATS proposed uniformly applying the back extrapolation method for measuring time zero in spirometry, and this remains the standard even today.2223 We also confirmed in our study that the FEV1 curve generated using the Morris equation was below the other curves.
It is speculated that facilities using the Knudson equation have chosen it on the basis of past OSHA data that specifies the appropriateness of the Knudson equation for spirometry in an occupational setting,13 and have continued to use it since. However, OSHA now recommends the NHANES III equation derived on the basis of the US NHANES data in 1999 as the basic reference equations for workers.1324 Moreover, the Knudson equation was developed for a Caucasian population, and cannot be applied to Asians.25 Race-specific reference equations are required since the interpretation of results and diagnosis of respiratory disorders may differ for different races.2627
The present study found that the diagnosis of restrictive ventilatory disorders and mixed ventilatory disorders is higher with the Dr. Choi equation. On the other hand, choosing the Morris, Knudson, and GLI2012 equations led to a higher rate of diagnosis of normal conditions and obstructive ventilatory disorders. Lee et al. reported that the FVC and FEV1 values generated by the Dr. Choi equation are higher than those generated by the Morris equation, which calls for caution when interpreting the results using the Dr. Choi equation.28 Oh et al.29 stated that applying the Dr. Choi equation instead of the Morris equation can cause a frequent diagnosis of more severe conditions, and significantly affect the interpretation of disorders and severity.
The FVC or FEV1 prediction curves according to age generated with the Dr. Choi equation sit higher than other curves, and particularly, the FVC curve’s slope in men was smaller and proportional to age compared to the other curves, which leaves the possibility of overestimation of abnormal findings among older individuals. Regarding the prediction curves according to height, the Knudson equation was linked to a risk of underestimation of abnormal findings for shorter men, as the predicted FVC and FEV1 values were lower for shorter men. On the other hand, the Morris equation was linked to a risk of underestimating abnormal findings for taller men, with the predicted FEV1 values lower for taller men.
The prediction curve generated with Dr. Choi’s equation did not align with the normal group observed in this study, and facilities that applied the Dr. Choi equation showed a high diagnosis rate of abnormal conditions. Such changes in the patterns of the disorders are attributable to the higher reference values from the Dr. Choi equation compared to other equations, which is presumably due to the inclusion of body weight in the estimation of FVC values. The Dr. Choi equations apply [+0.01095 × body weight] for men and [+0.006892 × body weight] women in FVC prediction, and values of 0.8 and 0.4 L, respectively, are added to the reference values based on a mean body weight of 73.2 kg and 58.4 kg for men and women, respectively. However, many studies have reported that increased body weight reduces lung capacity,30313233 and our results also confirmed that body weight negatively affects FVC.
Among the four major reference equations for comparison, only two — the Dr. Choi and GLI2012 equations — were derived from populations including Koreans, and are available in the spirometers currently used in special health examination facilities. Although the 2 equations were developed based on similar data, their reference values differed. The GLI2012 equation was more aligned with the distribution of the normal group, and although this equation included data from people from northern China in addition to Koreans, it was reported that region-specific equations are not needed since physical features and FVC and FEV1 distributions are similar.11 Like most other reference equations, the Dr. Choi equation was developed using regression analyses, and the GLI2012 equation was developed using the Lambda (skewness), Mu (mean), Sigma (coefficient of variation) (LMS) method. The LMS method is considered an effective method that addresses the limitations of regression-based reference equations10 and is currently recognized as the international standard, and for this reason, many countries use the LMS method in deriving the reference equations for their populations.1134 In Korea, some have attempted to apply the LMS method in the reference equations and utilized the KNHANES IV (2007–2009) and V (2010–2012) data,9 but the compatibility of these equations with spirometers currently used in special health examination facilities requires elucidation.
Of 276 spirometers analyzed, the GLI2012 equation was not available in 178 (64.5%). Hence, we recommend using a scaling factor to improve the agreement of diagnosis and consistency of interpretation of results across health examination facilities. The diagnostic agreement between the GLI2012 and Dr. Choi equations was moderate (κ = 0.63).35 The equations had the highest agreement (κ = 0.86) at a scaling factor of 0.91, and the agreement was lower for women (κ = 0.73) than men (κ=0.87). The diagnostic agreement for women was the highest at a factor of 0.96 (κ = 0.81), but at this scaling factor, the diagnostic agreement for both sexes and men dropped to κ = 0.79. While altering the cutoff percentage for determining normal/abnormal FVC% may be one way to boost the agreement of diagnosis for women at the scaling factor at which the agreement was the highest for men (0.91), the agreement of diagnosis was still strong (κ ≥ 0.80)35 at a scaling factor of 0.95. We determined that applying a sex-nonspecific factor based on a cutoff of 80%, the current cutoff used in most facilities, would increase convenience and reduce confusion. Even after applying a scaling factor of 0.95, there was still a risk for underestimation in younger individuals and overestimation in older adults, and a risk for underestimation and overestimation in tall and short individuals, respectively. However, considering that more than 90% of the examinees are between ages 30–59 years and have an average height, the number of underdiagnosed or overdiagnosed workers is anticipated to remain low.
In this study, we have reviewed the problems associated with reference equations that influence the interpretation of spirometry results in special health examination facilities and proposed reference equations considering the conditions of health examinations in Korea. Further, from a practical perspective, we recommend using a scaling factor in facilities with no other option but to use inappropriate reference equations due to the limitations of their equipment to maximize diagnostic consistency across facilities. These results will be valuable as foundational data for developing standard guidelines for interpreting spirometry results.
CONCLUSIONS
The Dr. Choi and GLI2012 equations are virtually the only available reference equations derived from the Korean population, and can be used in spirometers across special health examination facilities. However, the Dr. Choi equation included body weights and thus led to an overestimation of the reference values, while the GLI2012 equation generated a more suitable prediction curve for the lung functions of the normal group. We recommend using a scaling factor of 0.95 on the Dr. Choi equation for spirometer models that cannot use the GLI2012 equation to enhance diagnostic consistency. While waiting for more scientific and validated reference equations to be developed, organizations must review and immediately apply the most appropriate reference equation available, instead of using diverse reference equations as they do currently.
ACKNOWLEDGMENTS
The authors thank Dr. Deog Hwan Moon, Inje University Graduate School of Public Health, for his advice for this study.
Notes
Funding: This research was supported by Occupational Safety and Health Research Institute of Korea.
Competing interests: The authors declare that they have no competing interests.
Author Contributions:
Conceptualization: Won Y.
Data curation: Won Y.
Formal analysis: Won Y.
Investigation: Lee HY.
Methodology: Won Y.
Validation: Lee HY.
Writing - original draft: Won Y.
Writing - review & editing: Won Y, Lee HY.
Abbreviations
ACOEM
American College of Occupational and Environmental Medicine
ATS
American Thoracic Society
ERS
European Respiratory Society
FEV1
forced expiratory volume in 1 second
FVC
forced vital capacity
GLI2012
Global Lung Function Initiative 2012-Northeast Asian
KNHANES
Korea National Health and Nutrition Examination Survey
KOSHA
Korea Occupational Safety and Health Agency
LMS
Lambda (skewness), Mu (mean), Sigma (coefficient of variation)
NHANES III
National Health and Nutrition Examination Survey III
OSHA
Occupational Safety and Health Administration