Relationship between urinary phthalate metabolites and diabetes: Korean National Environmental Health Survey (KoNEHS) cycle 3 (2015–2017)
Article information
Abstract
Background
We aimed to determine relationship diabetes according to urinary phthalate metabolites using adult data from Korean National Environmental Health Survey cycle 3 (2015–2017).
Method
This study was conducted on 3,781 adults aged 19 years and older (1,648 men and 2,133 women) based on KoNEHS cycle 3. Participants' data were analyzed by gender; Relationship between phthalate metabolites in the urine and diabetes was analyzed by dividing the sociodemographic variables, health behavior-related variables, and urinary phthalate metabolite concentrations into quartiles. To determine the relationship between urinary phthalate metabolites and the prevalence of diabetes, the odds ratio (OR) was calculated using logistic regression analysis.
Results
Based on the 1st quartile of each metabolite, the ORs for di-2-ethylhexyl phthalate (DEHP) (4th quartile), mono-(2-ethyl-5-hydroxyhexyl) phthalate (MEHHP) (2nd quartile, 3rd quartile and 4th quartile), mono-(2-ethyl-5-oxohexyl) phthalate (MEOHP) (4th quartile), mono-(2-ethyl-5-carboxypentyl) phthalate (MECCP) (4th quartile), mono-n-butyl phthalate (MnBP) (3rd quartile and 4th quartile), mono-benzyl phthalate (MBzP) (2nd quartile) and 4th quartile), and mono (3-carboxypropyl) phthalate (MCPP) (3rd quartile and 4th quartile) were significantly higher after the adjustment in men. The ORs for DEHP (2nd quartile, 3rd quartile and 4th quartile), MEHHP (2nd quartile, 3rd quartile and 4th quartile), MEOHP (4th quartile), MECCP (4th quartile), MBzP (4th quartile), and MCPP (4th quartile) were significantly higher after the adjustment in women.
Conclusion
This study investigated relationship between urinary phthalate metabolites and diabetes. The higher urinary phthalate metabolites, the higher the prevalence of diabetes. Further regulation of phthalate may be needed, and further studies are warranted to confirm the association between phthalate concentration and other chronic diseases (such as hypertension, hyperlipidemia, and cardiovascular disease).
INTRODUCTION
Phthalate is a chemical additive composed of a dimer of 1,2-benzenedicarboxylic acid and its homologs. Di-2-ethylhexyl phthalate (DEHP), di-octyl phthalate (CAS No. 117-81-7), and di-n-butyl phthalate (DBP) (CAS No. 84-74-2) are its typical homologs.
Phthalate was developed as a material used to soften plastics such as polyvinyl chloride (PVC), and to make food storage containers, toys, cosmetics, construction materials, and medical supplies [1]. Since its inception in 1933, about 4.7 million tons were produced worldwide in 2006 and 8 million tons in 2015 [2].
Phthalates can easily fall off plastics due to their non-covalent nature, and they mainly enter the human body through ingestion (e.g., consumption of food stored in plastic containers), inhalation, and dermal contact. In addition, phthalates do not accumulate in the body due to hydrophilicity. They are metabolized in the human body and undergo phase 1 and 2 reactions; most of them are excreted in the urine within 24 to 48 hours [3].
Despite the short half-life, phthalates cause various health problems for the human body. Phthalates are known to affect the metabolism of carbohydrates and cause hormonal and inflammatory disturbances, thereby increasing insulin resistance as well as causing and exacerbating hypertension, diabetes, hyperlipidemia, hypertriglyceridemia, and metabolic syndrome [4]. The specific mechanism is as follows. Peroxisome proliferator activated receptors (PPARs), which are involved in fatty acids, eicosanoids and lipid metabolism, use fatty acids as ligands to maintain blood lipid levels and adipose tissue homeostasis. In particular, PPARα and PPARγ are associated with lipolysis and lipid storage, and PPARγ is also known to be associated with insulin resistance and type 2 diabetes [5]. Phthalates is an EDC (endocrine-disrupting chemical) that acts as an analog of thyroid hormone and androgen, changes the interstitial structure, weakens the kidney function, and increases the incidence of breast cancer [678910].
There are a number of papers worldwide that study the relationship between urinary phthalate metabolite and diabetes. In studies conducted in countries such as China, the United States and the Middle East, the higher urinary phthalate metabolites, the higher the prevalence of diabetes. [111213]
Because of this, many countries have established some regulations regarding the use of phthalates. Several studies have reported this topic, but none of them examined the levels of phthalate exposure among Korean individuals and its health effects.
Therefore, we aimed to explain the necessity of reducing exposure by determining the prevalence of diabetes based on urinary phthalate metabolites in adult population groups using representative data.
METHODS
Study population
The data of adult individuals aged 19 years or older who participated in Korean National Environmental Health Survey (KoNEHS) cycle 3 (2015–2017) were used in this study. Based on Article 14 of the Environmental Health Act, the National Institute of Environmental Research is conducting a 3-year basic survey on the level of exposure of people to environmental hazards in Korea to analyze the current state of environmental health of national and regional units and the time-space distribution, changes and influences of environmental harmful substances in the body.
Data of adult participants in KoNEHS cycle 3 were sampled based on the 2015 population and housing census. After the first stratification into the regional administrative area and the coastal layer, it was secondarily stratified socially and economically. Unlike previous surveys, heavy metal measuring network installation areas were considered as layers. The participants were selected from a total of 233 sample surveys, including 191 general surveys, 9 new apartments, 13 coastal layers, and 20 heavy metal network surveys. In addition, the distribution of samples in each region was determined using the square root proportional distribution method [14].
A total of 3,787 persons were surveyed, with 15 persons in each survey area. For the collection and analysis of biological samples, 16 clinical tests and 26 environmentally harmful substances were analyzed through blood and urine tests.
This study was conducted in 3,781 (1,648 men and 2,133 women) of the 3,787 adult individuals who participated in KoNEHS cycle 3, while 6 were excluded as they had no data on urine phthalate metabolite concentration.
Variables
In this study, ‘Taking diabetes’ was defined as a diabetes patient among subjects taking medicine to see if diabetes was diagnosed according to urinary phthalate metabolites.
The social demographic variables and health behavior variables of the study participants were classified as follows. Among the socio-demographic variables, gender was analyzed by stratification by men, women and age was aged 19 years and over in 10-year increments. Body mass index (BMI) was presented as the average value. The education level was classified into non-education, high school graduation, and college graduation or higher. Marriage status was categorized into unmarried, married and cohabited, and other cases (divorce, separation) and the economic level was classified into household monthly income of less than 2 million won, from 2 million won to less than 5 million won, more than 5 million won, and unknown. Smoking was classified as none or ex smoking and current smoking, and alcohol was classified as none or ex drinking and current drinking. Exercise was classified as yes or no.
Urinary phthalate metabolites
Urine phthalate metabolite concentration was measured by Xevo TQ-S (Waters, Milford, MA, USA) using ultra urine liquid chromatograph-mass spectrometry. This method is performed by extracting the urine sample using β-glucuronidase/arylsulfatase degrading enzyme and ethyl acetate. During the analysis, a certain amount of standard solution was added to the sample. A calibration curve was used to determine the urine sample concentration. The result of the assay was calculated as ±15% of the reference value. The relative standard deviation was used to measure the reproducibility of the test method and was within 15%. A quality control (QC) sample was used for the accuracy measurement. A standard solution was used for internal QC and was analyzed while checking the precision and accuracy. The method detection limit (MDL) were 0.056 ug/L for mono-(2-ethyl-5-hydroxyhexyl) phthalate (MEHHP), 0.048 ug/L for mono-(2-ethyl-5-oxohexyl) phthalate (MEOHP), 0.141 ug/L for mono-(2-ethyl-5-carboxypentyl) phthalate (MECPP), 0.04 ug/L for mono-n-butyl phthalate (MnBP), 0.066 ug/L for mono-benzyl phthalate (MBzP), 0.048 ug/L for mono-carboxyoctyl phthalate (MCOP), 0.139 ug/L for mono-carboxy-isononly phthalate (MCNP), and 0.078 ug/L for mono (3-carboxypropyl) phthalate (MCPP). The value below MDL was calculated by substituting MDL/√2, and the final concentration of the phthalate metabolite was calculated by correcting the measured concentration of urea phthalate in the urine with urea creatinine concentration. In addition, the concentration of DEHP metabolites in the urine was expressed as the sum of MEHHP, MEOHP, and MECCP [15].
Statistical analysis
To determine the general characteristics of the study participants, the distribution and fraction of each independent variable were presented by gender; after dividing the participants based on the prevalence of diabetes, the frequency and composition fraction of each independent variable were presented by gender. In addition, a chi-square test was conducted to identify the distribution of independent variables.
To determine the relationship between urinary phthalate metabolite and diabetes, the concentration was divided into the top 25, 50, and 75 quartiles, and the odds ratio (OR) was calculated using a logistic regression analysis. Participants' age, body mass index, health-related variables, and socioeconomic variables were presented. The IBM SPSS (version 19 for window; IBM Corp., Armonk, NY, USA) was used for all statistical analyses, and p-value of <0.05 was considered significant.
RESULTS
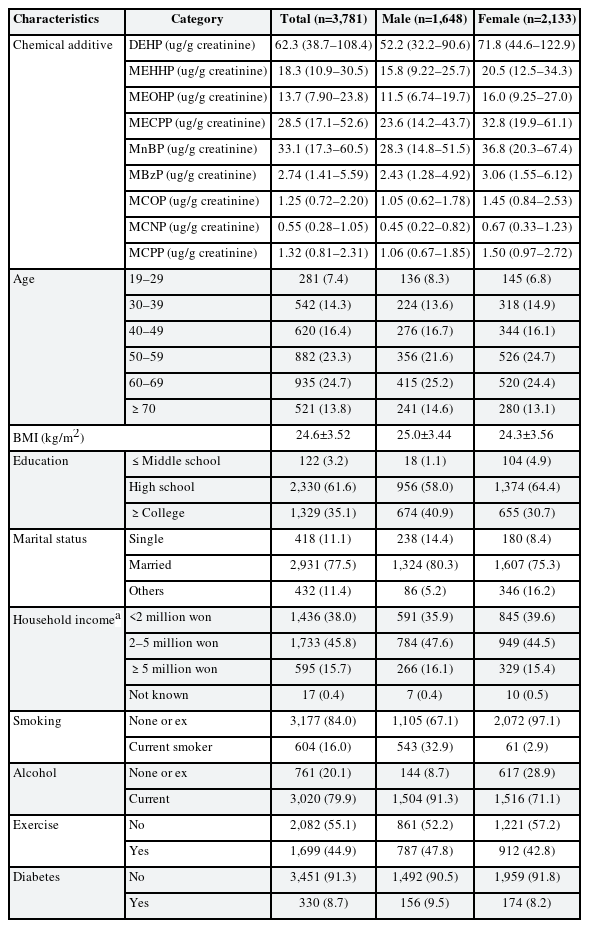
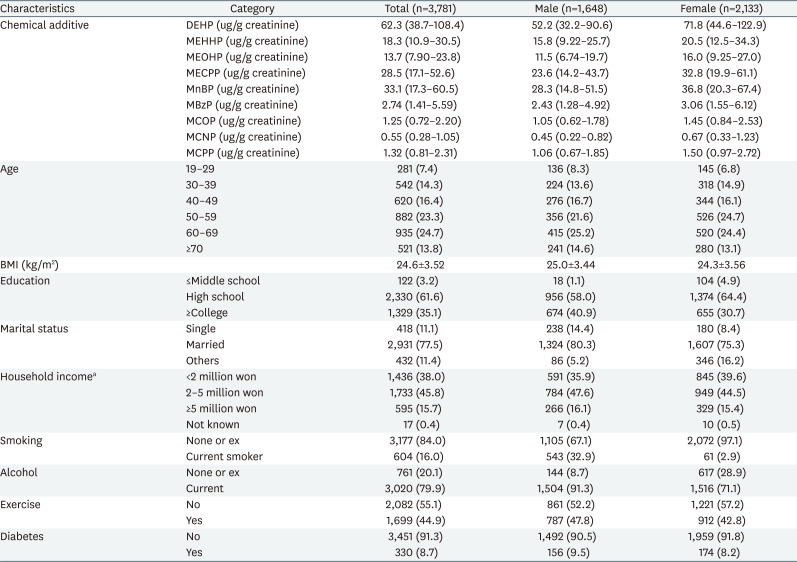
The distribution and fraction of independent variables are as follows (Table 1). Of the total participants, 1,648 (43.6%) were men, while 2,133 (56.4%) were women. The median values of phthalate metabolites were as follows: DEHP, 62.3 μg/g creatinine (men: 52.2 μg/g creatinine, women: 71.8 μg/g creatinine); MnBP, 33.1 μg/g creatinine (men: 28.3 μg/g creatinine, women: 36.8 μg/g creatinine); and MCOP 1.25 μg/g creatinine (men: 1.05 μg/g creatinine, women: 1.45 μg/g creatinine). Women had higher concentrations of in the urine than men. Smoking and drinking rates and the prevalence of diabetes were higher in men than in women.
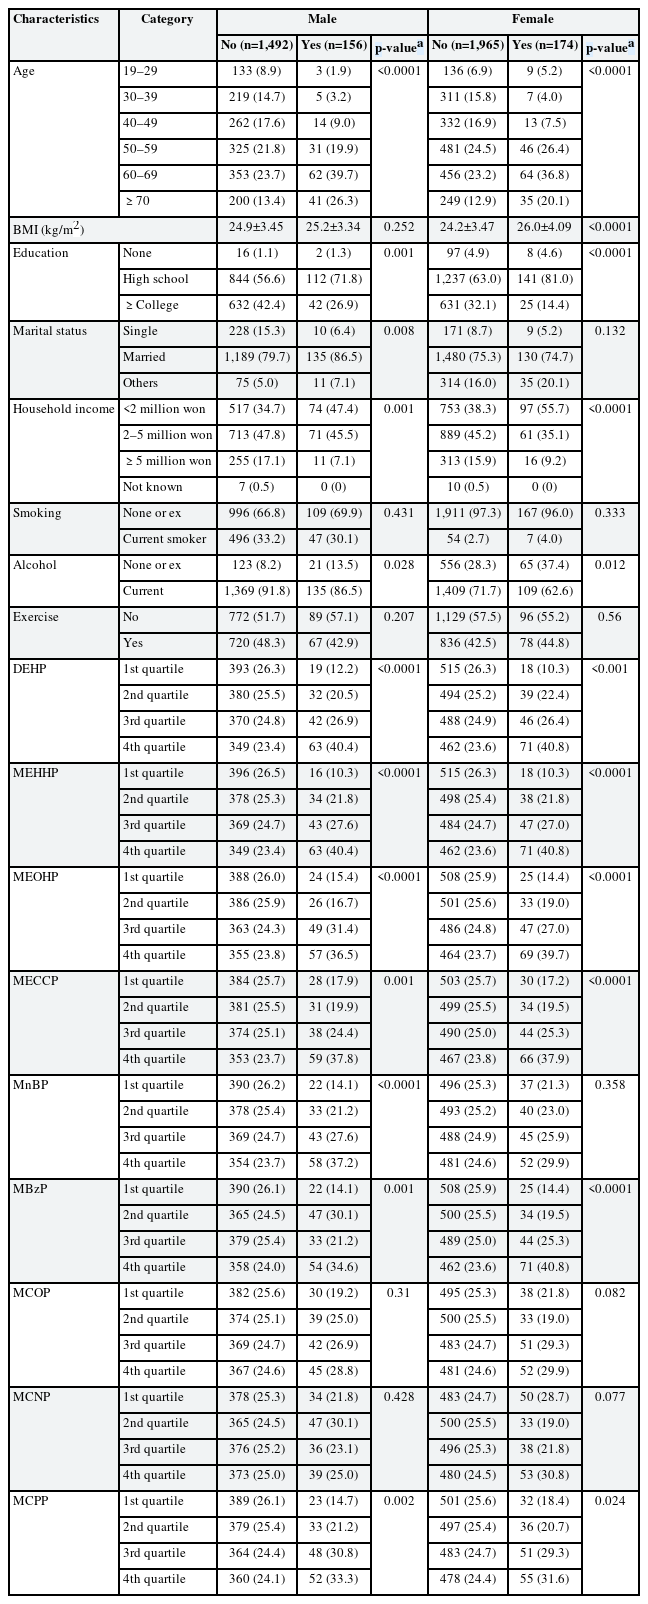
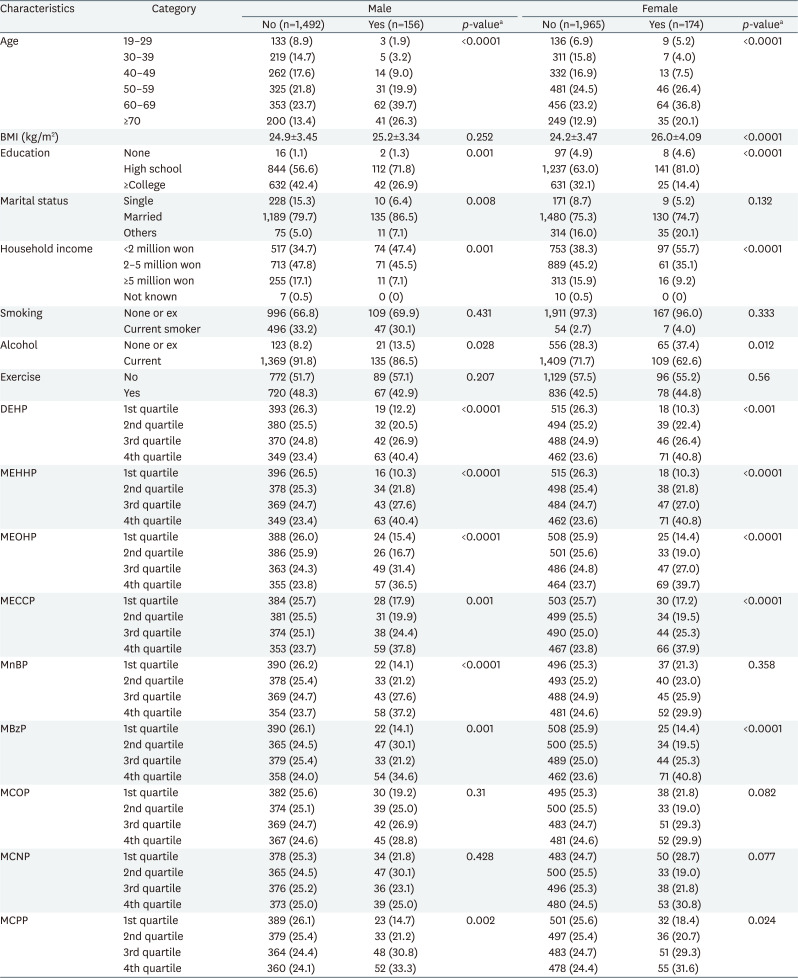
After classifying the participants according to the prevalence of diabetes, the distribution of the independent variables was presented (Table 2). In both men and women, the diabetes group had significantly lower rates than those with incomes of 2 million won or more and those with education. In addition, the rate of diabetes was significantly higher in married men, and BMI was significantly higher in women in the diabetes group than in those in the non-diabetes group.
With regard to the distribution of participants based on urinary phthalate metabolites, both male and female participants in diabetes group had significantly higher concentrations of DEHP, MEHHP, MEOHP, MECCP, MBzP, and MCPP than non-diabetes group. men had significantly higher concentrations of MnBP, while women had significantly higher concentrations of MCOP in diabetes group.
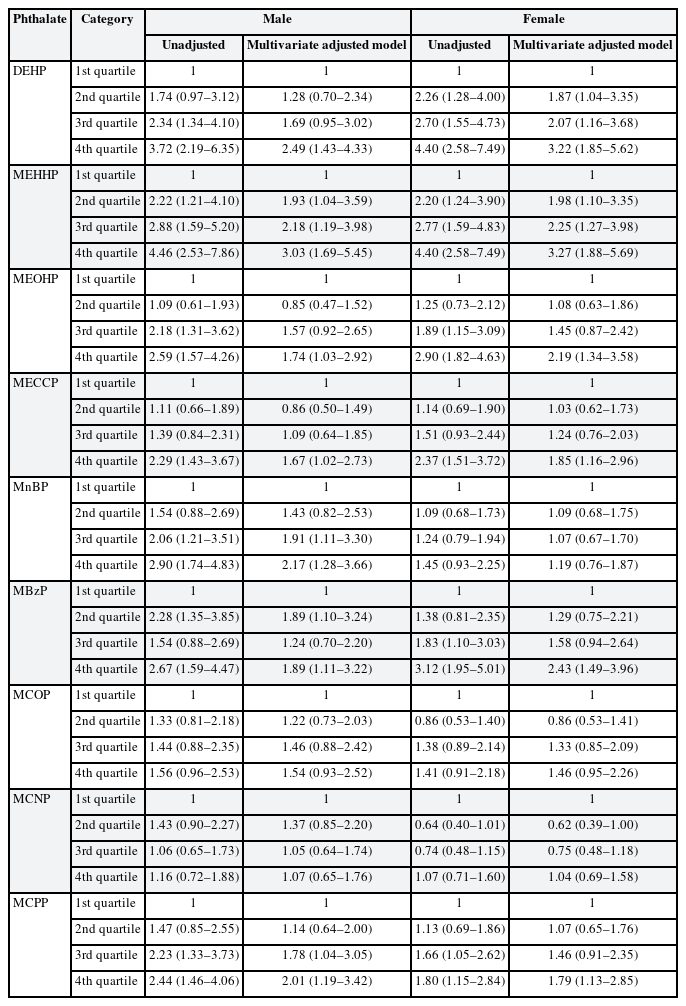
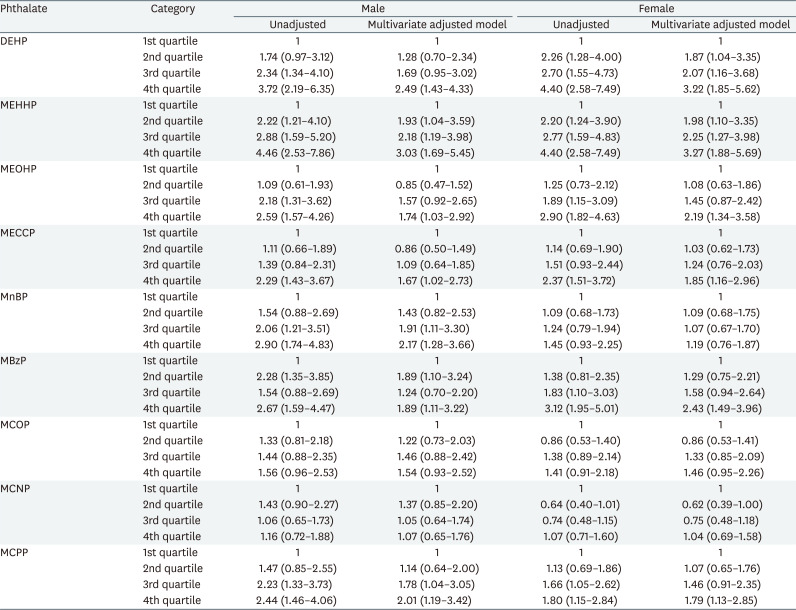
A logistic regression analysis was performed to determine diabetes based on urinary phthalate metabolites (Table 3). Based on the 1st quartile of each metabolite, the ORs for DEHP (4th quartile, OR: 2.49, 95% CI: 1.43–4.33), MEHHP (2nd quartile, OR: 1.93, 95% CI: 1.04–3.59; 3rd quartile, OR: 2.18, 95% CI: 1.19–3.98; and 4th quartile, OR: 3.03, 95% CI: 1.69–5.45), MEOHP (4th quartile, OR: 1.74, 95% CI: 1.03–2.92), MECCP (4th quartile, OR: 1.67, 95% CI: 1.02–2.73), MnBP (3rd quartile, OR: 1.91, 95% CI: 1.11–3.30 and 4th quartile, OR: 2.17, 95% CI: 1.28–3.66), MBzP (2nd quartile, OR: 1.89, 95% CI: 1.10–3.24 and 4th quartile, OR: 1.89, 95% CI: 1.11–3.22), MCPP (3rd quartile, OR: 1.78, 95% CI: 1.04–3.05 and 4th quartile, OR: 2.01, 95% CI: 1.19–3.42) were significantly higher after adjustment in men.
Meanwhile, the OR for DEHP (2nd quartile, OR: 1.87, 95% CI: 1.04–3.35; 3rd quartile, OR: 2.07, 95% CI: 1.16–3.68; and 4th quartile, OR: 3.22, 95% CI: 1.85–5.62), MEHHP (2nd quartile, OR: 1.98, 95% CI: 1.10–3.35; 3rd quartile, OR: 2.25, 95% CI: 1.27–3.98; and 4th quartile, OR: 3.27, 95% CI: 1.88–5.69), MEOHP (4th quartile, OR: 2.19, 95% CI: 1.34–3.58), MECCP (4th quartile, OR: 1.85, 95% CI: 1.16–2.96), MBzP (4th quartile, OR: 2.43, 95% CI: 1.49–3.96), and MCPP (4th quartile, OR: 1.79, 95% CI: 1.13–2.85) were significantly higher the after adjustment in women.
DISCUSSION
Based on the results of this study, many individuals with diabetes had low income and lack of education. This finding is consistent with those of existing studies. In a Canadian study that used the data from the regional Diabetes Education Center database, the Canadian National Diabetes Surveillance System (NDSS) and the 2001 Canadian Census, the lower the economic level, the higher the rates of diabetes [16].
In a similar study, based on the 2001–2008 U.S. National Health and Nutrition Survey, the phthalate metabolite concentrations of 1,182 American women aged 20–39 years were compared by socioeconomic status. Results showed that the lower the education level, the higher the concentration of MBzP and monoethyl phthalate, and the lower the economic level, the higher the concentration of MBzP [17]. Moreover, another study, based on KoNEHS cycle 2 (2012–2014) data, compared urinary phthalate metabolites of 6,470 adult men and women aged more than 19 years according to socioeconomic level. This study showed that the lower the education level and the lower the socioeconomic level, the higher urinary phthalate metabolites [18].
The results of this study further confirmed that the higher urinary phthalate metabolites, the higher the proportions of individuals with diabetes. In the diabetes group, men had significantly higher concentrations of DEHP (4th quartile), MEHHP (2nd, 3rd, and 4th quartiles), MEOHP (4th quartile), MECCP (4th quartile), MnBP (3rd and 4th quartiles), MBzP (2nd and 4th quartiles), MCPP (3rd and 4th quartiles) after the adjustment. Meanwhile, women had significantly higher concentrations of DEHP (2nd, 3rd, and 4th quartiles), MEHHP (2nd and 3rd quartiles), MEOHP (4th quartile), MECCP (4th quartile), MBzP (4th quartile), and MCPP (4th quartile). There was no difference in the relationship between urinary phthalate metabolites and diabetes by gender.
Compared with the results of other studies published in other countries, based on the 2012 Shanghai Food Consumption Survey in China, 2,330 individuals with 10 phthalate metabolites in the urine and a group of patients with chronic diseases (such as hypertension, diabetes, and hyperlipidemia) were analyzed. In this study, MECCP (3rd and 4th quartiles) and MEHHP (2nd and 4th quartiles) had significantly higher diabetes people than those of 1st quartile. Higher urinary phthalate metabolites were also associated with hyperlipidemia and stroke [11]. In the 2001–2008 study of diabetes prevalence in women in the U.S. National Health and Nutrition Survey, MBzP (3rd and 4th quartiles) had significantly higher diabetes people than those of 1st quartile [12]. In a 2019 study that analyzed the urinary phthalate metabolite concentrations of 101 type 2 diabetes mellitus individuals who are residing in Jeddah, Saudi Arabia, and the Middle East, DEHP (3rd quartile), MEHHP (2nd, 3rd, and 4th quartiles), MEOHP (3rd quartile), and MECPP (3rd quartile) had significantly higher diabetes people than those of 1st quartile [13]. The results of this study were consistent with those of existing studies.
Other metabolic disorders associated with diabetes (obesity, hyperlipidemia etc.) and urine phthalate metabolite concentrations were also compared. Based on data from KoNEHS cycle 2, the obesity (above BMI 30 kg/m2) group by urine phthalate metabolite concentration and the normal weight group (BMI below 30 kg/m2) were also studied in Korean papers. In this study, DEHP (4th quartile) and MEHHP (2nd, 3rd, and 4th quartile sections) were significantly higher in the number of obese groups [19].
Phthalates are absorbed through various routes in the human body, such as the oral cavity, mucous membranes, and respiratory organs, and then hydrolyzed in a phase 1 reaction and then activated in vivo [20]. The activated phthalate metabolite acts as a PPARγ agonist. PPARγ is a factor involved in insulin resistance, lipid synthesis and degradation, immune and inflammatory responses in vivo. It is known that rosiglitazone, pioglitazone, and thiazolidinedione, which are well-known for treating type 2 diabetes, act on PPARγ to lower insulin resistance [21]. Phthalate metabolites form PPARα-γ dimers to activate transcription factors to act on the intracellular genome to activate adipogenesis to promote the synthesis of adipocytes and block the action of adiponectin. Through this, the mechanism that causes weight gain, obesity, etc., which increases insulin resistance and eventually leads to obesity, diabetes, and hyperlipidemia is well known [22]. In a paper that studied the proportion of abdominal fat according to blood phthalate metabolites in women over 70 years of age in Sweden, the higher blood phthalate metabolite, the higher the abdominal fat ratio. A study of women in the United States also confirmed that the higher urinary phthalate metabolites and bisphenol A, the higher the proportion of women who gained weight [2324]. In addition, a study analyzing 72 papers on phthalate exposure and metabolic effects showed a moderate-to-strong association between phthalate exposure and insulin resistance, type 2 diabetes, impaired glucose tolerance and gestational diabetes [25]. A study conducted by Hong et al. also showed a significant fasting blood glucose difference in the group exposed to phthalate more than in the group exposed to low phthalate. For this reason, phthalate metabolites can cause oxidative stress in the body, leading to insulin resistance and diabetes [26].
In addition, the phthalate metabolites from the mother can be transferred to the fetus through the placenta; this increases the child's risk of developing metabolic problems such as obesity and diabetes during the growth period [2728]. In a study that measured blood insulin levels in fetal rats exposed to phthalate, it was confirmed that the blood insulin level was lower than that of the control group, and thus it was correlated with phthalate metabolites and insulin resistance [29]. Phthalate metabolites can also be introduced through milk, which can lead to occurrence of metabolic diseases such as obesity and diabetes during the growth period. In addition, the possibility that gestational diabetes incidence may increase as the concentration of phthalate metabolites in the body increases in pregnant women [30] and that phthalate can reduce insulin production by modifying the DNA sequence of pancreatic b cells that produce insulin has recently been raised [31]. Phthalates had antiandrogen effects, such as reduction in the size of the genitals, decrease in the production of sperm, and infertility in fetuses and infants [32].
For this reason, regulations on the use of phthalates are currently being enforced in each country. The US has banned the sale of children's toys and children’s products containing phthalate concentrations above 0.1 percent in April 2018 [33]. In addition, Europe banned the sale of toys made of PVC materials that use phthalates in 1999 [34] and mandated that the standard amount of phthalate for children's toys should not exceed 0.1% of the total DHEP + DBP + benzyl butyl phthalate (BBP) in 2009. In the same year, RoHS (Restriction of the use of Hazardous Substances) were implemented for 4 phthalates (DEHP, BBP, DBP, and di-isobutyl phthalate). Japan also mandated that the children's toys should only contain less than 0.1% of DEHP, DBP, and BBP.
In Korea, sleep, relax, hygiene, and breastfeed products for children is regulated in March 2007 by the Ministry of Environment, The use of phthalates in children’s formulations is still regulated; DEHP, DBP, BBP, and DNOP (Di-n-octyl phthalate) should not contain more than 0.1% of all manufactured products [3536].
However, regulations on the use of phthalates are mainly enforced on products used by children; domestic regulations on the use of large amounts of phthalates on electrical and electronic products are left to the autonomy of each company; hence, the level of exposure to phthalates increases. As mentioned above, exposure to phthalate in women of childbearing age can increase the occurrence of metabolic problems in the fetus during pregnancy. These metabolites can also be transmitted to infants through the breastmilk, which can also cause these problems. Hence, additional regulations are needed.
The limitations of this study are as follows. First, because this is a cross-sectional study, it is difficult to identify causality and temporality of phthalates and diabetes outbreaks, and it is also difficult to find only the cause factors among complex factors. Second, In KoNEHS cycle 3, the weights such as Stratum (stratification variable), Cluster (colonization variable), and Weight (weighted variable) were existed, but it was not used in this study. Third, this study did not consider the primary causes of diabetes as data on family history, taking medicine, endocrine disease, history of gestational diabetes and dietary patterns were not available. Fourth, in this study, diabetes was defined as having been taken diabetic medicine, so it was not possible to distinguish the subtypes of diabetes and participants who take insulin therapy. Fifth, because this study used a self-reported questionnaire, the possibility of omission of diabetes participants cannot be excluded. Sixth, in this study, there is a possibility of concentration variation as we only analyzed the phthalate metabolite concentration data measured in a single urine. Therefore, it is also necessary to change the method of sampling, such as urine collection for 24 hours, and to analyze the blood concentration. Seventh, there is a possibility that phthalate metabolite excretion increased due to structural factors such as hyperfiltration in diabetes patients.
Despite these limitations, this study suggested the concentration of urinary phthalate metabolites and the prevalence of diabetes according to each concentration using representative data of the general adult population in Korea. Phthalates have been identified as substances that cause a variety of side effects in vivo; therefore, managing multiple sources of exposure is necessary.
CONCLUSION
This study studied relationship between diabetes and the phthalate concentration. It was suggested that phthalate may induce diabetes; the higher urinary phthalate metabolites, the more it is associated with the development of diabetes. According to this study, additional regulations on phthalate exposure sources should be enforced, and additional studies are needed to confirm the association between phthalate and other chronic diseases (such as hypertension, hyperlipidemia, and cardiovascular disease).
Notes
Competing interests: The authors declare that they have no competing interests.
Author Contributions:
Conceptualization: Nam DJ, Ryoo JH
Formal analysis: Nam DJ, Kim Y, Yang EH, Lee HC.
Methodology: Ryoo JH.
Validation: Ryoo JH.
Writing - original draft: Nam DJ, Kim Y, Yang EH, Lee HC.
Writing - review & editing: Nam DJ, Ryoo JH.
Abbreviations
BBP
benzyl butyl phthalate
BMI
body mass index
DBP
di-n-butyl phthalate
DEHP
di-2-ethylhexyl phthalate
KoNEHS
Korean National Environmental Health Survey
MBzP
mono-benzyl phthalate
MCNP
mono-carboxy-isononly phthalate
MCOP
mono-carboxyoctyl phthalate
MCPP
mono (3-carboxypropyl) phthalate
MDL
method detection limit
MECPP
mono-(2-ethyl-5-carboxypentyl) phthalate
MEHHP
mono-(2-ethyl-5-hydroxyhexyl) phthalate
MEOHP
mono-(2-ethyl-5-oxohexyl) phthalate
MnBP
mono-n-butyl phthalate
NDSS
National Diabetes Surveillance System
PPAR
peroxisome proliferator activated receptor
PVC
polyvinyl chloride
QC
quality control

