The relationship between precarious employment and subjective well-being in Korean wage workers through the Cantril ladder Scale
Article information
Abstract
Background
The global labor market is moving towards increasing job instability. Relatively few studies have examined the relationship between precarious employment and subjective well-being using quantitative scales. We evaluated the association between wage workers' employment status and their subjective well-being through the Cantril ladder scale using Korean Welfare Panel Survey data (KOWEPS).
Methods
This study used KOWEPS data. A total of 4,423 wage workers were divided into permanently employed workers, temporarily employed workers and daily employed workers. The relationship between precarious employment and subjective well-being was analyzed by multiple linear regression adjusted for potential confounding factors.
Results
The more unstable the employment status, the lower the subjective well-being, which can be expressed by the Cantril ladder scale. The mean score of both temporarily employed and daily employed workers were statistically significantly lower (B = −0.454, p < 0.001; B = −0.994, p < 0.001, respectively) than permanently employed workers. This appeared to be the same when occupational and sociodemographic factors were adjusted (B = −0.153, p = 0.002 for temporarily employed, B = −0.610, p < 0.001 for daily employed).
Conclusions
The more unstable the employment status, the lower the subjective well-being score according to the Cantril ladder scale.
BACKGROUND
In recent decades, segmentation of the labor market has become a global trend [1], that is driven by globalization, as well as international and technological competition [2]. In the case of Korea, job stability has continued to decline since the 1997–1998 International Monetary Fund (IMF) bailout [34]. The IMF called on the Korean government to take steps to improve labor market flexibility [5], and as a result, Korean companies have actively pursued flexibility through layoffs, outsourcing and the use of temporary workers [4]. Precarious work has been defined as a combination of job insecurity, poor individual control over work (notably working hours), a low level of protection (against unemployment or discrimination), and little opportunity for training and career progression [6]. Before the IMF calling, 58% of South Korean workers were employed permanently but felt below 48% in 2000, while the proportion of temporary workers gradually increased to 24.4% by 2016 [7].
Precarious employment can adversely affect the physical health of workers [8]. This is due to reduced income, increased employment instability, low welfare benefits, lack of professional training, lack of prospects for promotion, and exposure to dangerous work environments [9-11]. Precarious employees have poorer overall health, more musculoskeletal disorders, and more exposure to hazardous situations than regular workers [8]. In addition, precarious employment can also adversely affect the mental health of workers [81213]. Precarious employees have lower mental status than permanent employees, which can be evaluated by psychological distress, psychological anxiety, and life satisfaction [14]. In addition, precarious employees have lower Centre for Epidemiologic Studies Depression Scale scores [15], are prescribed more psychoactive medications [16], and have lower General Health Questionnaire 12 scale scores [17].
At present, social interest in subjective well-being has increased. Well-being refers to contentment, satisfaction, or happiness [18]. Although there are many reviews on the relationship between precarious employment and mental health, relatively little research has been conducted on the relationship between precarious employment and subjective well-being. A study showed that precarious employees have a poorer quality of life as they are more anxious about employment than permanently employed workers and delay forming a relationship or having children [19]. In addition, their isolation in the workplace tends to be higher than permanent employees [19]. Furthermore, precarious employees are subjected to considerable stress and have difficulty living their daily lives due to the economic burden of an unstable income [20].
Studies on the effects of temporary employment on subjective well-being have largely relied on qualitative research methods and few articles have been analyzed by quantitative methods. Therefore, our study objective was to quantitatively examine how precarious employment affects employees' subjective well-being using the Cantril ladder scale.
METHODS
We used the Korean Welfare Panel Survey (KOWEPS) data to study how the employment status of permanent, temporary, and daily workers affect the Cantril ladder score and how it can be used to assess subjective well-being.
Study participants
This study used data from the 12th KOWEPS. The KOWEPS is an annual household unit panel survey conducted since 2005. Various surveys were conducted to show the income and consumption of the people and to identify welfare needs and perceptions. The Cantril ladder scale was analyzed from the 12th survey conducted in 2017.
In the 12th survey, 11,634 household members over the age of 15 were surveyed out of a total of 5,930 households. Of these, 4,889 household members were marked as paid workers. Four hundred and sixty-six individuals were missing information, such as income level, working hours, leaving 4,423 workers' data available for analysis.
The use of KOWEPS data did not require ethical approval because it provides scientifically available secondary data that does not contain personal information.
Subjective well-being
Subjective well-being is used in much the same way as the concept of happiness. Subjective well-being can be evaluated using various means, such as cognitive evaluation, which includes life satisfaction and emotional response to life [21].
There are several scales for measuring well-being such as the Cantril ladder scale, which is represented by an 11-level Likert score. It is one of the more quantitative scales able to evaluate subjective well-being and is a tool that measures people's attitudes towards life and its components in various aspects [22]. In this study, the Cantril ladder scale was used as a dependent variable to evaluate subjective well-being. It is designed to reduce the variation caused by individual emotional factors in the questionnaire and is evaluated in 11 steps from 0 (lowest) to 10 (highest). Respondents are asked to select the step they personally feel standing at this time [23]. The higher the score, the greater the satisfaction of your life [22]. The specific questions are as follows; “Please imagine a ladder with steps numbered from zero at the bottom to 10 at the top. The top of the ladder represents the best possible life for you and the bottom of the ladder represents the worst possible life for you. On which step of the ladder would you say you personally feel you stand at this time? [22]”.
Employment status
We divided employment status into 3 types: permanently employed, temporarily employed, and daily employed. The classification is based on the answers to the KOWEPS for household “3. In economic activity–Q3. The main states of participation in economic activity”. There are 9 answers to this question: 1) Permanently employed wage workers; 2) Temporary employed wage workers; 3) Daily employed wage workers; 4) Government-sponsored self-help workers; 5) Employers; 6) Self-employed workers; 7) Unpaid family workers; 8) Unemployed; 9) People without economic activity.
The permanently employed group consisted of people who answered 1 to the question and are defined as workers who have a working contract term of more than 1 year or who can continue to work if they wish without a fixed contract period. The temporarily employed group consisted of people who answered 2 to the question and are defined as workers who have a working contract term of more than 1 month but less than 1 year, or are expected to complete this work within 1 year, or are hired because of the necessity of completing a project. The daily employed group consisted of people who answered 3 to the question and are defined as those who work for less than 1 month, or are hired daily to work on a daily basis, or are paid for working without a fixed working place. Those who answered 4–9 to the question were excluded from this study because our analysis targets were wage workers with precarious employment.
Covariates
Among the factors that can affect subjective well-being, we applied those suggested in previous studies [24-26]. The occupational variables of interest were income per month (continuous variable), working hours per week(≤ 40, 41–52, > 52), working in a hazardous environment such as poorly equipped safety facilities or workplace pollution (yes or no), number of employees (≤ 5, 6–50, 51–300, > 300). The sociodemographic variables of interest were age (continuous variable), sex (male or female), religion (yes or no), education level (high school graduate or below, college graduate or higher), marital status (married, bereavement, divorce or separation, never married), and chronic diseases requiring medication (yes or no).
Income per month was divided into 5 categories. In 2017, the median monthly salary for Korean workers was 2.1 million won [27], and the basic living pension recipients were the group who earned less than 1.05 million won, which is 50% of the median. The categories were analyzed accordingly. Working hours per week were categorized into 3 groups according to whether the statutory working hours were exceeded. Number of employees was divided into 4 groups. In Korea, workplaces with less than 5 employees are classified as small businesses, while companies with 50 or more people are considered medium sized enterprises and companies with more than 300 employees regarded as large enterprises. Thus, we divided into 4 groups: ≤ 5, 6–50, 51–300, > 300.
Statistical analysis
We compared participants' characteristics, including sociodemographic variables and occupational variables among the 3 employment status groups: permanently employed, temporarily employed, and daily employed. Statistical differences were assessed using the χ2 test, with statistical significance set to p ≤ 0.05. Mann-Whitney U test, Kruskal-Wallis test, and 1-way analysis of variances (ANOVAs) were used to detect differences in the mean Cantril ladder scores among the variables with the statistical significance set to p ≤ 0.05.
Multiple linear regression models were used to assess the association between the Cantril ladder scores and employment status. KOWEPS finds and cuts excessively large weights (top 1%) and then weights the remaining values, excluding the cut values, by equally distributing the observations within the region, sex, and age to which the extreme observations belong. We performed the analysis by applying the assigned weights. We ran 4 models for each dependent variable: 1) an unadjusted model produced a simple association of the Cantril ladder score with employment status; 2) we adjusted the sociodemographic factors (age, sex, education level, marital status, religion, and chronic diseases) of model 1 to investigate whether these characteristics were related to the observed associations; 3) we adjusted the occupational factors (monthly salary, working hours per week, number of employees, working in dangerous environments) of model 1 to investigate whether these characteristics were responsible for the observed associations; 4) we adjusted both sociodemographic and occupational factors of model 1 to investigate whether their association was affected by the control variable added.
All statistical analyses were performed using IBM SPSS version 18.0 (IBM Corp., Armonk, NY, USA) and the bilateral significance level was set to 0.05.
RESULTS
Characteristics of the subjects
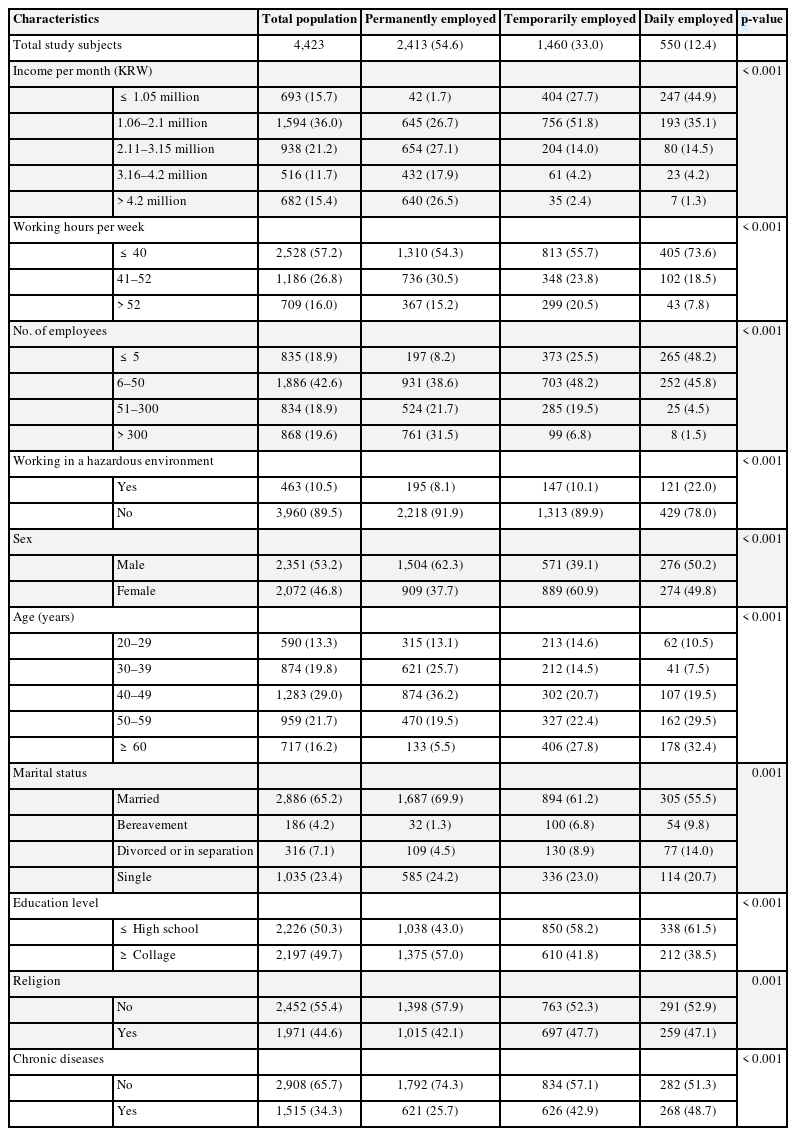
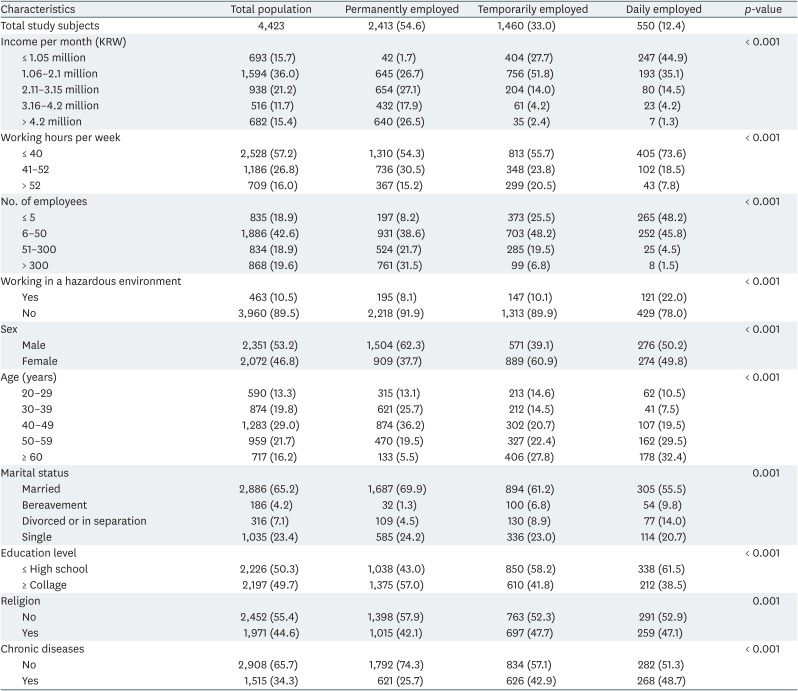
Of the 4,423 participants, 2,413 were permanently employed, 1,460 were temporarily employed and 550 were daily employed.
Table 1 shows a comparison of study participants' characteristics. The permanently employed group had higher monthly incomes, more working hours, higher rates of working in large companies, lower rates of working in hazardous environments, more males, higher rates of 30 to 40 year olds, lower rates of bereavement or divorce, higher rates of college education, higher rates of being non-religious, and less likely to be chronically ill than other groups.
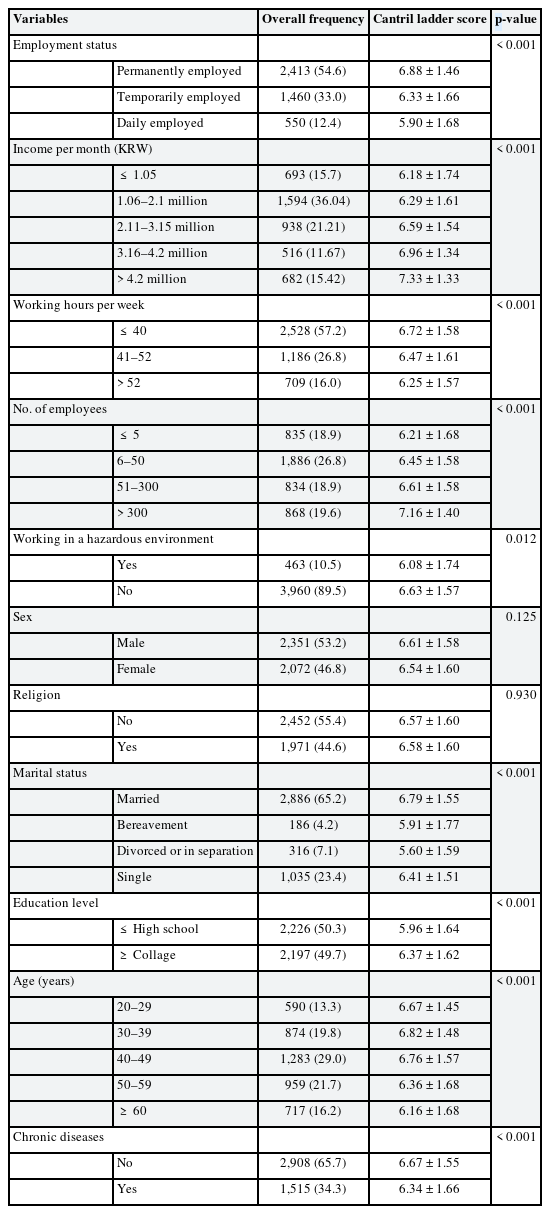
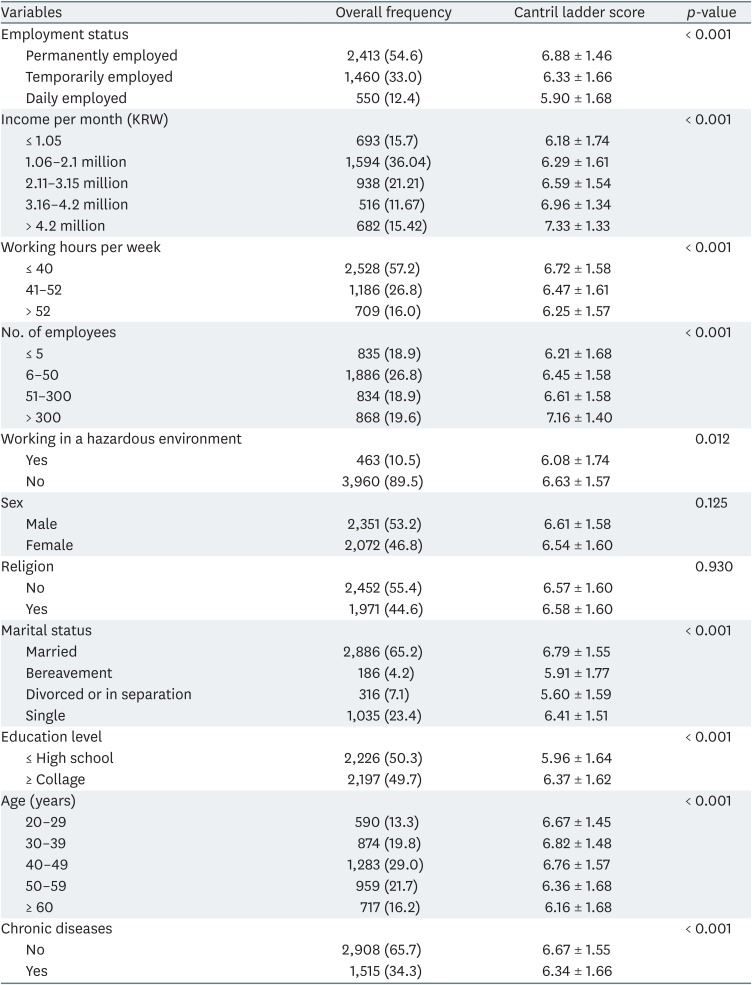
Table 2 shows the mean and standard deviation of the Cantril ladder scores according to the demographic characteristics of the subjects analyzed. In terms of employment status, the mean Cantril ladder score for permanent workers (6.88) was higher than for daily workers (5.90) and for temporary workers (6.33).
The 1-way ANOVA analysis showed that the higher the monthly salary, the higher the Cantril ladder score. The group working within statutory working hours had a higher mean Cantril ladder score than the other groups. In terms of the number of employees, the mean Cantril ladder score of the smallest work places with less than 5 employees was the lowest, however, there was no significant difference in the mean the Cantril ladder score between workplaces with less than 50 employees and those with less than 300 employees. The mean Cantril ladder score was lower for those who work in hazardous environments compared to those who did not.
The difference in the mean Cantril ladder scores according to sex and religion was not statistically significant. In terms of marital status, married individuals scored higher on the Cantril ladder than singles. In the case of bereavement and divorced individuals, the mean Cantril ladder scores were the lowest, and there was no statistically significant difference between 2 groups. The mean Cantril ladder score for college graduates and above was higher than for high school graduates and below. The mean Cantril ladder score in the group with chronic disease was lower than in the group without. The mean Cantril ladder scores differed according to age. In general, as age increased, the mean scores tended to decrease, however, there was no significant difference between those in their 20, 30, and 40 years. In addition, there was also no significant difference between those in their 50 and 60 years.
Association between the Cantril ladder score and precarious employment
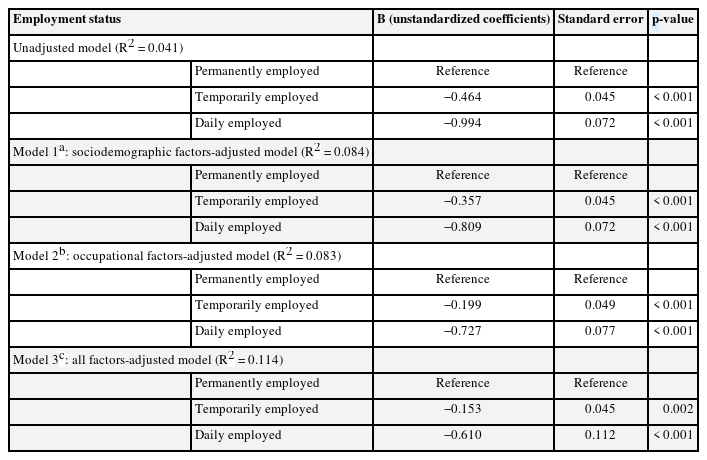
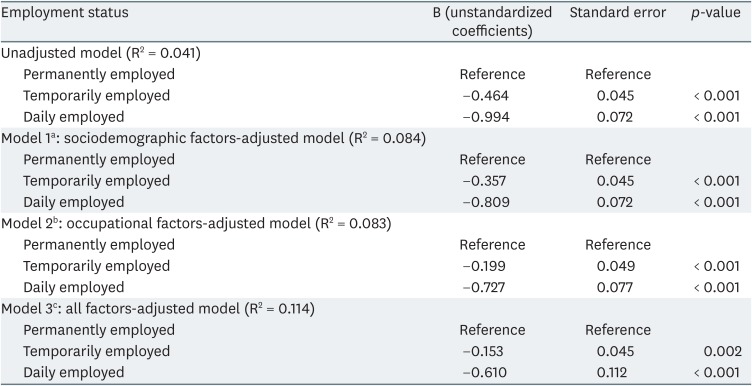
Table 3 shows the results of a multiple linear regression analysis performed on the Cantril ladder score and employment status. The beta coefficient indicates that employment status is highly correlated with the Cantril ladder score. In particular, the Cantril ladder scores were lower for those who worked daily (B = −0.994, p < 0.001). The R2 of the test was 0.041.
In model 1, precarious employment was found to be significantly related to the Cantril ladder score when sociodemographic factors (age, sex, religion, education level, marital status, and chronic diseases) were adjusted. In model 2 (occupational factors adjusted) precarious employment was found to be significantly related to the Cantril ladder score even when various occupational variables such as income per month, working hours per week, working in a hazardous environment, and number of employees were controlled. In model 3 (all sociodemographic and occupational factors adjusted), precarious employment was observed to have a significant effect on the subjective well-being scores even after the adjustment of sociodemographic factors and occupational factors (B = −0.153, p = 0.002 for temporary workers, B = −0.610, p < 0.001 for daily workers). The R2 of the test was 0.114.
DISCUSSION
We conducted this study to evaluate the association between precarious employment and employees' subjective well-being. Our findings show that people with more unstable employment status have lower subjective well-being scores than those with more stable employment status. The same trend was maintained even when sociodemographic and occupational factors were adjusted. Compared to permanently employed workers, the temporarily employed workers scored lower on the Cantril ladder scale, while the daily workers scored the lowest. Thus, there is an observable decrease in workers' subjective well-being using the Cantril ladder scale when their employment status becomes more unstable.
The present study is the first to examined the relationship between workers' employment status and their subjective well-being using the Cantril ladder scale. Therefore, few comparable studies exist, however, there are previous studies that use other methods. Studies conducted by Bardasi and Francesconi [12] have shown that atypical employment has an impact on individual well-being. They state that an atypical employment status does not affect mental health or life satisfaction but may affect some in job satisfaction [12]. However, their study was based on the results of the UK survey of 1990–2000 in 2004, so there are likely many working environment differences between the UK in the late 20th century and Korea in the early 21th century.
On the other hand, a study examining the relationship between employment conditions and mental health in Europe suggests that low household incomes and non-regular employment is associated with poor mental health [28]. In this study, the World Health Organization (WHO)-5 Well-being Index was used as an index of mental health and the trend was similar to our study, which was assessed using the Cantril ladder scale. There are several studies conducted in Korea that used the WHO-5 indicator to study the relationship between employment status and well-being. Lee et al. [29] analyzed the relationship between perceived inequality and well-being using the WHO-5 indicator and, found that the percentage of people with high WHO-5 scores was higher in permanent workers than in temporary or daily workers. Lee et al. [30] analyzed the relationship between psychosocial factors and psychological well-being in Korean employment workers, where the percentage of regular workers with higher WHO-5 scores was higher than that of temporary workers.
WHO-5 is composed of a 5-item measure of one's positive mood (being in a good mood, feelings positive and comfortable), vitality (being active, feeling fresh and well-rested), and overall interests and can be used as a subjective survey for one's quality of life [1831]. In particular, WHO-5 is used as a measure of major depressive disorder (MDD) and compared to the structured clinical interview of Diagnostic and Statistical Manual of Mental Disorders-IV, WHO-5 has shown sensitivity results for MDD ranging from 86% to 95%[32]. Another tool for evaluating well-being is the quality of life scale (QOLS) [33]. The QOLS was originally a 15-item instrument that measured 5 conceptual quality of life domains: material and physical well-being; relationships with other people; social, community, and civic activities; personal development and fulfillment; and recreation [33]. This tool can be used to express quality of life in more complex ways and is used in areas that require more detailed research, such as the study of quality of life for people with chronic illnesses.
On the other hand, the Cantril ladder scale is a single-item health indicator called self-anchoring because it consists of an assessment of an individual's minimum and maximum life satisfaction [22]. A single item scale is cost-effective and easy to apply, so there is less difficulty in translation problems when comparing cultural differences [18]. In addition, validity results show high correlations between single-item indicators and much longer scales [34]. However, single-item scales could be more sensitive than multi-item scales due to contextual effects from preceding questions in a survey. For example, if the single item was preceded by a section on depression, answers will tend to be more negative than if the item was preceded by a section on well-being [18]. The Cantril ladder scale is also used in a variety of fields in medicine. For example, it has been used as a measure for evaluating the degree of life satisfaction after surgery [35], and in a study for evaluating the difference in subjective well-being between 2 groups [36].
Interest in the relationship between precarious employment and health has continued to increase in recent years, and a journal published in 2016 sheds light on what should be known about precarious employment and health in the next decade [37]. Here, a model had been proposed that link precarious employment to negative health outcomes and quality of life. Precarious employees are exposed more to harmful physical and psychosocial working conditions than permanently employed workers, and this lack of social protection affects material deprivation resulting in health consequences [1937]. To be specific, if job security is not guaranteed, workers' anxiety may increase [3839], job satisfaction may decrease [40], which can lead to lower subjective well-being. A qualitative study of a temporary agency employee suggests that helplessness, lack of support, inequality of material compensation, and the lack of resolving employment insecurity can have a negative impact on the mental health of temporary employees [41].
Meanwhile, studies have shown that the transition to permanent employment can improve the mental health status of individuals and increase their subjective well-being [42]. In particular, through the Korean labor reform program, contract workers with a term of 2 years or more were automatically converted to open contract workers with employment protection levels similar to those of permanent workers from July 1, 2009. The study found that job status change improves subjective well-being, which has a positive effect on worker health [43].
The strength of this study is that it is the first to examine the relationship between precarious employment and subjective well-being using the Cantril ladder scale, controlling for the effects of various potential confounding variables. In addition, the study design included a large sample size that represented Korean wage workers using data from KOWEPS. However, there are some limitations to this study. First, this study is a cross-sectional study that evaluates the relationship between employment status and subjective well-being in response to a questionnaire at the time of the survey. According to Dawson C, cross-sectional studies can overestimate the health effects of employment status [14]. More meaningful research results will require longitudinal research that evaluates the health effects of precarious employment over time. From the 12th survey, the Korean Welfare Panel added a question about the Cantril ladder scale. This may be overcome by a study that examines changes in the Cantril ladder scores of people with occupational status changes based on the cumulative panel surveys. In particular, the Cantril ladder scale can produce more meaningful results in longitudinal studies looking at changes over time. Second, it was not possible to classify employment types in detail. Although the nature of employment status may vary according to various occupations, this study evaluated employment status without considering the type of occupation. Third, all data was collected from questionnaire report surveys, which could potentially include recall bias.
CONCLUSIONS
This study found that the subjective well-being index using the Cantril ladder scale was closely related to precarious employment in Korean wage workers. The more unstable the employment status, the lower the subjective well-being score according to the Cantril ladder scale. This can be thought of in connection with the deterioration of employment status and the unstable occupational stability. Observing changes in the subjective well-being index along with changes in employment status may be a meaningful study in the future.
Notes
Competing interests: The authors declare that they have no competing interests.
Availability of data and materials: Please contact author for data requests.
Author Contributions:
Conceptualization: Choi G, Park SG.
Data curation: Choi G, Park SG.
Formal analysis: Choi G, Park SG.
Investigation: Choi G, Park SG.
Methodology: Kim HC, Leem JH.
Writing - original draft: Choi G.
Writing - review & editing: Park SG, Won Y, Ju H, Jang SW, Kim HD, Jang JS, Kim HC, Leem JH.
Abbreviations
KOWEPS
Korean Welfare Panel Survey
IMF
International Monetary Fund
ANOVA
analysis of variance
WHO
World Health Organization
MDD
major depressive disorder
QOLS
quality of life scale

